Transcriptional Fingerprint of
Hypomyelination in
Zfp191
null
and
Shiverer
(Mbp
shi
) Mice
Joshua D. Aaker
1,*, Benayahu Elbaz
1,*, Yuwen Wu
1,#a,
Timothy J. Looney
2,#b, Li Zhang
2, Bruce T. Lahn
2, and Brian Popko
1Abstract
The transcriptional program that controls oligodendrocyte maturation and central nervous system (CNS) myelination has not been fully characterized. In this study, we use high-throughput RNA sequencing to analyze how the loss of a key transcription factor, zinc finger protein 191 (ZFP191), results in oligodendrocyte development abnormalities and CNS hypomyelination. Using a previously described mutant mouse that is deficient in ZFP191 protein expression (Zfp191null), we demonstrate that key transcripts are reduced in the whole brain as well as within oligodendrocyte lineage cells culturedin vitro. To determine whether the loss of myelin seen inZfp191nullmice contributes indirectly to these perturbations, we also examined the transcriptome of a well-characterized mouse model of hypomyelination, in which the myelin structural protein myelin basic protein (MBP) is deficient. Interestingly,Mbpshi(shiverer) mice had far fewer transcripts perturbed with the loss of myelin alone. This study demonstrates that the loss of ZFP191 disrupts expression of genes involved in oligodendrocyte maturation and myelination, largely independent from the loss of myelin. Nevertheless, hypomyelination in both mouse mutants results in the perturbation of lipid synthesis pathways, suggesting that oligodendrocytes have a feedback system that allows them to regulate myelin lipid synthesis depending on their myelinating state. The data presented are of potential clinical relevance as the human orthologs of theZfp191andMBPgenes reside on a region of Chromosome 18 that is deleted in childhood leukodystrophies.
Keywords
cholesterol biosynthesis, hypomyelination, oligodendrocyte development, shiverer, transcriptional networks, ZFP191
Received June 22, 2016; Received revised August 12, 2016; Accepted for publication August 22, 2016
Introduction
Oligodendrocytes are the cells that produce myelin in the vertebrate central nervous system (CNS). The majority of oligodendrocyte progenitor cells (OPCs) are derived from neural progenitor cells in the subventricular zone (Richardson et al., 2006). During CNS development, OPCs migrate along vasculature to their target axons where they terminally differentiate to mature oligo-dendrocytes, express myelin genes, produce myelin, wrap axons, and provide metabolic axonal support (Simons and Nave, 2015; Tsai et al., 2016).
OPCs are able to proliferate until they transit to their target axons where they undergo terminal differentiation, which is achieved through a delicate balance of both
1Department of Neurology, The University of Chicago Center for
Peripheral Neuropathy, The University of Chicago, IL, USA
2Department of Human Genetics, The University of Chicago, IL, USA
Corresponding Author:
Brian Popko, Department of Neurology, The University of Chicago Center for Peripheral Neuropathy, The University of Chicago, IL 60637, USA. Email: [email protected]
#aCurrent Address: Department of Neurology, F.M. Kirby Neurobiology
Center, Boston Children’s Hospital, Harvard Medical School, Boston, MA, USA.
#bCurrent Address: Department of Pathology, Stanford University School of
Medicine, Stanford, CA, USA.
*These authors contributed equally to this work.
ASN Neuro
September-October 2016: 1–17
!The Author(s) 2016
DOI: 10.1177/1759091416670749 asn.sagepub.com
Creative Commons CC-BY: This article is distributed under the terms of the Creative Commons Attribution 3.0 License
inhibitors and promoters of differentiation (Menn et al., 2006). Among the inhibitors of oligodendrocyte differ-entiation, the G-protein-coupled receptor 17 is an oligodendrocyte-specific receptor that strongly inhibits differentiation and may work by increasing the expression of inhibitors of differentiation 2 and 4 (ID2/ID4; Wang et al., 2001; Chen et al., 2009). ID2/ID4 along with Hes family bHLH transcription factors 1 and 5 (HES1/5) have been shown to enforce the proliferating OPC state and to repress terminal differentiation (Wu et al., 2003; Liu et al., 2006). In addition, the Notch and Wnt signal-ing pathways have been implicated in suppresssignal-ing oligo-dendrocyte differentiation (Wang et al., 1998; Fancy et al., 2009; Nakatani et al., 2013). Wnt signals were shown to be upstream of bone morphogenetic protein signaling (Feigenson et al., 2011), which was shown to inhibit oligodendrocyte differentiation (Grinspan et al., 2000; Miller et al., 2004; Samanta and Kessler, 2004; See et al., 2004; Cheng et al., 2007). Despite the inhibitory effect of the Wnt signaling pathway on oligodendrocyte differentiation, the Wnt effector transcription factor 4 promotes oligodendrocyte differentiation (Fancy et al., 2009; Hammond et al., 2015).
Among the promoters of differentiation, oligodendro-cyte transcription factor 2 promotes differentiation of oligodendrocytes by recruiting the chromatin-remodeling enzyme SWI/SNF related, matrix associated, actin-dependent regulator of chromatin, subfamily a, member 4 (SMARCA4/BRG1) to regulatory elements of key
genes, includingZfp191andSox10during differentiation
(Yu et al., 2013). SRY (sex determining region Y)-box 10 (SOX10) is required for the generation of myelinating oligodendrocytes and is a direct activator of several myelin-related genes (Li et al., 2007). One of the genes
controlled by SOX10 is myelin regulatory factor (MYRF;
Hornig et al., 2013). SOX10 binds in the first intron of the
MYRF gene and induces its expression during
oligo-dendrocyte differentiation. Following its induction,
MYRFmediates the progression of premyelinating
oligo-dendrocytes to a mature, myelinating state (Emery et al.,
2009). MYRF and SOX10 target many of the same
myelin gene enhancers and promoters but also appear to target individual enhancers independently of the other (Bujalka et al., 2013; Hornig et al., 2013).
Previous work from our laboratory (Howng et al., 2010) has demonstrated that zinc finger protein 191 (ZFP191, also known as ZFP24) is required for oligo-dendrocyte differentiation. We have shown that many of the oligodendrocyte-specific genes induced during oligodendrocyte differentiation (including abundantly
expressed myelin genes such asMbpandPlp1) are reliant
on ZFP191 for their expression (Howng et al., 2010); however, the full spectrum of genes that are affected by loss of ZFP191 was unknown. Therefore, we
charac-terize here the effect of Zfp191 loss on the whole
transcriptome by high-throughput RNA sequencing (RNA-seq).
ZFP191 contains a SCAN domain that may be involved in protein–protein interaction (Williams et al.,
1999) and four C2H2zinc finger domains that bind DNA
(Wang et al., 2008). ZFP191 is a member of the C2H2
zinc-finger protein family, many members of which are known to be DNA binding proteins that function as tran-scriptional regulators (Edelstein and Collins, 2005).
Consistent with this, we find that loss of Zfp191results
in substantial changes in the transcriptome of the whole brain and in the transcriptome of cultured oligodendro-cyte lineage cells.
To examine whether the substantial changes in the tran-scriptome in theZfp191nullmice CNS are due to the direct loss of ZFP191 or whether they represent a secondary consequence of the inability to produce myelin, we
per-formed RNA sequencing using theshiverermouse, which
is a model of hypomyelination that resulted from a spon-taneous null mutation in the gene encoding the structural myelin protein, myelin basic protein (MBP; Roach et al., 1985). We find that unlike hypomyelination originating
from the lack ofZfp191, the effect of the MBPmutation
on the transcriptome was minor, suggesting that the loss of ZFP191 disrupts transcripts involved in oligodendrocyte maturation and myelination largely independent from the loss of myelin. Interestingly, the loss of myelin in both mouse mutants, however, results in the perturbation of the cholesterol biosynthesis pathway.
Materials and Methods
Animal Work
Generation of Zfp191null mice on the C57BL/6J
back-ground has been previously described (Howng et al.,
2010). The C3Fe.SWV-Mbpshi/J shiverer strain of mice
was purchased from The Jackson Laboratory (stock 001428) and has been previously described (Readhead et al., 1987). All animal procedures were conducted in complete compliance with the National Institutes of Health Guide for the Care and Use of Laboratory Animals and were approved by the Institutional Animal Care and Use Committee of the University of Chicago.
Cell Culture
Primary OPCs were isolated from brain and
enzymati-cally and mechanically dissociated as previously
described (Emery and Dugas, 2013). Briefly, both cortices were removed and cells were dissociated by enzymatic and mechanical methods. The single cell suspension was then immunopanned on two plates coated with 50 mM
Tris-HCl pH¼9.5 and goat anti-mouse IgGþIgM
coated in 50 mM Tris-HCl with goat anti-mouse IgM,
m-chain specific (Jackson ImmunoResearch,
115-005-020). These plates were then sequentially incubated with rat neural antigen 2 (Ran-2), galactocerebroside (GC), and oligodendrocyte marker (O4) hybridomas,
respectively, in 0.2% bovine serum albumin and
Dulbecco’s phosphate-buffered saline (Life Technologies #14040133). The plates served as two sequential negative selection plates coated with Ran-2 and GC hybridomas followed by a positive selection plate coated with O4 hybridoma. The Ran-2 immunopanning captures type 1 astrocytes and meningeal cells (Bartlett et al., 1981). The GC immunopanning captures differentiated oligodendro-cytes (Sommer and Schachner, 1981). The O4 hybridoma is able to capture O-2A progenitor cells (Sommer and Schachner, 1981). Cells were then trypsinized (0.25% in
Earle’s balanced salt solution, Life Technologies
#14155063) and plated on poly-D-lysine coated plates.
Cells were maintained in Sato serum-free Dulbecco’s modified Eagle medium (Life Technologies #11960069) as previously described with the addition of B27 supple-ment (Life Technologies #17504044; Dugas et al., 2006). For proliferation media, platelet-derived growth factor-AA (PDGF-factor-AA; 10 ng/ml, PeproTech #100-13A), neuro-trophin-3 (1 ng/ml, PeproTech #450-03), forskolin (Sigma Aldrich [0.01 mM]), and ciliary neurotrophic factor (CNTF; 10 ng/ml, PeproTech #450-13) were added. To stimulate differentiation, PDGF-AA was removed and triiodothyronine (40 ng/ml, Sigma # T6397) was added. Media was changed every other day and differentiated cells were collected after 5 days.
RNA Sequencing
For whole-brain RNA sequencing, mice were anesthetized with avertin (0.5% 2,2,2-tribromoethanol; Sigma-Aldrich #T48402; w/v), 0.5% tert-amyl alcohol; Fluka #PHR1667; v/v) in MillQ water) used at 100ml per 10 g body weight, and the cerebral hemispheres were removed and snap
frozen at 80
C at postnatal Day 21. Total RNA was isolated using Aurum Total RNA Fatty and Fibrous Tissue Kit (Bio-Rad #732-6830) following the manufac-turer’s protocol. OPC and oligodendrocyte total RNA was collected using Aurum Total RNA Kit (Bio-Rad #732-6820). Two biological replicates were used for all samples. The quality of the RNA was assessed using an Agilent 2100 Bioanalyzer. RNA sequencing libraries were prepared using Illumina TruSeq RNA sample Kit (#RS-122-2001) and sequenced by HiSeq 2000 and HiSeq 2500 sequencers using HiSeq SBS Kit (Illumina #FC-401-4002) at the University of Chicago Functional Genomics Facility. Sequencing data have been uploaded to Sequence Read Archive from the National Center for Biotechnology Information through the National Library of Medicine under accession number PRJNA338665.
Bioinformatics
RNA sequencing reads were mapped to the mm9 genome using BowTie v.1 and the ExpressionPlot pipeline (Langmead et al., 2009; Friedman and Maniatis, 2011). Differential expression was performed using DEseq in the ExpressionPlot software package (Anders and Huber, 2010). The Bonferroni correction was used within DEseq to control for multiple comparisons. Only
tran-scripts 0.5 Reads per Kilobase per Million (RPKM)
mapped reads,1.5-fold change, andp<.001 were
ana-lyzed. p Value of 8.2810307
or lower was rounded to zero. Kyoto Encyclopedia of Genes and Genomes
(KEGG) pathway analysis was performed using
DAVID (Kanehisa and Goto, 2000; Huang da et al., 2009a, 2009b; Kanehisa et al., 2014). The Galaxy envir-onment was used to compare datasets (Giardine et al., 2005; Blankenberg et al., 2010; Goecks et al., 2010). Cellular identity stratification was done using the online RNA-Seq transcriptome and splicing database (http:// web.stanford.edu/group/barres_lab/brain_rnaseq.html; Zhang et al., 2014). The top 500 transcripts for each cell identity from the database were compiled in order to allow for cell-type comparison and grouping from our results.
Real-Time PCR
RNA was collected using Aurum Total RNA Kit (Bio-Rad #732-6820). RNA integrity was verified using Agilent chip (Agilent Technologies). cDNA was gener-ated using iScript cDNA Synthesis Kit (Bio-Rad
#1708890) following the manufacturer’s protocol.
Real-time polymerase chain reaction (PCR) was performed on the cDNA using iQ SYBR Green Supermix (Bio-Rad #1708882) using a CFX96 Touch Deep Well Real-Time PCR Detection System (Bio-Rad #1854095). Each sample was done in triplicate. Relative expression from amplified cDNA samples was determined using the
2
CT method (Pfaffl, 2001). The primers sequences
for all the transcripts that were selected for analysis are in Table S1. The expression of the selected transcripts was normalized to the housekeeping gene
hypoxanthine-gua-nine phosphoribosyltransferase (Hprt) cDNA.
Results
Loss of
Zfp191
Expression Perturbs the
Whole Brain Transcriptome
examine changes in the transcriptome. RNA sequencing was performed on postnatal Day 21 (P21) and
whole-brain RNA samples were taken from Zfp191null and
Zfp191þ/þlittermates. The levels of 394 transcripts were
determined to be significantly different in the Zfp191null
brains compared with Zfp191þ/þ brains (Tables S2 and
S3). The majority of the perturbedZfp191nullbrain tran-scripts displayed reduced levels of expression in the mutant animals.
The loss of ZFP191 resulted in the decreased expression of 327 transcripts when compared with the
Zfp191þ/þ CNS transcriptome (Table S2). Several tran-scripts that encode key myelin proteins, such as MBP and myelin oligodendrocyte glycoprotein (MOG; Matthieu and Amiguet, 1990), were identified as having decreased transcript levels. We also observed that transcripts that encode key oligodendrocyte transcriptional factors such as SOX10 and MYRF had reduced expression with loss of ZFP191 along with downstream targets of MYRF, such as the transcript for ring finger and FYVE-like
domain containing E3 ubiquitin protein ligase (Rffl;
Bujalka et al., 2013).
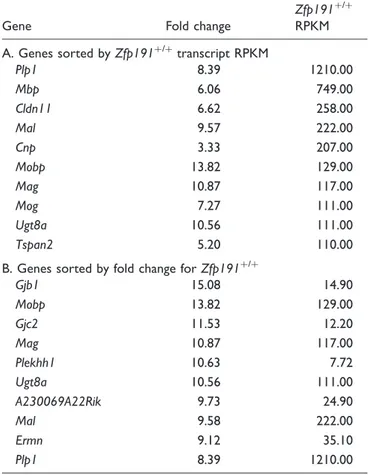
Table 1A and B show the top 10 transcripts based on expression level, as determined by RPKM values, and fold change, respectively, that have reduced expression
in the Zfp191null whole brain. Transcripts with reduced
expression in the Zfp191null brain were analyzed for
changes in characterized pathways using the KEGG (Kanehisa and Goto, 2000; Kanehisa et al., 2014). The steroid biosynthesis pathway is significantly disturbed due to disruption of transcripts that encode key biosyn-thetic pathway proteins such as 3-hydroxy-3-methylglu-taryl-CoA reductase (HMGCR), fatty acid 2-hydroxylase (FA2H), and 24-dehydrocholesterol reductase (Saher and Simons, 2010; Table S2). Proper synthesis of cholesterol is known to be required for production of compact myelin in oligodendrocytes (Saher et al., 2005).
Loss of
Zfp191
Expression Mainly Affects
Cell-Specific Transcripts in the Oligodendrocyte Lineage
Along With Key Signaling Cascades
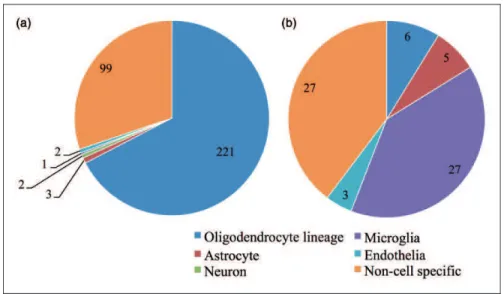
To determine the cells that are most affected by the loss of ZFP191 in the brain, we stratified the 394 differentially expressed transcripts (Tables S2 and S3) into cell-specific identities (oligodendrocyte lineage, neuron, astrocyte, microglia, endothelia, or noncell specific) using the online RNA-Seq transcriptome and splicing database (Zhang et al., 2014). Strikingly, of the 327 transcripts that had lower expression levels with loss of ZFP191, 221 transcripts were associated with oligodendrocyte line-age cells (Figure 1).
Loss ofZfp191expression increased the mRNA levels
of 67 transcripts in the mutant CNS; 10 transcripts with the most abundant RPKM are listed in Table 2 (the full
list is in Table S3). One transcript that was increased
encodes glial fibrillary acidic protein (Gfap; Bignami
et al., 1972), which may suggest astrogliosis. This is sup-ported by a 2.5-fold increase in serine peptidase inhibitor,
clade A, member 3N (Serpina3n), which has been shown
to display increased expression in reactive astrocytes (Zamanian et al., 2012). In addition, there were increases in multiple transcripts that encode complement factors and chemokine ligands that are expressed by microglia (Zhang et al., 2014) that account for 39% of the elevated transcripts. KEGG pathway analysis indicated that com-plement, chemokine signaling, and Toll-like receptor pathways are increased with loss of ZFP191 in the whole brain. Unlike the transcripts that had decreased expression, which were mostly associated with oligo-dendrocyte lineage cells (Figure 1(a)), transcripts that have higher expression levels with loss of ZFP191 were more often noncell specific or associated with gliosis
Table 1. Top 10 Transcripts That Have Reduced Expression in
Zfp191nullWhole Brains.
Gene Fold change
Zfp191þ/þ
RPKM
A. Genes sorted byZfp191þ/þ
transcript RPKM
Plp1 8.39 1210.00
Mbp 6.06 749.00
Cldn11 6.62 258.00
Mal 9.57 222.00
Cnp 3.33 207.00
Mobp 13.82 129.00
Mag 10.87 117.00
Mog 7.27 111.00
Ugt8a 10.56 111.00
Tspan2 5.20 110.00
B. Genes sorted by fold change forZfp191þ/þ
Gjb1 15.08 14.90
Mobp 13.82 129.00
Gjc2 11.53 12.20
Mag 10.87 117.00
Plekhh1 10.63 7.72
Ugt8a 10.56 111.00
A230069A22Rik 9.73 24.90
Mal 9.58 222.00
Ermn 9.12 35.10
Plp1 8.39 1210.00
RNA sequencing was performed onZfp191nullandZfp191þ/þ
whole-brain RNA samples (n¼2 for each genotype). Transcripts listed forZfp191þ/þ whole brains in A had ap<.001 fold change when comparingZfp191þ/þ
versusZfp191nullwhole brains and are sorted by RPKM value. Transcripts listed forZfp191þ/þwhole brains in B had a RPKM value
(Figure 1(b)). This may suggest that loss of Zfp191
expression may perturb cells indirectly by disrupting normal oligodendrocyte maturation and function.
Loss of ZFP191 Perturbs the Transcriptome of OPCs
Because the loss of ZFP191 in the whole brain predom-inantly disrupts oligodendrocyte lineage-specific tran-scripts, we wanted to further explore this effect in purified primary cells. We therefore isolated and cultured
OPCs from bothZfp191nullandZfp191þ/þbrains. Half of
these cells were allowed to differentiate into mature oligo-dendrocytes. Both cell types from each genotype were then collected for RNA sequencing analysis. We dis-covered that the absence of ZFP191 during the OPC stage perturbs 444 transcripts (Tables S4 and S5), of
which 160 transcripts had decreased expression.
Tables 3A and B lists the transcripts that are most
abun-dant in the Zfp191þ/þ OPCs and their corresponding
reduction with the loss of ZFP191. Transcripts involved in many signal transduction pathways were disturbed
including delta-like 1 and 3 (Dll1, Dll3), which are
involved in the Notch pathway and SRY (sex
determin-ing region Y)-box 9 (Sox9), which is involved in cAMP
signaling (Grandbarbe et al., 2003; Tsuda et al., 2003). KEGG analysis demonstrated that Notch, mitogen-acti-vated protein kinase (MAPK), calcium signaling, and focal adhesion pathways were disrupted with loss of ZFP191 in OPCs.
Loss of ZFP191 results in 284 transcripts being
expressed at a higher level than in Zfp191þ/þ OPCs
(Table 4A and B). Of these, transcripts such as Id2,
SRY (sex determining region Y)-box 5 (Sox5), and
Nkx6.2are known to be downregulated when OPCs stop proliferating (Wang et al., 2001). In addition, in the
absence of ZFP191, histone deactylase 1 (Hdac1) is
highly expressed along with wingless-type mouse mam-mary tumor virus integration site family member 7A (Wnt7a), both of which code for proteins that have been shown to be involved in the maintenance of the progenitor state (Ye et al., 2009; Yuen et al., 2014). Loss of ZFP191 also causes several transcripts associated with disruption to the MAPK and Wnt signaling pathways to be more abundant. Overall, these analyses demonstrate that the Figure 1. Loss ofZfp191expression mainly perturbs transcripts associated with the oligodendrocyte lineage in the whole brain. Number of transcripts with decreased expression by loss of ZFP191 (A) or increased expression (B) sorted into cellular identity categories using data from Zhang et al. (Zhang et al., 2014).Note. ZFP191¼zinc finger protein 191.
Table 2. Top 10 Transcripts That Have Increased Expression in
Zfp191nullWhole Brains.
Gene Fold change Zfp191nullRPKM
Genes sorted byZfp191nulltranscript RPKM
Apoe 1.60 1050.00
Mt1 1.61 452.00
Mt2 1.53 303.00
Fam107a 1.70 161.00
Gfap 1.97 106.00
Ctss 1.69 33.90
C1qa 1.66 29.00
C1qb 1.70 28.20
Gabra2 1.62 21.40
C1qc 1.82 16.20
Zfp191 mutation disrupts gene expression in the oligo-dendrocyte lineage more than previously speculated.
Loss of ZFP191 Perturbs Key Cell Signaling
Pathways in Mature Oligodendrocytes
The absence of ZFP191 perturbs the mRNA levels of 5,564 transcripts in mature oligodendrocytes (Tables S6 and S7). Over 45%, or 2,513, transcripts have decreased abundance with loss of ZFP191 in oligodendrocytes.
Transcripts for Sox10, Myrf, Mbp, Mog, Nkx6.2, and
G protein-coupled receptor 37 (Gpr37), all known to
code for proteins that play a significant role in myelin-ation (Emery, 2010b), are decreased with loss of
Zfp191 expression (Table 5A and B). Many KEGG-identified pathways are perturbed in mutant oligodendro-cytes including regulation of actin cytoskeleton, receptor
tyrosine-protein kinase erbB-3 (Erbb), MAPK,
sphingomyelin metabolism, and focal adhesion.
Transcripts that were more abundant (3,051) in the
Zfp191null oligodendrocytes compared with Zfp191þ/þ
oligodendrocytes include PDGF receptor alpha
polypep-tide (PDGFra), sex determining region Y-box 4 (Sox4),
and myelocytomatosis oncogene (c-Myc) along with the
known differentiation repressorsId2/4andHes1/5(Table
6A and B).
Transcripts that are decreased due to loss of ZFP191 in cultured primary mature oligodendrocytes represent nearly 77% of transcripts that are also decreased in the whole brain (327 total transcripts decreased in the whole brain, 252 of which are also decreased in cultured pri-mary mature oligodendrocytes; Figure 2). The transcripts that are decreased in both datasets include critical myelin-associated transcripts such as 20
,30
-cyclic nucleotide 30
phosphodiesterase (Cnp), aspartoacylase (Aspa), myelin and lymphocyte protein T cell differentiation protein
Table 3. Top 10 Transcripts That Have Reduced Expression in
Zfp191nullOPCs.
Gene Fold change Zfp191þ/þ
RPKM
A. Genes sorted byZfp191þ/þ
transcript RPKM
Ptn 1.77 265.00
Bcan 1.99 178.00
Gpr56 2.17 119.00
Add3 2.18 101.00
Dll1 1.82 61.50
Tubb6 2.78 63.40
Rev3l 1.98 43.90
Chrna4 2.33 47.10
Pnmal2 1.75 35.30
Slc38a1 1.78 34.70
B. Genes sorted by fold change forZfp191þ/þ
Matn4 27.70 27.40
Pstpip2 15.27 16.70
Pcdh11x 5.77 9.14
9030025P20Rik 5.24 10.90
Dll3 4.92 38.60
Col18a1 4.71 10.20
Hddc3 4.15 30.10
Tmem179 4.13 11.70
Kifc3 3.98 59.10
Lmo3 3.92 15.30
RNA sequencing was performed on RNA samples isolated fromZfp191null andZfp191þ/þOPCs culturedin vitro(n
¼2 for each genotype). Transcripts listed forZfp191þ/þOPCs in A had ap
<.001 fold change when comparing
Zfp191þ/þ versus Zfp191null OPCs and are sorted by RPKM value. Transcripts listed for Zfp191þ/þ OPCs in B had a RPKM value
7, a p<.001 fold change when comparingZfp191þ/þversusZfp191nullOPCs,
and are sorted by fold changes.
Table 4. Top 10 Transcripts That Have Increased Expression in
Zfp191nullOPCs.
Gene Fold change Zfp191nullRPKM
A. Genes sorted byZfp191nulltranscript RPKM
Fscn1 1.82 360.00
Rps26 1.91 249.00
Npy 64.28 214.00
Vgf 24.33 214.00
Olfm1 8.11 131.00
Id2 3.80 131.00
Wnk2 20.09 123.00
Tgfa 1.76 116.00
Elfn1 3.90 89.80
Mn1 50.44 79.80
B. Genes sorted by fold change forZfp191null
Pax7 24760.00 15.40
Tmem119 936.10 7.82
Epha2 934.90 41.10
Rps3a 261.00 44.90
Rps18 240.60 42.10
Ebi3 72.15 17.10
Npy 64.28 214.00
Mn1 50.44 79.80
Kcnip1 33.72 73.00
Tspan18 31.19 16.60
RNA sequencing was performed on RNA samples isolated fromZfp191null andZfp191þ/þOPC culturedin vitro(n
¼2 for each genotype). Transcripts listed forZfp191nullOPCs in A had ap
<.001 fold change when comparing
Zfp191null versus Zfp191þ/þ OPCs and are sorted by RPKM value. Transcripts listed for Zfp191null OPCs in B had a RPKM value 7, a p<.001 fold change when comparingZfp191nullversusZfp191þ/þOPCs,
(Mal1), proteolipid protein 1 (Plp1), myelin-associated
oligodendrocyte basic protein (Mobp), Mag, and Mbp
along with the key transcription factors Sox10, Myrf,
and Nkx6-2 (Emery, 2010a, 2010b). In addition, tran-scripts for key factors regulating transcription such as
Gpr37, mothers against decapentaplegic homolog 7 (Smad7), receptor tyrosine-protein kinase erbB-3, sur-vival of motor neuron protein-interacting protein 1 (Sip1/Zeb2; Brinkmann et al., 2008; Weng et al., 2012) along with transcripts for enzymes that play a key role in lipid biogenesis, such as elongation of very long chain
fatty acids protein 7 (Elovl7) and ceramide synthase 2
(Lass2), are decreased with loss of ZFP191. In contrast, very few (14) genes have increased mRNA levels with loss of ZFP191 in both the whole brain and mature
oligodendrocytes; these include inhibitor of
differentiation 3 (Id3), lunatic fringe (Lfng), and apolipo-protein E (Apoe).
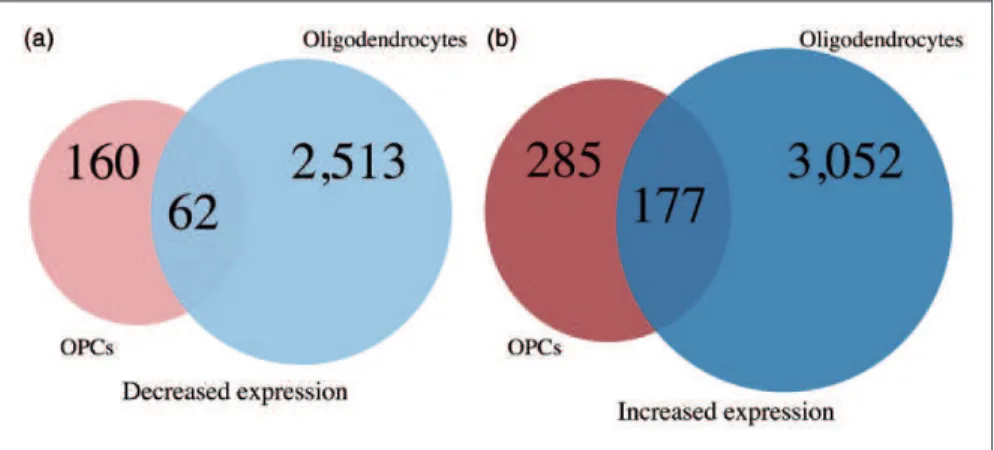
There are 177 transcripts that have increased levels in both OPCs and oligodendrocytes that do not express ZFP191 (Figure 3). Several of these transcripts encode proteins that play a role in the control of oligodendrocyte
development by repressing maturation such as Id2,
Wnt5a/7a, Hdac1, Sox5, and paired-box 7 (Pax7; Liu et al., 2006; Emery, 2010a, 2010b; Fulton et al., 2011; Kuspert and Wegner, 2015). We noted that 1,522 tran-scripts that are normally decreased upon differentiation from the OPC to oligodendrocyte stage (Zhang et al., 2014) are not suppressed in mature oligodendrocytes
that lack ZFP191. These transcripts include Dll1,
Ascl1/Mash1, c-Myc, Notch1, Pdgfra, and Sox2/4/6/9/
21. Many of these factors are known to play a role in
Table 5. Top 10 Transcripts That Have Reduced Expression in
Zfp191nullOligodendrocytes.
Gene Fold change
Zfp191þ/þ
RPKM
A. Genes sorted byZfp191þ/þ
transcript RPKM
Plp1 6.64 8140.00
Tubb4 3.53 3790.00
Cldn11 5.27 3730.00
Mbp 4.82 3560.00
Mag 12.04 2670.00
Cnp 4.07 2380.00
Fth1 2.03 1740.00
Mal 13.77 1180.00
Aplp1 3.01 852.00
Mobp 17.51 841.00
B. Genes sorted by fold change forZfp191þ/þ
Gjb1 381.34 181.00
Ly6a 132.40 19.30
Clmn 102.45 47.10
Vamp5 72.49 18.70
Rab37 64.52 7.69
Esyt3 63.85 7.10
C030030A07Rik 60.74 14.90
Pls1 57.19 54.70
Padi2 56.62 88.90
Pdlim2 46.26 180.00
RNA sequencing was performed on RNA samples isolated fromZfp191null andZfp191þ/þ
oligodendrocytes culturedin vitro(n¼2 for each genotype). Transcripts listed forZfp191þ/þoligodendrocytes in A had a
p<.001 fold
change when comparingZfp191þ/þversusZfp191nulloligodendrocytes and are sorted by RPKM value. Transcripts listed forZfp191þ/þ oligodendro-cytes in B had a RPKM value7, ap<.001 fold change when comparing Zfp191þ/þ versus Zfp191null oligodendrocytes, and are sorted by fold changes.
Table 6. Top 10 Transcripts That Have Increased Expression in
Zfp191nullOligodendrocytes.
Gene Fold change
Zfp191null
RPKM
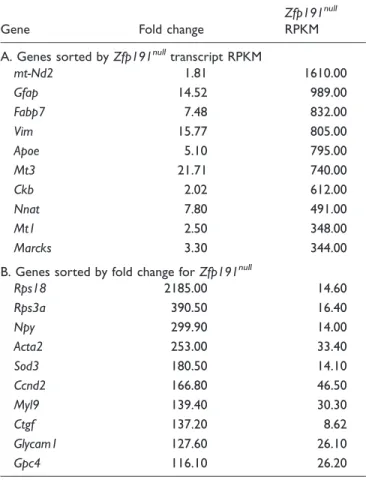
A. Genes sorted byZfp191nulltranscript RPKM
mt-Nd2 1.81 1610.00
Gfap 14.52 989.00
Fabp7 7.48 832.00
Vim 15.77 805.00
Apoe 5.10 795.00
Mt3 21.71 740.00
Ckb 2.02 612.00
Nnat 7.80 491.00
Mt1 2.50 348.00
Marcks 3.30 344.00
B. Genes sorted by fold change forZfp191null
Rps18 2185.00 14.60
Rps3a 390.50 16.40
Npy 299.90 14.00
Acta2 253.00 33.40
Sod3 180.50 14.10
Ccnd2 166.80 46.50
Myl9 139.40 30.30
Ctgf 137.20 8.62
Glycam1 127.60 26.10
Gpc4 116.10 26.20
RNA sequencing was performed on RNA samples isolated fromZfp191null andZfp191þ/þ
oligodendrocytes culturedin vitro(n¼2 for each genotype). Transcripts listed forZfp191nulloligodendrocytes in A had ap<.001 fold
transcriptional regulation. Elevation of these transcript levels may inappropriately maintain the expression of downstream genes that promote OPC identity and pre-vent maturation.
Transcription Factor Expression Is Perturbed With
Loss of
Zfp191
Loss of Zfp191 expression in the brain perturbs the
expression of 25 genes that encode transcription factors as identified by the Animal Transcription Factor
Database (AnimalTFDB) and Riken Transcription
Factor Database (TFdb; (Kanamori et al., 2004; Zhang
et al., 2012). A majority of these transcripts (21) have reduced expression levels inZfp191nullbrain.
In isolated and cultured OPCs, loss ofZfp191
expres-sion perturbs the expresexpres-sion of 58 transcription factor transcripts. In contrast to the whole brain data, the majority of these transcripts have increased expression
(41) with loss of ZFP191. Pax7 has an approximately
24,000 fold increase in ZFP191null OPCs (this high fold
change is due to the absence of detectablePax7mRNA in
Zfp191þ/þcells). In cultured oligodendrocytes, we identi-fied 558 transcripts that encode putative transcription factors that have perturbed expression with the loss of ZFP191. Table 7 lists the 10 transcripts that have the
greatest fold change in Zfp191null oligodendrocytes. Our
data demonstrate that loss of ZFP191 reduces expression ofMyrf, Nkx6-2, andOlig1, all of which play a vital role
in oligodendrocyte differentiation and myelination
(Emery, 2010a, 2010b). As with the OPCs, loss of ZFP191 in oligodendrocytes results in more increases in transcription factor transcripts (333) than decreases.
Similar to what was seen with OPCs,Pax7has the largest
fold change (241-fold) inZfp191nulloligodendrocytes.
The Perturbation of the Transcriptome Is
Primarily Due to Loss of ZFP191 Rather
Than the Absence of Myelin
The lack of ZFP191 results in profound CNS hypomye-lination, which might have a secondary effect on the tran-scriptome. To distinguish transcripts that are affected primarily through the loss of ZFP191 from those that are perturbed due to the loss of myelin, we examined the transcriptome of the well-characterized
hypomyeli-nated shiverer mouse, in which the hypomyelination
is the result of a spontaneous null mutation in the Mbp
Figure 3. A Venn diagram comparing the number of transcripts (A) with decreased expression inZfp191/
OPCs compared with
Zfp191þ/þ
OPCs (light red) andZfp191/
oligodendrocytes compared withZfp191þ/þ
oligodendrocytes (light blue). A Venn diagram comparing transcripts (B) with increased expression inZfp191/
OPCs compared withZfp191þ/þ
OPCs (dark red) andZfp191/
oligodendrocytes compared withZfp191þ/þ
oligodendrocytes (dark blue).Note. OPCs¼oligodendrocyte progenitor cell.
Figure 2. A Venn diagram comparing the number of transcripts
with decreased expression inZfp191/
whole brain compared withZfp191þ/þ
whole brain (red) and transcripts with decreased expression inZfp191/
oligodendrocytes compared with
Zfp191þ/þ
gene (Readhead et al., 1987). We performed RNA
sequencing on P21 shiverer whole-brain RNA samples,
as well as RNA isolated from primary OPCs and
oligo-dendrocytes similar to theZfp191/datasets. The loss of
Mbpin P21 whole brain results in the perturbation of 93
transcripts (Tables S8 and S9). The majority of these
transcripts were expressed at a higher level in shiverer
mutant mice (67 transcripts; Tables 8A and B, 9A and
B). Transcripts that were more abundant in theshiverer
brain include Nkx6-2, Erbb3 and Apoe. Transcripts
that had a lower expression level in the shiverer mouse
brains compared with Mbpþ/þ littermates include Mbp,
UDP galactosyltransferase 8A (Ugt8a), Fa2h, Mal,
gelsolin(Gsn), lanosterol synthase (Lss), squalene epoxi-dase (Sqle), Hmgcr, and Plp1. Examining the
altered transcripts for KEGG pathway analysis
revealed that the loss of MBP in the whole brain per-turbs phosphatidylinositol signaling along with sterol biosynthesis.
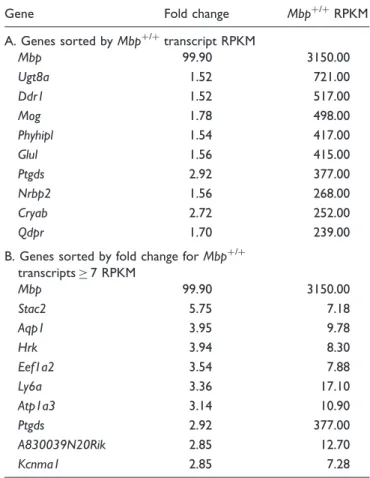
Mbp expression loss in OPCs resulted in the
perturb-ation of 10 transcripts, all of which had low RPKM values and small changes (Tables S10 and S11). This is
expected as Mbp is upregulated upon exit of the OPC
stage. The loss of MBP in mature oligodendrocytes per-turbs 387 transcripts; 311 of those transcripts are expressed at a lower abundance with the absence of MBP (Tables S12 and S13; Table 10A and B along with Table 11A and B).
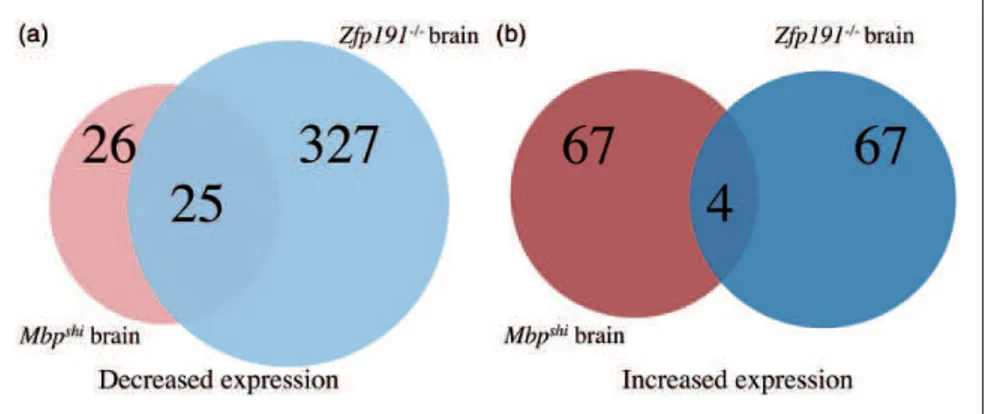
It is striking that approximately 75% of the transcripts
that are reduced with loss of Mbp expression are also
reduced with the loss of Zfp191 expression (Figure 4).
Transcripts that have reduced expression include Mbp,
Mog, Ugt8a, and Fasn, all key transcripts involved in oligodendrocyte development and maturation. When assessing the transcriptional differences detected in total brain RNA, the comparison is even more striking as 25 of the 26 transcripts that have decreased expression with
loss of Mbp expression are also decreased with loss of
Zfp191/
expression (Figure 5(a)). Nevertheless, there are only four transcripts that have increased expression in both mouse models of hypomyelination in the whole brain (Figure 5(b)). It is clear from these analyses that the vast majority of genes that demonstrate altered
expres-sion in the Zfp191 mutants are expressed normally in
Mbpshimice.
Table 8. Top 10 Transcripts That Have Decreased Expression in
ShivererWhole Brains.
Gene Fold change
Mbpþ/þ
RPKM
A. Genes sorted byMbpþ/þ
transcript RPKM
Plp1 1.61 1120.00
Mbp 33.68 506.00
Mal 2.23 178.00
Ugt8a 3.19 122.00
Trf 2.31 69.30
Scd1 1.83 44.00
Apod 2.17 40.30
Gsn 1.81 33.60
Hmgcr 1.61 29.90
Fa2h 2.74 26.40
B. Genes sorted by fold change forMbpþ/þ
transcripts7 RPKM
Mbp 33.68 506.00
Ugt8a 3.19 122.00
Fa2h 2.74 26.40
Trf 2.31 69.30
Mal 2.23 178.00
Apod 2.17 40.30
Anln 2.113 8.02
Sc4mol 2.012 14.1
RNA sequencing was performed onMbpshiandMbpþ/þwhole-brain RNA samples (n¼2 for each genotype). Transcripts listed for Mbpþ/þ whole brains in A had a p<.001 fold change when comparing Mbpþ/þ versus
Mbpshiwhole brains and are sorted by RPKM value. Transcripts listed for Mbpþ/þwhole brains in B had an RPKM value
7, ap<.001 fold change
when comparingMbpþ/þversusMbpshiwhole brains, and are sorted by fold changes.
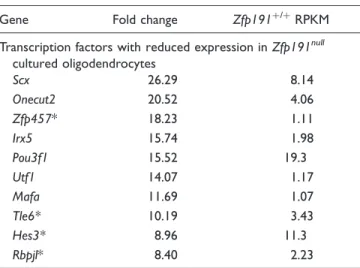
Table 7. Top 10 Transcription Factor Transcripts With Reduced
Expression inZfp191nullCultured Oligodendrocytes.
Gene Fold change Zfp191þ/þ
RPKM
Transcription factors with reduced expression inZfp191null
cultured oligodendrocytes
Scx 26.29 8.14
Onecut2 20.52 4.06
Zfp457* 18.23 1.11
Irx5 15.74 1.98
Pou3f1 15.52 19.3
Utf1 14.07 1.17
Mafa 11.69 1.07
Tle6* 10.19 3.43
Hes3* 8.96 11.3
Rbpjl* 8.40 2.23
RNA sequencing was performed on RNA samples isolated fromZfp191null andZfp191þ/þoligodendrocytes culturedin vitro(n
¼2 for each genotype). Transcription factor transcripts were compiled from AnimalTFDB and TFdb (Kanamori et al., 2004; Zhang et al., 2012). Transcription factor transcripts listed forZfp191þ/þ whole brains had a RPKM value
Disrupted Cholesterol Biosynthesis Is a
Transcriptional Fingerprint of Hypomyelination
The cholesterol biosynthetic pathway is disrupted in both the Zfp191 and Mbp mutants examined here. Table 12 shows that both mouse models have reduced expression of a number of transcripts required for proper cholesterol
biosynthesis, including the rate-limiting enzyme
HMGCR. The disruption of the cholesterol biosynthesis pathway in these two models suggests that this is a tran-scriptional signature of hypomyelination (Figure 6). Interestingly, the expression level of these transcripts
was not perturbed in isolated Zfp191null or shiverer
OPCs or oligodendrocytes. Unlike the oligodendrocytes in the brain, primary cultured oligodendrocytes do not make compact myelin. Therefore, we propose that the observed perturbation in the cholesterol biosynthetic
pathway observed only in the brain and not in the pri-mary cultured cells is secondary to the lack of myelin production.
To confirm that the expression levels of key cholesterol
biosynthetic transcripts are perturbed,
reverse-transcriptase PCR (RT-PCR) was performed (Figure S1).
Discussion
ZFP191 Plays a Key Role in Oligodendrocyte
Development and Myelination
In the current study, we examined the role that the puta-tive transcription factor ZFP191 has on the integrity of the transcriptome using high-throughput sequencing of RNA isolated from total brain, as well as isolated oligo-dendrocyte lineage cells. We first examined how loss of ZFP191 affects the transcriptome of the P21 whole mouse
Table 9. Top 10 Transcripts That Have Increased Expression in
ShivererWhole Brains.
Gene Fold change MbpshiRPKM
A. Genes sorted byMbpshitranscript RPKM
Apoe 1.60 752.00
Ptms 1.62 228.00
Ptgds 1.98 138.00
Csrp1 1.72 87.80
Sirt2 1.84 70.90
S100a1 1.76 55.80
Nfasc 1.71 53.90
Map4k4 1.53 45.60
P4hb 1.52 41.00
Nudc 1.53 38.20
B. Genes sorted by fold change forMbpshi
transcripts7 RPKM
Gsbs 3.39 28.10
Car14 2.77 14.80
Pls1 2.70 7.77
Tmem2 2.15 8.09
Phlda1 2.05 14.10
H2afj 2.04 17.60
Adamts4 2.04 15.00
Rras2 2.02 17.60
Ptgds 1.98 138.00
Hsd17b7 1.98 10.10
RNA sequencing was performed onMbpshiandMbpþ/þ
whole-brain RNA samples (n¼2 for each genotype). Transcripts listed forMbpshiwhole brains in A had ap<0.001 fold change when comparingMbpshiversusMbpþ/þ
whole brains and are sorted by RPKM value. Transcripts listed forMbpshi whole brains in B had an RPKM value 7, ap<.001 fold change when comparing Mbpshi versus Mbpþ/þ whole brains, and are sorted by fold changes.
Table 10. Top 10 Transcripts That Have Reduced Expression in
ShivererOligodendrocytes.
Gene Fold change Mbpþ/þ
RPKM
A. Genes sorted byMbpþ/þ
transcript RPKM
Mbp 99.90 3150.00
Ugt8a 1.52 721.00
Ddr1 1.52 517.00
Mog 1.78 498.00
Phyhipl 1.54 417.00
Glul 1.56 415.00
Ptgds 2.92 377.00
Nrbp2 1.56 268.00
Cryab 2.72 252.00
Qdpr 1.70 239.00
B. Genes sorted by fold change forMbpþ/þ
transcripts7 RPKM
Mbp 99.90 3150.00
Stac2 5.75 7.18
Aqp1 3.95 9.78
Hrk 3.94 8.30
Eef1a2 3.54 7.88
Ly6a 3.36 17.10
Atp1a3 3.14 10.90
Ptgds 2.92 377.00
A830039N20Rik 2.85 12.70
Kcnma1 2.85 7.28
RNA sequencing was performed on RNA isolated fromMbpshiandMbpþ/þ oligodendrocytes cultured in vitro(n¼2 for each genotype). Transcripts listed forMbpþ/þoligodendrocytes in A had a
p<.001 fold change when
comparingMbpþ/þversusMbpshi in oligodendrocytes and are sorted by RPKM value. Transcripts listed forMbpþ/þoligodendrocytes in B had a RPKM value 7, ap<.001 fold change when comparing Mbpþ/þversus
brain. We find that most transcripts that had decreased
expression with loss ofZfp191are associated with
oligo-dendrocyte lineage cells, which is consistent with the hypomyelinating phenotype that these mutant animals display (Howng et al., 2010). Transcripts that have increased expression as a result of loss ofZfp191 expres-sion are associated with gliosis. This gliotic response may
be the result of loss of Zfp191 expression in astrocytes
and microglia, but it could also reflect a secondary response to the impairment of oligodendrocyte function
and myelin production. Loss of Zfp191 expression
per-turbs the transcriptome of in vitro cultured OPCs. This
implies that ZFP191 has a function prior to the
gener-ation of oligodendrocytes. The loss ofZfp191expression
in isolated oligodendrocytes results in a perturbation of
5,500 transcripts. Transcripts, such as Mbp, Mog,
Mobp, andCnp, for proteins involved in the generation
and function of myelin were decreased with loss of
Zfp191 expression. The majority of transcripts (75%)
that had lower expression in the Zfp191/ whole brain
also had lower expression inZfp191/oligodendrocytes
(Figure 2), demonstrating that the perturbation of the whole brain transcriptome is due mainly to the perturb-ation of oligodendrocytes.
Recently, it has been reported that patients hemizy-gous for 18q chromosomal deletions that include the
region that contains the Zfp191 human ortholog
ZNF24 display seizures and tremors, suggestive of myelin abnormalities (Cody et al., 2015). Interestingly, OPCs and oligodendrocytes that are heterozygous for the Zfp191 null mutation display transcriptome alter-ations similar to the homozygous mutant cells, albeit to a lesser extent (data not shown). This raises the possibility that a subset of human disorders with 18q deletions might
be due, at least in part, toZNF24haploinsufficiency.
Zfp191 Plays a Role in the Transcriptional Networks
That Govern Oligodendrocyte Differentiation
Due to the large number of transcripts perturbed from
lack of Zfp191 expression, we examined whether
tran-scription factor networks were disrupted. Indeed, with
loss of Zfp191 expression, several critical transcription
factor transcripts such as Nkx6.2, Sox10, andMyrf had
decreased expression in cultured oligodendrocytes
(Hornig et al., 2013). These transcription factors are man-datory for oligodendrocyte differentiation, as shown in genetic ablation studies (Stolt et al., 2002; Koenning et al., 2012; Mei et al., 2013). These data raise the possi-bility that ZFP191 functions, at least in part, upstream of
many critical oligodendrocyte transcription factors
includingSox10andMyrf.
Table 11. Top 10 Transcripts That Have Increased Expression in
Shiverer Oligodendrocytes.
Gene Fold change MbpshiRPKM
A. Genes sorted byMbpshitranscript RPKM
Cyb5 1.72 153.00
Rap2a 1.76 85.80
Chst2 1.53 84.40
Sema6a 1.59 82.20
Sema6d 1.68 60.40
Mmd2 1.67 54.80
Dusp15 1.58 49.50
Cntn1 1.56 45.70
Mapre2 1.71 39.30
Fam107b 2.17 34.50
B. Genes sorted by fold change forMbpshi
transcripts>7 RPKM
Dct 6.32 16.50
Alox5 2.80 14.60
Fam107b 2.17 34.50
Daam2 1.93 9.02
Tmprss5 1.83 11.20
Capn5 1.80 24.70
Rap2a 1.76 85.80
Ndrg2 1.75 17.80
Kcna2 1.74 20.00
Id4 1.72 8.26
RNA sequencing was performed on RNA samples isolated fromMbpshiand Mbpþ/þ oligodendrocytes cultured in vitro (n
¼2 for each genotype). Transcripts listed forMbpshi oligodendrocytes in A had a p
<.001 fold
change when comparingMbpshi versusMbpþ/þ in oligodendrocytes and are sorted by RPKM value. Transcripts listed forMbpshioligodendrocytes in B had an RPKM value7, ap<.001 fold change when comparingMbpshi
versusMbpþ/þin oligodendrocytes, and are sorted by fold changes.
Figure 4. A Venn diagram comparing transcripts with decreased
expression inMbpshioligodendrocytescompared withMbpþ/þ
oligodendrocytes (red) and transcripts with decreased expression inZfp191/
oligodendrocytes compared with
Zfp191þ/þ
In the absence ofZfp191expression, the transcripts for
transcriptional repressorsId2/4andHes1/5are increased
in Zfp191null oligodendrocytes. Normally, the expression of these genes decreases with differentiation from the OPC to mature oligodendrocyte stage (Dugas et al., 2006; Zhang et al., 2014), and this downregulation has
been shown to be required for the proper
differentiation of OPCs into mature oligodendrocytes (Norton, 2000; Wang et al., 2001; Wu et al., 2003; Liu et al., 2006; Ogata et al., 2011). The continued
expres-sion of these transcripts suggests that Zfp191null
oligodendrocytes have not fully differentiated into cells capable of myelinating axons. ZFP191 may play a direct role in downregulating these transcripts or this may represent a secondary effect associated with the absence of ZFP191.
ZFP191 Plays a Role in Signaling Cascades That
Control Oligodendrocyte Differentiation
The Notch signaling pathway has been shown to
be important for oligodendrocyte differentiation
(Hu et al., 2003; Popko, 2003). We find that the
tran-scripts of the Notch signaling effectors Dll3 and Lfng
along with the downstream target recombination signal binding protein for immunoglobulin kappa J region-like
(Rbpjl)are reduced in OPCs derived from theZfp191null
mice. These data suggest that ZFP191 may play a role in the regulation of the Notch pathway in oligodendrocytes and through its absence may prevent proper maturation and myelin production. Our data show that several
add-itional pathways are perturbed with loss of Zfp191
expression such as the Erbb, MAPK, and Wnt signaling cascades.
The inhibitory effect of the Wnt signaling pathway is critical for oligodendrocyte differentiation (Fancy et al., 2009; Rosenberg and Chan, 2009). We find that the Wnt signaling effectors low-density lipoprotein receptor-related protein 5, frizzled homolog 1, and smoothened
homolog 1 (Lrp5, Fzd1, andSmo1) are increased in the
oligodendrocytes derived from theZfp191nullmice. These
data suggest that ZFP191 may play a role in proper regu-lation of the Wnt pathway in oligodendrocytes.
In addition, loss of Zfp191 affects the expression of
Wnt7a, which is detected at approximately 20-fold higher level in the mutant oligodendrocytes. WNT7A has been shown to affect the developing brain as both Figure 5. A Venn diagram comparing transcripts (A) with decreased expression inMbpshiwhole brain compared withMbpþ/þ
whole brain (red) andZfp191/
whole brain compared withZfp191þ/þ
whole brain (blue). A Venn diagram comparing transcripts (B) with increased expression inMbpshiwhole brain compared withMbpþ/þ
whole brain (red) andZfp191/
whole brain compared with
Zfp191þ/þ
whole brain (blue).
Table 12. Genes Perturbed in Fatty Acid Degradation for
Cholesterol Production.
Zfp191/
brain Shivererbrain
Gene
Fold change
RPKM forZfp191þ/þ
Fold change
RPKM forMbpþ/þ
Lss 2.13 7.50 1.72 6.62
Dhcr7 1.71 9.78 1.60 8.53
Sc5d 1.82 29.50 1.59 19.30
Sqle 1.82 26.50 1.68 24.90
Cyp51 1.99 23.20 1.93 20.90
Sc4mol 2.21 16.80 2.01 14.10
Hmgcr 1.66 28.20 1.60 29.90
Fdft1 1.80 19.00 1.61 14.30
Mvd 1.76 9.34 N.S. 7.47
Nsdhl 1.70 7.97 N.S. 9.17
RNA sequencing was performed onZfp191þ/þ
andZfp191nullwhole-brain RNA samples along with Mbpþ/þand Mbpshi whole-brain RNA samples (n¼2 for each genotype). Transcripts listed had a RPKM value 0.5, a1.5-fold change when comparing Zfp191þ/þ versus Zfp191null and Mbpþ/þversusMbpshiin whole brains, andp
an autocrine and a paracrine signaling molecule (Qu et al., 2013). Functioning as an autocrine signaling mol-ecule, WNT7a maintains OPCs in their progenitor state and prevents differentiation. When functioning as a para-crine signaling molecule, WNT7a promotes endothelial cells to initiate angiogenesis in white matter areas
(Yuen et al., 2014). The perturbed expression of Wnt7a
in the Zfp191null-derived oligodendrocyte lineage cells
may suggest that ablation of Zfp191 may affect other
cell types in the brain in a paracrine fashion mediated by WNT7A. This may explain some of the differences detected between the whole brain transcriptome com-pared with isolated oligodendrocyte lineage cells and may explain, at least in part, the effect of ablation of
Zfp191on non-oligodendrocyte lineage cell-specific tran-scripts in the brain.
Figure 6. Cholesterol biosynthesis pathway transcripts are disrupted in hypomyelinated brains. Yellow boxes denote chemical
com-pounds involved in this pathway. White, blue, or red boxes denote the transcripts involved in this pathway. Red boxes denote transcripts that have reduced expression in theZfp191nullwhole brain. Blue boxes denote transcripts that have reduced expression in both the
The Disruption of the Oligodendrocyte
Transcriptome Primarily Results From the Loss of
ZFP191 Not the Absence of Myelin Production
To examine whether the altered gene expression in the
Zfp191mutant CNS is due to the direct loss of ZFP191 or whether it represents a secondary consequence of the inability to produce myelin, we performed RNA
sequen-cing using theshiverermouse. The loss of MBP results in
75% fewer transcripts being perturbed in the whole brain than in theZfp191nullmouse. We also observed that fewer transcripts associated with transcriptional control were
perturbed with loss of Mbp expression. This seems
rea-sonable as MBP is a structural protein, but it is important to note that expression ofId2/4, Runx1, Atf3, andScxare
altered in both Zfp191null and shiverer oligodendrocytes
suggesting that there may be transcription factors that are affected due to the general loss of proper myelin produc-tion. Interestingly, previous studies have shown that a small portion of MBP is localized to the nucleus of oligo-dendrocytes, which may indicate a possible role for this protein in transcriptional control (Pedraza et al., 1997; Smith et al., 2012; Smith et al., 2013). Nevertheless, a direct regulatory effect of MBP on oligodendrocyte gene expression has not been demonstrated. A majority
of the transcripts that are perturbed with loss of Mbp
expression are also perturbed with loss ofZfp191
expres-sion in oligodendrocytes (Figure 4). This may
demon-strate that ZFP191 plays a key role upstream of MBP,
particularly as many more transcripts are perturbed with loss of ZFP191 than with MBP.
Hypomyelination Causes a Reduction in
Key Transcripts Involved in the Lipid
Biosynthesis Pathway
The absence of myelin in the Zfp191null and shiverer
mouse whole brains results in the reduction of a number of transcripts that encode key proteins in the cholesterol and lipid biosynthetic pathways. The loss of either ZFP191 or MBP results in similar reductions of
Hmgcr, which encodes for the rate-limiting enzyme in cholesterol biosynthesis, and several transcripts that encode for proteins involved in the final steps of this pathway (Figure 6). These data suggest that oligodendro-cytes have a feedback system that allows them to regulate myelin lipid synthesis depending on their myelinating state. The control of cholesterol homeostasis is critical for myelination (Saher et al., 2005; Verheijen et al., 2009), and defects in lipid synthesis have been linked to demyelination (Rolyan et al., 2015). The transcription
factors sterol regulatory element-binding proteins
(SREBPs; encoded by the SREBF1and SREBF2genes)
regulates nine of the genes that encode enzymes required for cholesterol biosynthesis (Sakakura et al., 2001). In
Zfp191null OPCs and oligodendrocytes, SREBF1 and
SREBF2 are expressed more abundantly than in
Zfp191þ/þ cells. Although both of the SREBPs tran-scripts are more abundant, the mRNA levels of their
downstream targets such as Hmgcr, Sqle, and Lss are
not altered inZfp191nullOPCs and oligodendrocytes, sug-gesting a more complex level of regulation. Moreover,
SREBF1 and SREBF2 expression is not perturbed in
the hypomyelinated shiverer mouse, further suggesting
that these transcription factors are not the myelin sensors that regulate lipid biosynthesis. Data from these models of hypomyelination may help identify novel potential sensors in oligodendrocytes for proper cholesterol and lipid biosynthesis. Lipid biosynthesis transcripts are also expressed abundantly in many cells in the CNS, particularly astrocytes, which play a key role in providing lipids and cholesterol for neurons (for review, see Pfrieger and Ungerer, 2011). The decrease of key lipid biosynthesis transcripts in these models of hypomye-lination may be due to a direct effect on oligodendrocytes or it may reflect a secondary effect of oligodendrocyte perturbation on the homeostatic production of choles-terol by the CNS.
Conclusion
ZFP191 is a putative transcription factor that plays a critical role in CNS myelination (Emery, 2010a, 2010b; Howng et al., 2010; Yu et al., 2013; Kuspert and Wegner, 2015). Therefore, a complete understanding of ZFP191 function is critical. Our data suggest that ZFP191 plays a key role in the transcriptional network that controls oligodendrocyte development and myelination. Loss of ZFP191 primarily perturbs the mature oligodendrocyte transcriptome, although OPC transcriptome alterations demonstrate that loss of ZFP191 is acting early in the oligodendrocyte lineage. We also show that ZFP191
acts, at least in part, upstream of Sox10 and Myrfand
may have a critical role in their transcriptional regulation. Many pathways such as MAPK, Notch, Wnt, and Erbb signaling cascades, which are known to play key roles in oligodendrocyte development, are perturbed with the loss of ZFP191. These data suggest that the loss of ZFP191 results in the subsequent decrease in abundance of key transcription factors along with transcripts that play a key role in signal transduction and cholesterol biosynthe-sis. Therefore, ZFP191 is a central transcriptional regu-lator of oligodendrocyte development and myelination.
Summary Statement
Acknowledgments
We would like to thank Robin Avila and Benjamin L. L. Clayton for their thoughtful discussions. We also thank the University of Chicago Functional Genomics Facility for assistance in high-throughput sequencing.
Author Contribution
J. D. A designed research, performed research, analyzed data, and wrote the paper; B. E. designed research, performed research, ana-lyzed data, and wrote the paper; Y. W. performed research and analyzed data; T. J. L. analyzed data; L. Z. analyzed data; B. T. L. analyzed data; B. P designed research, analyzed data, and wrote the paper.
Declaration of Conflicting Interests
The authors declared no potential conflicts of interest with respect to the research, authorship, and/or publication of this article.
Funding
The authors disclosed receipt of the following financial support for the research, authorship, and/or publication of this article: This work was supported from a grant from the National Institutes of Health (R01NS067550) and the National Multiple Sclerosis Society (RG-1501-02797).
Supplemental Material
The online figures and tables are available at http://asn.sagepub. com/supplemental.
References
Anders, S., & Huber, W. (2010). Differential expression analysis for sequence count data.Genome Biology,11, R106.
Bartlett, P. F., Noble, M. D., Pruss, R. M., Raff, M. C., Rattray, S., & Williams, C. A. (1981). Rat neural antigen-2 (RAN-2): A cell surface antigen on astrocytes, ependymal cells, Muller cells and lepto-meninges defined by a monoclonal antibody. Brain Research,204, 339–351.
Bignami, A., Eng, L. F., Dahl, D., & Uyeda, C. T. (1972). Localization of the glial fibrillary acidic protein in astrocytes by immunofluorescence.Brain Research,43, 429–435. Blankenberg, D., Von Kuster, G., Coraor, N., Ananda, G., Lazarus,
R., Mangan, M., . . . Taylor, J. (2010). Galaxy: A web-based
genome analysis tool for experimentalists. Current Protocols in Molecular Biology/edited by Frederick M Ausubel [et al] Chapter 19:Unit 19.10.1-21.
Brinkmann, B. G., Agarwal, A., Sereda, M. W., Garratt, A. N., Muller, T., Wende, H.,. . .Nave, K. A. (2008). Neuregulin-1/ ErbB signaling serves distinct functions in myelination of the peripheral and central nervous system.Neuron,59, 581–595. Bujalka, H., Koenning, M., Jackson, S., Perreau, V. M., Pope, B.,
Hay, C. M.,. . .Emery, B. (2013). MYRF is a membrane-asso-ciated transcription factor that autoproteolytically cleaves to dir-ectly activate myelin genes.PLoS Biology,11, e1001625. Chen, Y., Wu, H., Wang, S., Koito, H., Li, J., Ye, F.,. . .Lu, Q. R.
(2009). The oligodendrocyte-specific G protein-coupled recep-tor GPR17 is a cell-intrinsic timer of myelination. Nature Neuroscience,12, 1398–1406.
Cheng, X., Wang, Y., He, Q., Qiu, M., Whittemore, S. R., & Cao, Q. (2007). Bone morphogenetic protein signaling and olig1/2 interact to regulate the differentiation and maturation of adult oligodendrocyte precursor cells.Stem Cells,25, 3204–3214. Cody, J. D., Sebold, C., Heard, P., Carter, E., Soileau, B.,
Hasi-Zogaj, M.,. . .Hale, D. E. (2015). Consequences of
chrom-some18q deletions. American Journal of Medical Genetics Part C, Seminars in Medical Genetics,169, 265–280.
Dugas, J. C., Tai, Y. C., Speed, T. P., Ngai, J., & Barres, B. A. (2006). Functional genomic analysis of oligodendrocyte differ-entiation.The Journal of Neuroscience: the Official Journal of the Society for Neuroscience,26, 10967–10983.
Edelstein, L. C., & Collins, T. (2005). The SCAN domain family of zinc finger transcription factors.Gene,359, 1–17.
Emery, B. (2010a). Regulation of oligodendrocyte differentiation and myelination.Science,330, 779–782.
Emery, B. (2010b). Transcriptional and post-transcriptional control of CNS myelination. Current Opinion in Neurobiology, 20, 601–607.
Emery, B., Agalliu, D., Cahoy, J. D., Watkins, T. A., Dugas, J. C., Mulinyawe, S. B.,. . .Barres, B. A. (2009). Myelin gene regu-latory factor is a critical transcriptional regulator required for CNS myelination.Cell,138, 172–185.
Emery, B., & Dugas, J. C. (2013). Purification of oligodendrocyte lineage cells from mouse cortices by immunopanning. Cold Spring Harbor Protocols,2013, 854–868.
Fancy, S. P., Baranzini, S. E., Zhao, C., Yuk, D. I., Irvine, K. A., Kaing, S.,. . .Rowitch, D. H. (2009). Dysregulation of the Wnt
pathway inhibits timely myelination and remyelination in the mammalian CNS.Genes & Development,23, 1571–1585. Feigenson, K., Reid, M., See, J., Crenshaw, I. E., & Grinspan, J. B.
(2011). Canonical Wnt signalling requires the BMP pathway to inhibit oligodendrocyte maturation.ASN Neuro,3, e00061. Friedman, B. A., & Maniatis, T. (2011). ExpressionPlot: A
web-based framework for analysis of RNA-Seq and microarray gene expression data.Genome Biology,12, R69.
Fulton, D. L., Denarier, E., Friedman, H. C., Wasserman, W. W., & Peterson, A. C. (2011). Towards resolving the transcription factor network controlling myelin gene expression. Nucleic Acids Research,39, 7974–7991.
Giardine, B., Riemer, C., Hardison, R. C., Burhans, R., Elnitski, L., Shah, P.,. . .Nekrutenko, A. (2005). Galaxy: A platform for
interactive large-scale genome analysis.Genome Research,15, 1451–1455.
Goecks, J., Nekrutenko, A., Taylor, J., & Galaxy, T. (2010). Galaxy: a comprehensive approach for supporting accessible, reproducible, and transparent computational research in the life sciences.Genome Biology,11, R86.
Grandbarbe, L., Bouissac, J., Rand, M., Hrabe de Angelis, M., Artavanis-Tsakonas, S., & Mohier, E. (2003). Delta-Notch sig-naling controls the generation of neurons/glia from neural stem cells in a stepwise process.Development,130, 1391–1402. Grinspan, J. B., Edell, E., Carpio, D. F., Beesley, J. S., Lavy, L.,
Pleasure, D.,. . .Golden, J. A. (2000). Stage-specific effects of bone morphogenetic proteins on the oligodendrocyte lineage.
Journal of Neurobiology,43(1): 1–17.
7-like 2 positively regulates oligodendrocyte differentiation in a manner independent of Wnt/beta-catenin signaling.The Journal of Neuroscience: the Official Journal of the Society for Neuroscience,35, 5007–5022.
Hornig, J., Frob, F., Vogl, M. R., Hermans-Borgmeyer, I., Tamm, E. R., & Wegner, M. (2013). The transcription factors Sox10 and Myrf define an essential regulatory network module in dif-ferentiating oligodendrocytes.PLoS Genetics,9, e1003907. Howng, S. Y., Avila, R. L., Emery, B., Traka, M., Lin, W.,
Watkins, T.,. . .Popko, B. (2010). ZFP191 is required by
oligo-dendrocytes for CNS myelination.Genes & Development, 24, 301–311.
Hu, Q. D., Ang, B. T., Karsak, M., Hu, W. P., Cui, X. Y., Duka, T.,. . .Xiao, Z. C. (2003). F3/contactin acts as a functional
ligand for Notch during oligodendrocyte maturation. Cell,
115, 163–175.
Huang da, W., Sherman, B. T., & Lempicki, R. A. (2009a). Systematic and integrative analysis of large gene lists using DAVID bioinformatics resources.Nature Protocols,4, 44–57. Huang da, W., Sherman, B. T., & Lempicki, R. A. (2009b).
Bioinformatics enrichment tools: Paths toward the comprehen-sive functional analysis of large gene lists. Nucleic Acids Research,37(1): 1–13.
Kanamori, M., Konno, H., Osato, N., Kawai, J., Hayashizaki, Y., & Suzuki, H. (2004). A genome-wide and nonredundant mouse transcription factor database. Biochemical and Biophysical Research Communications,322, 787–793.
Kanehisa, M., & Goto, S. (2000). KEGG: Kyoto encyclopedia of genes and genomes.Nucleic Acids Research,28, 27–30. Kanehisa, M., Goto, S., Sato, Y., Kawashima, M., Furumichi, M.,
& Tanabe, M. (2014). Data, information, knowledge and prin-ciple: Back to metabolism in KEGG.Nucleic Acids Research,
42, D199–D205.
Koenning, M., Jackson, S., Hay, C. M., Faux, C., Kilpatrick, T. J., Willingham, M.,. . .Emery, B. (2012). Myelin gene regulatory factor is required for maintenance of myelin and mature oligo-dendrocyte identity in the adult CNS. The Journal of Neuroscience: the Official Journal of the Society for Neuroscience,32, 12528–12542.
Kuspert, M., & Wegner, M. (2015). SomethiNG 2 talk about-Transcriptional regulation in embryonic and adult oligodendro-cyte precursors.Brain Research,1638, 167–182.
Langmead, B., Trapnell, C., Pop, M., & Salzberg, S. L. (2009). Ultrafast and memory-efficient alignment of short DNA sequences to the human genome.Genome Biology,10, R25. Li, H., Lu, Y., Smith, H. K., & Richardson, W. D. (2007). Olig1
and Sox10 interact synergistically to drive myelin basic protein transcription in oligodendrocytes.The Journal of Neuroscience: the Official Journal of the Society for Neuroscience, 27, 14375–14382.
Liu, A., Li, J., Marin-Husstege, M., Kageyama, R., Fan, Y., Gelinas, C.,. . .Casaccia-Bonnefil, P. (2006). A molecular
insight of Hes5-dependent inhibition of myelin gene expression: Old partners and new players. The EMBO Journal, 25, 4833–4842.
Matthieu, J. M., & Amiguet, P. (1990). Myelin/oligodendrocyte glycoprotein expression during development in normal and myelin-deficient mice. Developmental Neuroscience, 12, 293–302.
Mei, F., Wang, H., Liu, S., Niu, J., Wang, L., He, Y.,. . .Xiao, L. (2013). Stage-specific deletion of Olig2 conveys opposing func-tions on differentiation and maturation of oligodendrocytes.The Journal of Neuroscience: the Official Journal of the Society for Neuroscience,33, 8454–8462.
Menn, B., Garcia-Verdugo, J. M., Yaschine, C., Gonzalez-Perez, O., Rowitch, D., & Alvarez-Buylla, A. (2006). Origin of oligo-dendrocytes in the subventricular zone of the adult brain.The Journal of Neuroscience: the Official Journal of the Society for Neuroscience,26, 7907–7918.
Miller, R. H., Dinsio, K., Wang, R., Geertman, R., Maier, C. E., & Hall, A. K. (2004). Patterning of spinal cord oligodendrocyte development by dorsally derived BMP4. Journal of Neuroscience Research,76, 9–19.
Nakatani, H., Martin, E., Hassani, H., Clavairoly, A., Maire, C. L., Viadieu, A.,. . .Parras, C. (2013). Ascl1/Mash1 promotes brain oligodendrogenesis during myelination and remyelination.The Journal of Neuroscience: the Official Journal of the Society for Neuroscience,33, 9752–9768.
Norton, J. D. (2000). ID helix-loop-helix proteins in cell growth, differentiation and tumorigenesis. Journal of Cell Science,
113(Pt 22): 3897–3905.
Ogata, T., Ueno, T., Hoshikawa, S., Ito, J., Okazaki, R., Hayakawa, K.,. . .Akai, M. (2011). Hes1 functions downstream of growth
factors to maintain oligodendrocyte lineage cells in the early progenitor stage.Neuroscience,176, 132–141.
Pedraza, L., Fidler, L., Staugaitis, S. M., & Colman, D. R. (1997). The active transport of myelin basic protein into the nucleus suggests a regulatory role in myelination.Neuron,18, 579–589. Pfaffl, M. W. (2001). A new mathematical model for relative quan-tification in real-time RT-PCR.Nucleic Acids Research,29, e45. Pfrieger, F. W., & Ungerer, N. (2011). Cholesterol metabolism in neurons and astrocytes.Progress in Lipid Research,50, 357–371. Popko, B. (2003). Notch signaling: A rheostat regulating
oligo-dendrocyte differentiation?Developmental Cell,5, 668–669. Qu, Q., Sun, G., Murai, K., Ye, P., Li, W., Asuelime, G.,. . .Shi, Y.
(2013). Wnt7a regulates multiple steps of neurogenesis.
Molecular and Cellular Biology,33, 2551–2559.
Readhead, C., Popko, B., Takahashi, N., Shine, H. D., Saavedra, R. A., Sidman, R. L.,. . .Hood, L. (1987). Expression of a myelin
basic protein gene in transgenic shiverer mice: correction of the dysmyelinating phenotype.Cell,48, 703–712.
Richardson, W. D., Kessaris, N., & Pringle, N. (2006). Oligodendrocyte wars.Nature Reviews. Neuroscience,7, 11–18. Roach, A., Takahashi, N., Pravtcheva, D., Ruddle, F., & Hood, L. (1985). Chromosomal mapping of mouse myelin basic protein gene and structure and transcription of the partially deleted gene in shiverer mutant mice.Cell,42, 149–155.
Rolyan, H., Tyurina, Y. Y., Hernandez, M., Amoscato, A. A., Sparvero, L. J., Nmezi, B. C.,. . .Padiath, Q. S. (2015).
Defects of lipid synthesis are linked to the age-dependent demyelination caused by lamin b1 overexpression. The Journal of Neuroscience: the Official Journal of the Society for Neuroscience,35, 12002–12017.
Rosenberg, S. S., & Chan, J. R. (2009). Modulating myelination: knowing when to say Wnt. Genes & Development, 23, 1487–1493.