•
..
" "
セfundaᅦᅢo@
"" GETUUO VARGAS
EPGE
Escola de Pós-Graduaçao em Economia
"Malthus to Solow"
Prof.
Gary
D. Hansen
(VeLA)
LOCAL
Fundação Getulio Vargas
Praia de Botafogo, 190 - 100 andar - Auditório
DATA
10/06199
(58 feira)HORÁRIO
16:00h
s [ \
11 :-; .\ R lOS
DL P L S
C)L I S.\
I': C O :-; O \ I I C .\
•
NBER WORKING PAPER SERIES
MALTHUS TO SOLOW
Gary D. Hansen Ed ward C. Prescott
Working Paper 6858
http://www.nber.orglpapers/w6858
NA TIONAL BUREAU OF ECONOMIC RESEARCH 1050 Massachusetts A venue
Cambridge, MA 02138 December 1998
We acknowledge the excellent research assistance provided by Antoine Martin and Daria Zakharova. We are also grateful to Gregory Clark for useful comments and providing us with some of the data used in section 2, and to Tim Kehoe for helpful discussions on the existence of an equilibrium in our model. The views expressed here are those ofthe author and do not reflect those ofthe National Bureau ofEconomic Research.
I
..
Malthus to Solow
Gary D. Hansen and Edward C. Prescott NBER Working Paper No. 6858
December 1998
JEL No.
01,04
ABSTRACT
A unified growth theory is developed that accounts for the roughly constant living standards
displayed by world economies prior to 1800 as well as the growing living standards exhibited by modem industrial economies. Our theory also explains the industrial revolution, which is the
transition from an era when per capita incomes are stagnant to one with sustained growth. This
transition is inevitable given positive rates oftotal factor productivity growth. We use a standard
growth mode1 with one good and two available techno10gies. The first, denoted the "Malthus" technology, requires 1and, labor and reproducible capital as inputs. The second, denoted the "Solow"
technology, does not require land. We show that in the earIy stages of development, only the
Malthus technology is used and, due to population growth, living standards are stagnant despite
technological progresso Eventually, technological progress causes the Solow technology to become profitable and both technologies are employed. At this point, living standards improve since
population growth has less influence on per capita income growth. In the limit, the economy behaves like a standard Solow growth mode!.
Gary D. Hansen
UCLA, Department of Economics 2263 Bunche Hall
Box 951477
Los Angeles, CA 90095-1477 [email protected]
Edward C. Prescott Research Department
Federal Reserve Bank of Minn. 90 Hennepin Ave.
Minneapolis, MN 55480-0291 andNBER
1. Introduction
This paper provides a unified theory that can account for the secular properties, or
"growth facts," of economic time series as observed in most, if not all, \\lorld economies prior to
1800 as well as the properties of time series observed in modem industrialized economies. Prior
to 1800, li ving standards were roughly constant; per capita wage income, output and
consumption did not grow. Modem industrial economies, on the other hand, enjoy seemingly
endless growth in living standards. In addition, the theory provided in this paper explains the
industrial revolution, which is the transition from an era when per capita incomes are stagnant to
one with sustained growth. In our model, given that we have abstracted from institutions that
may inhibit technology adoption, this transition is inevitable given positive rates of total factor
productivity growth. In particular, at the time of the transition, there is no change in the structure
of the economy (parameters describing preferences, technology and policy) and the equilibrium
implied by our theory is unique.
The mode) we construct combines features of a modem Solow growth mode! with one
that is Malthusian in spirit. The latter is a model that can account for the growth facts of a pre
1800 economy while the former describes properties of modem industrial economies. This is
done by introducing two technologies into a standard general equilibrium growth model (the
model of Diamond (1965». The same good is produced by both technologies and total factor
productivity grows exogenously in both sectors. One of these, denoted the Malthus technology,
is a constant returns to sca!e production process with land, labor and reproducible capital as
inputs. Here, we are effectively modeling production as taking place on family farms and
workshops. An important feature is that land, unlike capital, is a fixed factor that cannot be
produced and does not depreciate. The second, denoted the Solow technology, is similar to the
first except that only labor and capital are used. Production in this sector can be interpreted as
being carried out in factories where entry or exit occurs depending on the profitability of
.'
..
We show that along the equilibrium growth path, only the Malthus technology is used in
the early stages of development when the stock of useable knowledge is small. During these
periods, assuming that population grows ar rhe same rate as output, the living standard is
constant. Eventually, as useable knowledge grows, the Solow technology begins to be used.
That is, a portion of the available labor and capital are employed in this sector. At this point,
living standards begin to improve and population growth has less influence on the growth rate of
per capita income. In the limit, the economy behaves Iike a standard Solow growth model,
which dísplays many of the same secular properties as modem industrial economies.
The inevitable transition from a land based agrarian economy to a modem industrial
economy requires, in our model, that the rate of total factor producti vity growth in the Solow
sector be positive in periods prior to the adoption of this technology. That is, the Solow
technology must improve sufficiently over time so that it ultimately becomes profitable to shift
resources into this previously unused sector. Consistem wÍth this idea, Mokyr (1990), who
documents technological progress over the past 25 centuries, notes that "much growth is derived
from the deployment of previously available information rather than the generation of altogether
new knowledge."l The fact that living standards began to grow following the adoption of the
Solow technology has nothing to do, however, with the rate of technological progress in the
Solow sector relative to that in the Malthus sector. The existence of growing living standards
depends only on shifting away from the land intensive Malthus technology to one that is capital
intensive. The rale of increase in living standards does depend on the rate of technological
progress in the Solow sector.
The issue addressed in this paper is related to that motivating Lucas (1998), but our
approach differs sharply from his. Lucas is concerned with explaining differences in popularion
1 Mokyr (1990), page 6. Of course, some technological advancements, the wheelbarrow for example. increased
total factor productivity in both sectors. The invention was employed in the agrarian sector long before the
•
dynamics that differentiate the pre-industrial revolution era from the modem era, and, as a result,
endogenous fertility and human capital accumulation play central roles in his analysis. In
particular, he constructs a model economy that, oepending on the value of a certain parameter
goveming the private retum to human capital accumulation, can exhibit either Malthusian or
modem features. The approach taken by Lucas is related lO that of Becker, :Murphy and Tamura
(1990), who also emphasize the importance of fertility and human capital investment choices. In
their interpretation, the Mathusian and modem eras are different steady states of the same mode!.
In both of these papers, the transition from an economy with stable living standards to one with
growing living standards requires a change in the retum to human capital accumulation. The
transition from Malthus to Solow is not an equilibrium property of these models as it is in our
theory.2
Laitner (1998) employs an approach similar to ours in order to explain why savings rates
tend to increase as an economy develops. Like us, he studies an economy that can display
equilibria in which a land intensive production process is used exclusively in the early stages of
development and, as technology improves, a capital intensive technology is eventually employed
as well. However, the transition to the capital intensive technology in Laitner's model
requires
that living standards grow prior to the transition. Hence, his early stage is not consistent with a
Malthusian equilibrium as we define it.
The rest of this paper is organized as follows. In the next sectíon we discuss some
empírical facts conceming pre-industrial and post industrial economies. These facts are used
later to test our theory. In section 3, the model economy is presented and an equilibrium is
defined and characterized. The methods we use to compute an equilibrium path are described in
section 4. We simulate the transition from Malthus to Solow in section 4, and compare our
results with the facts discussed in section 2. Finally, some concluding comments are provided in
section 5.
2 Recent work by Galor and Weil (1998) and Tamura (1998) models the transition from a Malthusian to an
•
2. The 8ehavior of the English Economy from 1250-2000
The Period 1264-1800
The Malthusian model deseribes well the behavior of the English economy from 1250 to
nearly 1800. In this period the real wages, and more generalIy the standard of living, displays
little or no trend. Inereases in the stock of useable knowledge that inereased production
possibiIities gave rise to population growth, not to inereases in standards of living. During this
period there was a large exogenous shoek that redueed the population signifieantly beIow trend
for an extended period of time. The shoek was the Blaek Death. For the extended period that
population was below trend, the real wage was signifieant1y above its normal value. This
observation is just what Malthusian theory prediets. We now review evidenee supporting these
statements.
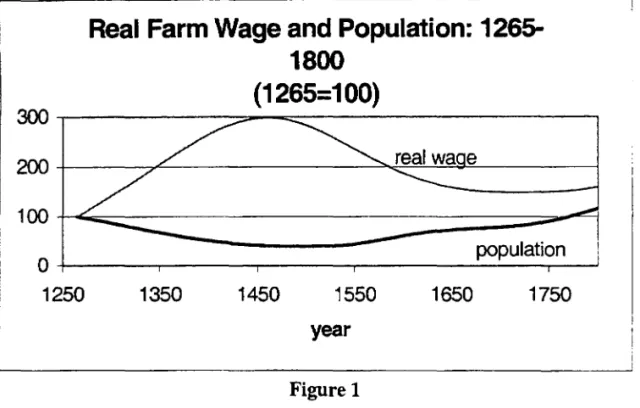
Figure 1 pIots the real farm wage for the period 1265-1800.3 This figure shows very little
trend in the real wage over this período The Phelps-Brown and Hopkins (1956) priee index we
use to deflate money wages is far from ideal. The weights used are 80 pereent for food, 7.5
pereent for lighting and heating and 12.5 pereent for textiles. During the period these categories
of spending eonstituted most expenditures of the typieal eraftsman or laborer. There may have
been an additional modest rise in the real wage over this period due to a falI in the priee of goods
not in the market basket of eonsumables used by Phelps-Brown and Hopkins (1956) and to
increase in quality of goods. However, a modest inerease over a 535-year period is an
infinitesimal growth rate .
3 The English population series is from Clark (1 998a) for 1265-1535 and from Wrigley et ai. (1997) for 1545·1800.
"
..
イMMMMMMMMMMMMMMMMMMMMMMMMMMMMMMMMMMMMMMMMMMMMMMMMMMMMMMMセ@
Real Farm Wage and Population:
1265-1800
(1265=100)
セNMMMMMMMMMMMセMMセセMMMMMMMMMMMMMMMMMMMMN@
RPPKMMMMMMWセMMMMMMMMMMMMMMセセセセセMMMMMMMMセ@
QPPセセセセMMMMMMMMMMセ]]]]セセセ@
population
o
KMMMMMMMLMMMMMMLMMMMMMMLMMMMMMMMMMMMMMMLMセ@1250
1350
1450
1550
year
Figure 1
1650
1750This picture also shows dramatic opposite movements in the real wage and population.
There is a dip in population that bottoms out around 1500 that is accompanied by an increase in
the real wage. Once population begins to recover, the real wage falls. This observation is in
conformity with the Malthusian theory that a drop in the population due to factors such as plague
will result in a high labor marginal product, and therefore real wage, until the population
recovers.
Another prediction of Malthusian theory is that land rents rise and fali with population.
Figure 2 plots realland rents and population for England over the same 1265-1800 period in
Figure 1.4 The observations are in striking conforrnity with the theory. When population was
falling in the first half of the sample, land rents fel!. When population increased, land rents
increased.
4 The English population series and the price index used to construct the realland rent series are the same as in
Figure 1. The nominal land rent series is from Clark (1998a). As in Figure I, the data has been normalized to be
,
Real Land Rent and Population: 1265-1800 (1265=100)
I
250
200
150
100
50
population
o
1250 1350 1450 1550 1650 1750
year
Figure 2
The period 1800-1989
Subsequent to 1800, the Solow mode} deseribes well the behavior of the Engllsh
economy. Labor produetivity, whieh moves closely with the real wage, grew at a steady rate.
Population increases did not lead to falling standard of livings as the Malthusian theory predicts.
This is doeumented in Table 1, whieh reports British labor productivity and population for
selected years. The striking observation is that labor produetivity inereased by a factor of 22
between 1780 and 1989. This number may underestimate the increase in real wage beeause
labor share of product probably increased a liule over the period. More important reasons why
the increase in real wage may be larger than this number are the difficulties in ineorporating
improvements in quality and the introduction of new products in any cost of living indexo
Nordhaus (1997) has a dramatic example of this. Using lumens as a measure of lighting,
Nordhaus finds that the priee of lighting fell a thousand times more than conventionallighting
• priee indexes findo Lighting in the nineteenth century was an important eomponent of household
consumption expenditures being almost 10 percent total expenditures. Nordhaus also finds that
,
Table 1
UK Productivity LeveIs
Year GDPlHouf5
(1985 $ U.S.)
1700 0.827
1780 0.84
1820 1.21
1870 2.15
1890 2.86
1913 3.63
1929 4.58
1938 4.97
1960 8.15
1989 18.55
5 Source of GDPlHour: Maddison (1991 pp. 276 and 274-275).
6 Maddison (1991, pp. 230-239 and p. 227).
PopuIation6 (Million)
8.4 11.1 21.2 31.4 37.5 45.6 45.7 47.5 52.4 57.2
7 We added 5 percent to numbers with ali of lreland for years 1700, 1780 and 1820 to adjust for the fact that ali of
•
The U. S. Economy 1870-1990
Another fact is that the value of fannland relative to the value of GDP has declined
dramatically since 1870, the first year the needed census data are available, and the decline
continues. Table 2 reports this ratio .
Table 2
U.S. Farm Land Value Relative to GDp8
Year Percent
1870 88
1900 78
1929 37
1950 20
1990 9
The decline since 1929 would have been greater if large agriculture subsidies had not been
instituted. The appropriate number from the point of view of our theory, where value is the
present value of marginal products, is probably less than 5 percent in 1990. The decline in
farrnland value relative to annual GNP from 88 percent in 1870 to less than 5 percent in 1990 is a
large decline.
3. Mode1 Economy
Technology
The mode] economy studied is a one good two-sector version ofDiamond's (1965)
overlapping generations model. In the first production sector, which we denote the "Malthus"
.. sector, capital, labor and land are combined to produce output. In the second sector, which we
•
8 Sources: U.S. Department of Commerce , Bureau of the Census, 1975, Historical Statistics ofthe UIlited States
Colonial Times to 1970, Pan I pp. 224,255, and 462. Farrnland values for 1990 was provided by Ken Erickson
•
will refer to as the "Solow" sector, just capital and labor are used to produce the same good. The
production functions for the two sectors are as follows:
Y - I kセ@ N# L1-'-#
.'.fI -
r
M MI MI MI (1)Y. I K(J NI -e
SI =
r
S SI SI (2)Here, the subscript M denotes the Malthus and S denotes Solow. The variables セL@ KJ, Nj , and
LJ
U
= M, S) refers to output produced, capital, labor and land employed in sector j,respectively. The parameters Y M and
r
S are the total factor productivity growth factors in eachsector and are each greater than 1.9
Implicit behind these aggregate production functions are technologies for individual
production units with the property that, given factor prices, the optimal unit size is small relative
to the size of the economy and both entry and exit are permitted. The Malthus production unit
can be thought of as a family farm. The Solow production unit, on the other hand, corresponds
to a factory. Hence, land is an important factor of production in the Malthus production proces5
and reproducible capital has relatively little importance. The Solow technology i5 one in which
the roles of these two inputs are reversed. Consistent with this interpretation, we assume that
e>
<p. In fact, in our formulation of the Solow technology, land, at least when interpreted as afixed factor, does not affect production at alI.
Output from either sector can be used for consumption or investment in capital. Capital
is assumed to depreciate ful1y at the end of each period.10 Hence, the resource constraint for the
economy is given by,
(3)
9 In order to keep the model simple, we have assumed a constant rate of total facto r productivity grnwth in each sector. This assumption is not crucial to our argument. We do require a positive rate ofTFP growth in the Solow sector, but it need not be constant. For example, TFP in this sector may grow at a relatively slow rate prior to being adopted and, due to learning by doing, may grow at a faster rate following the transition to an industrial economy.
10 In the calibration exercises carried out in this paper, we interpret a period to be 35 years. Hence, the assumption
•
•
Land in this economy is in fixed supply; it cannot be produced and does not depreciate.
We normalize the total quantity of land to be 1. In addition, Iand has no altemative use aside
from being used for production in the Malthus sector.
Since the production functions exhibit constant retums to scale, we assume for analytical
convenience that there is just one competitive firm operating in each sector. Given a wage rate
(w), a rentaI rate for capital (rK ), and a rental rate for land (rL ), the firm in sector j solves the
following problem:
(4)
subject to the production functions (1) and (2).
Preferences and Demographic Structure
HousehoIds live for two periods and have preferences that depend on consumption in
each period of life. In particular, a young individual bom in period t has preferences summarized
by the following utility function:
(5)
Here, cII is consumption of a young household in period t and c21 is consumption of an oId
household bom in period t-l.
The number of households bom in period t is denoted by Nr' where
(6)
Following Malthus (1798), we assume that the population growth rate depends on the standard of
Iiving, which we measure using consumption of a young househoId. The precise form of this
functional relationship wiJ1 be described in section 5.11
: I A simple way to moti vate a law of motion of this form is to allow young agents to choose how many children
they have. Let li,., be the number of children chosen by a young household in period r and suppose that the utility function of a household is given by U Cc" .n,.,) + {3V(c2,.,) • where U is increasing and concave in both arguments.
•
•
The initial old (period to) in this economy are endowed with Kt
o / N to - l units capital and
L
=
1/ Nto-l units of land. They rent the land and capital to finns and, at the end of the period,they sell the land to the young households. Each young agent is endowed with one unit of time
that can be supplied as labor to the firmo The labor income eamed by the young is used to
finance consumption and the purchase of capital and land, the return from which wil! finance
consumption when old. That is, the young households maximize (5) subject to the following
budget constraints:
Clt +kt+1 +qtlt+l
=
WtC2t +1
=
rKt+lkt+l+
(rLt+1+
q/+l )1t+1(7)
The notalion employed here is to use lower case letters, k and 1, to denote the capital and land
owned by a particular household and upper case letter, K and L (L
=
1), to denote the total stockof capital and land available in the economy. The letter q denotes the price of land.
Competitive Equilibrium
Given N to ' k/c and Ito (where Nto-IIro = 1), a competitive equilibrium in this economy
consists of a sequences for t セ@ to of prices, {qt' W, ,rKr ,rLt }; firm allocations,
{ K Mr , KSt' N Mr , N St '
Y
M" Yst }; and household allocations, {Clt' c 2t+1' kr+1 ,11+1 } such that: 1. Given lhe sequence of prices, the firm al!ocation solves the problems specified inequation (4).
2. Given the sequence of prices, the household allocation maximizes (5) subject to (7). 3. Markets clear: KM'
+
KSt=
Nt-IktNM,+Ns,=N,
N,_Ilt
=
1YM/
+
Ys /=
Ntclt+
N t_IC2t+
Ntkt+1In characterizing an equilibrium, we make use of the following results:
that N"t == N,n,+, = g(c" )N,. We have found it convenient to model g as an exogenous function since we plan to
•
•
Proposition 1. For any wage rate w and capital rental rate rK , ir is profitable 10 operare the
Malthus secror. That is, YM , > O for ali t.
Proo!" Given wand rK , solving problem (4) for the Malthus sector, maximum profits are equal
to,
which is c1early positive for alI t.
A similar argument applied to the Solow sector gives the following result:
Proposition
2.
Given a wage rale w and capital rental rate rK , maximized profil per unit outpurin the Solow secror is positive
if
and onlyif,
Ir follows rhat, given K, N and t, both sectors are operated in equilibrium (YM and Ys will be positive)
if
and onlyif
(8) is satisfied when wand rK are se! equal to theirequilibrium values in an economy with only a Malthus technology.
Given an aggregate quantity of capital and labor equal to K and N, Proposition 2 is
applied by first computing the Malthus-only wage and rental rate. These are,
w
=
/Ir'
K' NiJ.-1I r'" , t
(8)
(9)
If equation (8) is KOT satisfied, these are also the equilibrium wage and rental rates for the
two-sector economy. If equation (8) is satisfied, both two-sectors are operated and these are not the
•
•
By the First Welfare Theorem, an equilibrium allocation has lhe property that resources
are efficiently allocated across the two sectors. Hence, when both sectors are operated the
following problem is solved: 12
(lO)
The constraint set is compact given that the choice variables Ks and N s are constrained to
closed intervals. This, and lhe fact lhe objective function is continuous, insures the existence of
an optimum. The convexity of the constraint set and strict concavity of the objective insures
uniqueness of the solution. In this case, the equilibrium wage and rental rates for the two-sector
economy become,
(11)
Given values for K, N and t, the above equations determine total output, the equiJibrium
wage rate and factor rental rates, and the allocation of resources across the two sectors,
We now consider the household's optimization problem, which is to maximize (5)
subject to (7). The first order necessary conditions for 11+1 and kl+1 can be arranged to yield the
following expressions:
w
C =_1_
ls 1
+
f3
In addition, the budget constraints and market clearing conditions imply,
12 Of course factor aIlocations must solve this max.imization problem whether or not both sectors are operated. However. if equation (8) is not satisfied. the optimal Ks and Ns are equal to O.
(12)
•
(14)
Given values for t, Kr' Nr' and qr' equations (11), (12), (6), and (14) are used to
obtain Wr ,
r
Kr ,r
Ll Clr Nr+1 and Kr+l. Next, given these results, (11) and (13) are used to obtainqr+l. Given values for to' K,o' Nro ' and qro' this procedure can, in principIe, be used to obtain a
sequence of endogenous variables of any length. The first three of these initial conditions can be
chosen arbitrarily, although specific criteria, which we describe in the next subsection, were
employed in choosing values for these. The value of q,o is not arbitrary, however, and must be
chosen so that the resulting sequence, {qr}- ,results in a sequence of feasible allocations. We
Qセャ」@
discuss the numerical procedure employed in computing an equilibrium path in section 4.
Malthus-Only Economy
Values for to and Kro (No is arbitrarily set equal to 1) are chosen, following actual
historical experience, so that the artificial economy is initially using only the Malthus
technology. In particular, Kro is set equal to the stock of capital at time to along the asymptotic
growth path of a one-sector economy with only a Malthus technology. This growth path is
constructed so that inruvidual consumption (clr and c2r ) is constant in the face of productivity
growth (y M > O). This requires that the growth rate of population be equal to y tl-i'-Ó). In
addition, aggregate output, capital, consumption, the price of land, and the rental rate of land also
grow at this rate. The wage rate and capital rental rate are constant.
In
this case, productivityincreases translate rurectly into population increases and there is no improvement in individual
living standards. This mimics the long run growth path (abstracting from plagues and other
disturbances) that actual economies experienced for centuries prior to the industrial revolution.
Let CIM be the value of CI, along this Malthus-only asymptotic growth path. For lhe
two-sector economy, we choose the function g(clr ) in equation (6) so that g(CIM) = ケセャMゥGMoIN@ Since the wage and remal rate are constam along a Malthus on)y balanced growth path, the Solow
the function g(c,) in equation (6). Over time, as the economy develops, the fraction of labor and
capital assigned to the Malthus sector, along with the price of land, will asymptoticalIy approach
zero. At this point, the economy will behave essentially like a Solow-only economy. That is, the
economy will converge to a growth path along which c,{, c2{, K{ / N{ ,
1'; /
N{ and w, alI grow atthe rate
y
セHiMエQI@ -1 and rKt is constant. Unlike the Malthus growth path, living standards continue to improve along this asymptotic path.We summarize this discussion with the following proposition:
Proposition 3. Given that g( c, M)
=
Y セGMjャMYQI@ , tllere exists some date 1 such llzat equatioll (8) is satisfied and lhe Solow technology is employed.Hence, lhe transition from Malthus to Solow is inevitable.
4. Computational Issues
The set of equations discussed above are sufficient for determining the sequence of
endogenous variables given initial values for the state variables N and K, as well as a value for
the price, qto' In this section, we describe how we obtain q{o' as well as an entire sequence
{q{
r:t
o that satisfies the definition of an equilibrium price sequence. This requires, in particular,
choosing qto so that qt is nonnegative for ali t and so that K{+" as determined by equation (14),
does not fall below zero. The solution method that we employ is an iterative procedure designed
to converge to a value of qto that satisfies these properties. Hence, as long as an equilibrium
exists, which can be established using standard arguments, this solution procedure is able to approximate it subject to the accuracy of the computer.
The solution procedure used is a shooting algorithm that is implemented as follows.
Setting K{o and N ro as described above and letting qro
=
qto ' where qtc is the steady state valuealong the Malthus-only growth path, we use equations derived in the previous section to obtain a
sequence
{q"
K,.
njセNL@.
.
The simulation stops (T is determined) onceqt
either becomes negativeor becomes so large that Kt+l is negative.
If?fr
becomes negative, we repeat the procedure with"
Through a process of iterating in this manner, we eventual1y bound the true value of q,o within a
very small interval. The value of
q,o
that is obtained once the interval is sufficiently smaJl isstored as the first element oi the sequence I l q, QGセ@J
;
that is, we set qt=
q, .
1-'0 o o
AIthough equation (13) could, in principIe, be used to obtain the subsequent elements of
this sequence, this procedure would magnify the numerical errors introduced by the finite
accuracy of the computer. Hence, in order to correct as much as possible for these inaccuracies,
we obtain the subsequent elements of the q sequence by following a procedure similar to that
used to obtain the first elemento In particular, we repeatedly forro the sequence
{q,.
K" N,}
セNLN⦅i@
in order to narrow the upper and lower bound of q'o+l using the shooting algorithrn just described.The values for i(+l and N'o+l in these sequences are set equal to the values of Kto+l and N'o+l
found in the final iteration of the previous step. The procedure is repeated until the entire
sequence
{q,
};:t
o has been computed. Given this sequence, the remaining equilibrium prices andquantities can be computed using the equations described in the previous section.
An advantage of our shooting algorithm is that uniqueness or lack thereof can be
determined for the particular economy being analyzed. This is the case because the search is
one-dimensional over possible initial prices of land.13 For the economies we studied, we find
that for initial q outside a very narrow range, the generated paths become inconsistent with
equilibrium. Given existence, equilibriurn initial land price must be in this computationally
deterroined narrow rage. Given continuity of the functions used in our shooting algorithrn,
equilibriurn Kt+l and
N
t+1 have been detennined to a high degree of accuracy.5. Quantitative Findings
Calibration
Assuming that the economy is initially in a Malthus-only steady state, we simulate the
equilibrium path for a nurnber of periods until essentially all of the available capital and labor are
•
employed in the Solow sector.14 The model is calibrated so that (1) the Malthus-only economy is
consistent with the growth facts describing the English economy prior to 1800; (2) the
Solow-only economy matches the growth fac[s àescribing post World War II industrialized economies;
(3) the population growth rate reacts to changing living standards as reported in Lucas (1998);
and (4) the implied annual real interest rates are reasonable given available data.
Requirement (1) is used to calibrate Y M fi> and J1 ; while (2) is used to assign values to
Y s and
e.
Given that we did not have good data on factor shares for the earlier period, we chose to set labor's share equal to .6 in both sectors, which implies values for J1 ande
equal to.6 and .4, respectively. We experimented with various low values for
i/J,
and use a value of .1 inthe experiment reported here. This implies that land's share in the Malthus-only economy is .3.
In the pre 1800 period, we found, based on data reported in Lucas (1998), lhat population grew about .3 percent per year on average. In order that per capita income is constant in the
Malthus-only economy, and given that a period in our model is interpreted to be 35 years, we set
Y M
=
1.032. We calibrated Y s to match the growth rate of per capita GDP in the postwarperiod. This led us to choose
y
s == 1.518.We set the discount factor
f3
equal to 1. This value implied annual interest rates thatvary from about 2 percent in the Malthus era to between 4 and 4.5 percent in periods when the
Solow technology is heavily used.
Lucas (1998) provides data on population growth rates along side per capüa GDP for
various regions of the world from 1750 to the present. We use this information to calibrate the
population growth function, g(cl ). In particular, population growth rates appear to increase
linearly in Cl from the Malthus steady state to a poinl where population is doubling each period
(every 35 years). Over this period of rising population growth rates, living standards (c: in our
madel) double from the Malthus steady state. After this, the population growth rate decreases
linearly in CI untilliving standards are approximately 18 times what they were in the Malthus
14 Proposition 1 implies that some fraction of total resources will always be employed in the Malthus sector,
•
•
•
steady state. We assume that population is constant as Cl grows beyond this point. This gives us
the following fonn for the function g(cl ):
y
セiMセMエᄏ@
(2 -
.5....1
+
2l(
.5....
-11
C1M ) C1M )
g(c1 )
=
2- c1 -2C1M16c1M 1
for
2C
1M セ@ c1 セ@ 18c:Mfor C1
>
18c1MThe following figure graphs the function g( c1) against values of c) / c1 M :
Findings
Population Growth Function: g(c1/c1 M)
2.5 - - - -.. -.-
----2 KMMMセセセMMMMMMMMMMMMMMMMMMMMMMMMMMMMMMMMMMMMMMMMM
1.5 KMMMセMMMMMMMMMMMMMMMMセセセMMMMMMMMMMMMMMMMMMMMMMM
0.5
+---,
o
セMMMMMMMMMセMMMMMMMMMセMMMMMMMMMMMMMMMMMMMMMMセ@o 5 10
c1/c1 M
Figure 3
15 20
We simulated the economy beginning with períod to
=
-5 for eleven períods at which (15)point the transition to the Solow technology was effectively complete. Figure 4 shows how the
transition takes place by indicating the fraction of productive inputs (capital and labor) employed
in the Malthus sector each período The transition takes three generations frem the point when the
Solow technology is first used until over 99 percent of the resources are allocated to the Solow
•
..
•
1.2
1.0
I-Fraction K in
0.8
_._-_.
セセMi@ Malthus- - - Fraction N in
0.6 _ _ _ _ o
Mallhus
0.4
0.2
..
0.0
-5 -4 -3 -2 -1
o
2 3 4 5Perlod
L---_ _ _ _ _ _ _ _ _ _ _ _ _ _ _ _ セ@
Figure 4
Only the Malthus technology is used from periods
-5
toO.
During this time, as shown inFigure 5, output per worker remains constant. Once the industrial revolution begins in period 1,
output per worker grows at increasingly higher rates. Eventual1y, the rate of growth will
converge to the constant rate characterizing the steady state of a Solow-only economy.
7.00 6.00 5.00 4.00 3.00 2.00 1.00 0.00
-5 ·4 -3
Output per Worker
·2 ·1
o
Period
Figure 5
-セ@
2 3
セ@ 1 I
/
/
·7
!/
1
4 5
During the periods when only the Malthus technology is being used, population grows at
the same rate as output and the wage stays constant. After period O, population growth increases,
and the real wage increases as well (see Figure 6, where the wage has been nonnalized to one in
..
•
!
QセZ@
-.----__
===-_.=.
]セ⦅キ@
____
M。セM]M・M]M。M]MョMMセ⦅ー⦅o⦅pMu⦅iセMエMiMoZョZセMMM⦅MM
_ _セ@
Ii 7.00 --- ---.- ---
I
6.00 _____ ____ I
5.00
4.00 ----. 3.00 _.
2.00
-.. -- l-wage
1--.-._____ - - - Population セM __
I 1.00
+---...
セセM]MZZZイMMMMMMMMGZBG@-
-
-
I0.00 NNiMMMBBMMMBBGMMMイMMMZMMMセMMイMMセMMイMMMMMMBGMM
Mセ@
-5 -4 -3 -2 -1 O 2 3 4
Period
Figure 6
In addition, Figure 7 shows that the value of land relative to output decreases after the
industrial revolution. Again, this is roughly consisten! with the behavior of fannland values in
the U.S. in the twentieth century (see Table 2).
I I iO.3o
1°·25
10.20 iO.15 iO.10 0.05 0.00-5 -4
Value of Land Relative to Output
""
\
\
\
"
-3 -2 -1
o
1 2Perlod
Figure 7
l
I
3 4 5
Finally, Figure 8 shows the population growth factor. It increases at the beginning of the
industrial revolution to a maximum leveI with population doubling every 35 year period. Then
the population growth rate declines as the standard of living increases until 5 periods or a 175
•
•
2.5
2.0
1.5
1.0
0.5
10.0
I
-5 -4 -3I
5. Conclusion
-2
Population Growth
-1 0 1 2
Period
Figure 8
3 4 5
Most of the existing literature on economic growth is consistent with features of modem
industrial economies, but inconsistent with the growth facts describing pre-industrial economies.
This includes both models based on exogenous technical progress, such as Solow (1957), as well
as more recent models with endogenous growth like Romer (1986) and Lucas (1988). There also
exist examples of theories consistent with facts describing the early period, yet inconsistent with
features of the later period [see Lucas (1998)]. In this pape r we have presented a growth theory
that is consistent with the growth facts from both periods. The transition from a pre-industrial to
industrial economy, the industrial revolution, is a property of the equilibrium path associated
with our theory.
We have chosen to cast our theory in the context of the overlapping generations model of
Diamond (1965). We found this to be a natural way to model population growth in an
equilibrium setting. We see no reason, however, why our results should not generalize to an
infinite horizon context like that used in much of the growth literature-an optimal growth
• model with exogenous technology and population growth, for example. Our main results, as
summarized in Propositions 1-3, depend primarily on properties of the technology and not at ali
•
•
•
Thomas Malthus theorized that when living standards improve, population growth rates
increase. This feature is present in early stages of development as summarized in our function
g(cl) in equation (15). However, population growth rates eventually falI and appear to ievei oÍf
as living standards improve after the industrial revolution. Our theory is silent as to why this
occurs. Some economists, such as Becker (1960) and Lucas (1998), have argued that this may
be due to a quantity-quality trade-off between the number of children a farnily produces versus
the amount of human capital invested in each child. Other possibilities, perhaps more relevant in
our context, incIude that the Solow technology might offer market opportunities that cause
households to substitute out the home production sector into the market sector. That is, the same
sorts of economic incentives that lured women inta the workforce in the 1970's and 1980's may
be responsible for the fali in population growth rates as living standards improve. We leave it to
future work to explore these ideas.
Similarly, we have not explored the role policy might play in deterrnining how quickly
the Solow technology is adopted. For example, Parente and Prescott (1997) have studied how
policy can affect the levei of the total factor productivity parameter in the Solow technology. By
keeping this parameter small, policy can affect when equation (8) is satisfied and, hence, when
(if ever) the industrial revolutions occurs. The fact that the industrial revolution happened first in
England in the early 19th century rather than in China, where the stock of useable knowledge
may have actuaIly been higher, is due perhaps to the institutions and policies in place in these
•
•
•
References
Becker, Gary S. 1960. An Economic Analysis of Fertility. In Richard Easterlin, ed.,
Demographic and Economic Change in Developed Countries: A Conference ofthe
Universitíes-National Bureau Committeefor Economícs. Princeton: Princeton
University Press, pp. 209-240.
Becker, Gary S, Kevin M. Murphy, and Robert Tamura. 1990. Human capital fertility and economic growth. Journal of Polítical Economy 98: S 12-S37.
Clark, Gregory. 1998a. Microbes and Markets: Was the Black Death an Economic Revolution? Unpublished manuscript (University of Califomia, Davis).
Clark, Gregory. 1998b. Nominal and Real Male Agricultural Wages in England, 1250-L850. Unpublished manuscript (University of California, Davis).
Diamond, Peter A. December 1965. National debt in a neoclassical growth mode!. The American Economic Review, vol. 55, n. 5, pp. 1126-1150.
Galor, Oded and David K Weil. 1998. Population, Technology, and Growth: From the Malthusian Regime to the Demographic Transition. Unpublished manuscript (Brown Uni versity).
Laitner, John. September 1998. Structural change and economic growth. Unpublished manuscript (University of Michigan).
Lucas, Robert E.,
Ir.
1988. On the rnechanics of economic developrnent. JournaZ of MonetaryEconomics, vol. 22, n. 1, pp. 3-42.
Lucas, Robert E., Ir. February 1998. The Industrial Revolution: Past and Future. Unpublished
manuscript (University of Chicago).
Maddison, Angus. 1991. Dynamic Forces in Capitalisl Development: A Long Run Compara tive
View. Oxford and New York: Oxford University Press.
Malthus, Thomas R. 1798. An Essay on lhe Principle of Population. Oxford: Oxford
University Press (1993 printing).
•
•
•
Nordhaus, William D. 1997. Do real output and real wage measures capture reality? The history of lighting suggests no!. In The Economics of New Goods, Eds. Bresneham, Timothy F., and Robert J. Gordon. NBER Studies in Income and Wealth. Chicago and London: University of Chicago Press, voI. 58, pp. 29-71.
Parente, Stephen L. and Edward C. Prescott 1997. Monopoly rights: A barrier to riches. Federal Reserve Bank of Minneapolis Staff Report 236, July 1997.
Phelps-Brown, Henry, and Sheila V. Hopkins. 1956. Seven centuries ofthe prices of consumables, compared with builders' wage rates. Economica 23: 296-315.
Romer, Paul. 1986. Increasing Returns and Long-Run Growth. Joumal Df Political Ecollomy 94: 1002-1037.
Tamura, Robert. 1998. From Agriculture to Industry: Human Capital and Specialization. Unpublished manuscript (Clemson University).
U.S. Department of Commerce, Bureau of the Census. 1975. Historical Statistics ofthe United
FUNDAÇÃO GETULIO VARGAS
BIBLIOTECA
ESTE VOLUME DEVE SER DEVOLVIDO A BIBLIOTECA
NA ÚLTIMA DATA MARCADA
N.Cham. P/EPGE SPE H526m
Autor: Hansen, Gary D. Título: Malthus to Solow.
1111111111111111111111111111111111111111
FGV -BMHS
089228
52159
N° PaI.: F2821 /99