J. Evid. Based Med. Healthc., pISSN- 2349-2562, eISSN- 2349-2570/ Vol. 3/Issue 44/June 02, 2016 Page 2208
A STUDY OF LIPID PROFILE IN PREDIABETES
Manoj Kumar1, Prem Shankar Singh2, Khwaja Saifullah Zafar3, Granth Kumar4
1Associate Professor, Department of General Medicine, U. P. Rural Institute of Medical Sciences and Research, Saifai. 2Professor, Department of General Medicine, U. P. Rural Institute of Medical Sciences and Research, Saifai.
3Associate Professor, Department of General Medicine, U. P. Rural Institute of Medical Sciences and Research, Saifai. 4Assistant Professor, Department of General Medicine, U. P. Rural Institute of Medical Sciences and Research, Saifai.
ABSTRACT BACKGROUND
Lipid abnormalities are common in diabetes mellitus and play an important role in acceleration of atherosclerosis leading to increased cardiovascular diseases. Due to increasing burden of diabetes, it is becoming important to identify dyslipidaemia in high-risk state for diabetes especially prediabetes so that early intervention can reduce cardiovascular risk.
AIM
To study lipid profile in prediabetes individuals.
METHODS
This study was a cross-sectional case control study which included 107 prediabetes and 101 healthy controls. Lipid profile of prediabetes and controls were measured and statistically analysed.
RESULT
Total cholesterol, LDL, triglycerides, VLDL, TG/HDL ratio, and LDL/HDL ratio were significantly high whereas HDL was significantly low in prediabetes subjects as compared to controls.
CONCLUSION
This study showed significant lipid abnormalities in prediabetes subjects. Because of these they are at high risk of developing atherosclerotic cardiovascular diseases. Therefore, proper screening and appropriate therapy of these conditions becomes important.
KEYWORDS
Dyslipidaemia, Triglycerides, Lipoprotein, Cholesterol, Glycaemia, Normoglycaemic, Atherogenic.
HOW TO CITE THIS ARTICLE: Kumar M, Singh PS, Zafar KS, et al. A study of lipid profile in prediabetes. J. Evid. Based Med. Healthc. 2016; 3(44), 2208-2212. DOI: 10.18410/jebmh/2016/489
INTRODUCTION: Due to increasing burden of type 2 diabetes mellitus (T2DM) and its complications, much attention has been given to prevention, beginning with identifying at-risk individuals prior to diagnosis.1 This has led
to the designation of “prediabetes,” which is typically defined as blood glucose levels above normal but below diabetes thresholds, is a risk state that defines a high chance of developing diabetes.2 347 million people worldwide have
diabetes. Glycaemic levels are rapidly rising in developed and developing countries.3 Increase in glycaemia has
resulted in a rise in prediabetes prevalence. Prevalence of diabetes and pre-diabetes in India in 2011 was 62.4 and 77.2 million respectively.4 Diagnostic criteria for prediabetes
have changed over time.
According to the World Health Organization (WHO), high risk for developing diabetes relates to two distinct states, impaired fasting glucose (IFG) defined as fasting plasma glucose (FPG) of 110-125 mg/dL (in the absence of impaired glucose tolerance – IGT) and IGT defined as post-load plasma glucose of 140-199 mg/dL based on 2-hour oral glucose tolerance test (OGTT) or a combination of both.5 The
American Diabetes Association(ADA), although applying the same thresholds for IGT, uses a lower cut-off value for IFG (FPG 100-125 mg/dL) and has additionally introduced haemoglobin A1c levels of 5.7–6.4% as a new category of high diabetes risk.6 Around 5–10% of people with
prediabetes become diabetic annually.2 Nearly 70% of
prediabetes subjects can eventually develop diabetes if not managed in early stages.7 Both IFG and IGT are associated
with increased cardiovascular risk.8 Dyslipidaemia,
frequently occurring in T2DM patients, play a critical role in acceleration of macrovascular atherosclerosis and contribute to the excess risk of CVD.9 Therefore, it is important to
diagnose lipid abnormalities in prediabetes state itself. Many studies have been done on lipid profile in prediabetes subjects in developed countries. But there is paucity of such studies in India. Present study is aimed to study lipid profile in prediabetes individuals.
Financial or Other, Competing Interest: None. Submission 05-05-2016, Peer Review 20-05-2016, Acceptance 28-05-2016, Published 02-06-2016. Corresponding Author:
Dr.Manoj Kumar,
Flat No. D 302, Type – 4, New Campus,
U.P. Rural Institute of Medical Sciences and Research (RIMS & R), Saifai, Etawah, Uttar Pradesh.
J. Evid. Based Med. Healthc., pISSN- 2349-2562, eISSN- 2349-2570/ Vol. 3/Issue 44/June 02, 2016 Page 2209
MATERIAL AND METHOD: This study was a cross-sectional case control study carried out at U.P. Rural Institute of Medical Sciences and Research. 107 prediabetes
and 101 controls were recruited from OPD of the hospital. Study was conducted between January 2014 and December 2015(2 years).
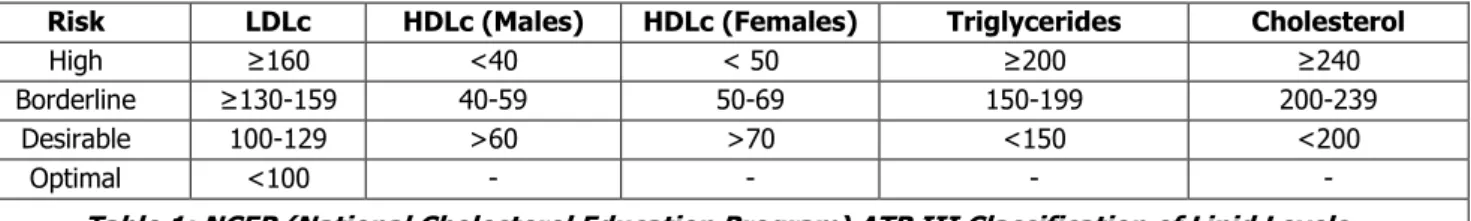
Risk LDLc HDLc (Males) HDLc (Females) Triglycerides Cholesterol
High ≥160 <40 < 50 ≥200 ≥240
Borderline ≥130-159 40-59 50-69 150-199 200-239
Desirable 100-129 >60 >70 <150 <200
Optimal <100 - - - -
Table 1: NCEP (National Cholesterol Education Program) ATP III Classification of Lipid Levels
Study was initiated after taking permission from Institutional Ethical Committee. Informed consent was taken from all participants before including in study.
Inclusion Criteria:
1. For cases: Subjects who met following criteria for blood sugar level were included in case group (Prediabetes group).
a. Fasting plasma sugar level 110-125 mg/dL or, b. Post prandial plasma sugar level (after 2 hours of
75 g oral glucose) 140-199 mg/dL or, c. Combination of both of above.
2. For Control: Age and sex matched subject who has fasting plasma sugar level <110 mg/dL and post prandial plasma sugar level (after 2 hours of 75 g oral glucose) <140 mg/dL.
Exclusion Criteria: Subjects having conditions/disorders known to affect lipid profile like hypo or hyperthyroidism, nephrotic syndrome, renal failure, liver disorders, obesity (BMI>30 kg/m2), malnutrition (BMI<18.5 kg/m2), smoking,
alcoholism, and diabetes were excluded from study.10,11
Biochemical measurements including fasting plasma sugar, postprandial plasma sugar (after 2 hours of 75 g oral glucose), thyroid stimulating hormone(TSH), 24-hour urinary protein, kidney function test (serum urea and creatinine), liver function test (serum bilirubin, albumin, SGOT, SGPT and alkaline phosphatase), fasting lipid profile (serum total cholesterol(TC), low density lipoprotein cholesterol(LDL), triglycerides(TG), high density lipoprotein cholesterol (HDL), very low density lipoprotein cholesterol (VLDL)), were done. Abnormal lipids were defined as per NCEP (National Cholesterol Education Program) ATP III classification as shown in Table 1.
Variables Case(n=107) Control(n=101) Test statistics value P value
Age 41.69±3.91 42.57±5.44 t= -1.337 0.183
Sex (M/F ratio) 61/46 57/44 χ2= 0.014 0.905
Sr. Total Cholesterol(mg/dL) 180.10±36.81 167.15±27.97 t= 2.865 0.005
Sr. LDL(mg/dL) 116.95±29.16 95.62±21.30 t= 6.047 <0.001
Sr. HDL(male) (mg/dL) 33.33±4.99 42.81±9.60 t= -6.662 <0.001
Sr. HDL(female) (mg/dL) 35.65±7.23 52.09±8.10 t= -10.165 <0.001
Sr. TG(mg/dL) 144.07±42.84 123.39±33.73 t= 3.881 <0.001
Sr. VLDL(mg/dL) 28.81±8.57 24.68±6.75 t= 3.881 <0.001
TG/HDL ratio(mg/dL) 4.30±1.40 2.77±1.00 t= 9.133 <0.001
LDL/HDL ratio(mg/dL) 3.50±1.03 2.15±0.70 t= 11.198 <0.001
Table 2: Comparison of Baseline Variables and Lipid Profile of Cases (Prediabetes Subjects) and Controls
STATISTICAL ANALYSIS: Statistical analysis was done using Microsoft Excel 2010 and IBM SPSS statistics version 23. Unpaired t test and chi-squared test were used for comparison. A ‘p’ value <0.05 was used for level of significance.
RESULTS: Mean lipid level including total cholesterol, LDL, HDL, TG, VLDL, triglycerides, high density lipoprotein-cholesterol concentration (TG/HDL) ratio and low density lipoprotein-high density lipoprotein cholesterol concentration (LDL/HDL) ratio of cases and controls with statistical significance are given in table 2. Comparison of dyslipidaemia between cases and control are given in Table 3 and Fig. 1.
Serum Lipids Case Group Control Group Test Statistic Value P Value
Total Cholesterol(mg/dL)
<200 68(63.55%) 88(87.13%)
≥200 39(36.45%) 13(12.87%) χ2 =53.055 <0.001
LDL Cholesterol(mg/dL)
<100 38(35.51%) 58(57.43%)
J. Evid. Based Med. Healthc., pISSN- 2349-2562, eISSN- 2349-2570/ Vol. 3/Issue 44/June 02, 2016 Page 2210
HDL Cholesterol(Male) (mg/dL)
<40 54(88.52%) 21(36.84%)
≥40 7(11.48%) 36(63.16%) χ2 =70.045 <0.001
HDL Cholesterol(Female) (mg/dL)
<50 44(95.65%) 20(45.45%)
≥50 2(4.35%) 24(54.55%) χ2 =46.747 <0.001
Triglycerides(mg/dL)
<150 53(49.53%) 88(87.13%)
≥150 54(50.47%) 13(12.87%) χ2 =134.894 <0.001
VLDL(mg/dL)
<38 97(90.65%) 96(95.05%)
≥38 10(9.35%) 5(4.95%) χ2 =4.385 0.036
TG/HDL Ratio
<3.5 34(31.78%) 83(82.18%)
≥3.5 73(68.22%) 18(17.82%) χ2 =185.591 <0.001
LDL/HDL Ratio
<2.5 23(21.50%) 73(72.28%)
≥2.5 84(78.50%) 28(27.72%) χ2 =137.736 <0.001
Table 3: Lipid Abnormalities in Cases vs. Control
DISCUSSION: In our study, total cholesterol in prediabetes subjects was significantly higher than controls (180.10 mg/dL of case vs. 167.15 mg/dL of control). This observation
was similar to previous studies. Williams et al observed that mean cholesterol was higher in prediabetes subject (174.2 mg/dL) than control (157.5 mg/dL).12
Fig.1: Bar Diagram Showing Comparative Dyslipidaemia: Prediabetes vs. Control
In our study, mean LDL cholesterol was significantly higher in prediabetes subjects than controls (116.95 mg/dL of cases vs. 95.62 mg/dL of control). Magge et al observed that obese prediabetes adolescents have significantly more atherogenic lipoprotein profile compared with obese normoglycaemic peers.13 Shin et al also found LDL
cholesterol significantly higher in prediabetes subject (150.5±38 mg/dL) than non-diabetic controls (134±34.6 mg/dL). They also proved that there was correlation between raised blood glucose level and low density
lipoprotein.14 Miyazaki et al also found higher LDL cholesterol
level in prediabetes subjects. They also stated that lipid profile in IGT/IFG appears to be very similar to diabetic dyslipidaemia.15 Similarly, Rahbar et al reported that
pre-diabetics are at higher risk of having increased level of LDL cholesterol (LDL-c).16 In our study, HDL cholesterol was
J. Evid. Based Med. Healthc., pISSN- 2349-2562, eISSN- 2349-2570/ Vol. 3/Issue 44/June 02, 2016 Page 2211
HDL in prediabetes subject (49.9±11.6 mg/dL) as compared to non-diabetic controls (54.7±13.3 mg/dL).14
Miyazaki et al observed low HDL level in prediabetes subject compared to controls.15 Similarly Rabhar et al also
observed higher risk of having low HDL cholesterol in prediabetes subjects.16 In our study, serum triglycerides
were significantly higher in prediabetes than controls (144.07 mg/dL of cases vs. 123.39 mg/dL of controls). This observation was again similar to observations in previous studies on prediabetes. Miyazaki et al observed raised triglycerides in prediabetes subjects.15 Rahbar et al also
observed prediabetes subjects are at high risk of having high triglycerides.16 Similarly Barzi et al, Gaziano et al and Boizel
et al observed significantly higher serum triglycerides levels in IFG/IGT subjects compared to normal fasting glucose/normal glucose tolerance (NFG/NGT) subjects.17-19
Similarly, VLDL was higher in prediabetes subjects than controls in our study. In our study, triglycerides-high density lipoprotein cholesterol concentration (TG/HDL) ratio was higher in prediabetes subject than in controls (4.30 of cases vs. 2.77 of controls). Miyazaki et al observed that IGT/IFG subjects had higher TG/HDL ratio than controls (4.0±2.5 for cases and 2.7±1.9 for controls).15 Barzi et al, Gaziano et al
and Boizel et al also reported higher TG/HDL ratio in IFG/IGT subjects compared to NFG/NGT subjects.17-19 McLaughlin et
al concluded that TG/HDL ratio >3.5 predicts insulin resistance. They found that this cut-off had high sensitivity (79%) and specificity (85%) in their study population and concluded that a plasma TG/HDL cholesterol concentration ratio might provide a simple means of identifying insulin resistance.20 In our study, LDL/HDL ratio was significantly
higher in prediabetes subjects as compared with controls. However, Miyazaki et al showed no statistical difference in LDL/HDL ratio between case group and control group.15
CONCLUSION: This study showed significant lipid abnormalities in prediabetes subjects. Total cholesterol, LDL, triglycerides, VLDL, TG/HDL ratio, and LDL/HDL ratio were significantly higher whereas HDL was significantly lower in prediabetes subjects. Dyslipidaemia in these individuals put them in high risk category for cardiovascular diseases. Therefore, proper screening of prediabetes and associated dyslipidaemia is necessary as life style modification and pharmacotherapy can control these conditions and thereby reduce cardiovascular risk.
REFERENCES
1. Abraham TM, Fox CS. Implications of rising prediabetes prevalence. Diabetes Care 2013;36(8):2139-2141.
2. Tabák AG, Herder C, Rathmann W, et al. Prediabetes: a high-risk state for developing diabetes. Lancet 2012;379(9833):2279-2290.
3. Danaei G, Finucane MM, Lu Y, et al. National, regional, and global trends in fasting plasma glucose and diabetes prevalence since 1980: systematic analysis of health examination surveys and epidemiological studies with 370 country-years and
2.7 million participants. Lancet 2011;378(9785):31-40.
4. Anjana RM, Pradeepa R, Deepa M, et al. Prevalence of diabetes and prediabetes (Impaired fasting glucose and/or impaired glucose tolerance) in urban and rural India: phase I results of the Indian Council of Medical Research-India diabetes (ICMRINDIAB) study. Diabetologia 2011;54(12):3022-3027. 5. World health organization, international DF.
Definition and diagnosis of diabetes mellitus and intermediate hyperglycaemia: report of a WHO/IDF consultation. Geneva: World Health Organization 2006.
6. American diabetes association
.
Diagnosis andclassification of diabetes mellitus. Diabetes Care 2011;34(Suppl 1):S62-S69.
7. Markin B, Michael B. Prediabetes and diabetes prevention. Med Clin North Am 2011;95(2):289-290. 8. Karbek B, Cakal E, Cakir E, et al. Cardiovascular risk factors, carotid artery intima media thickness, and HSCRP levels in patients with impaired glucose metabolism. Minerva Endocrinol 2013;38(3):297-304.
9. Garg A, Grundy SM. Management of dyslipidaemia in NIDDM. Diabetes Care 1990;16:434-444.
10. WHO expert consultation. Appropriate body-mass index for Asian populations and its implications for policy and intervention strategies. Lancet 2004;363(9403):157-163.
11. Rader DJ, Hobbs HH. Disorders of lipoprotein metabolism. In: Longo DL, Fauci AS, Kasper DL, et al, eds. Harrison's Principles of Internal Medicine. New York, NY: McGraw-Hill 2012;2(18th edn):3145-3161.
12. Williams DE, Cadwell BL, Cheng YJ, et al. Prevalence of impaired fasting glucose and its relationship with cardiovascular disease risk factors in US adolescents, 1999-2000. Pediatrics 2005;116(5):1122-1126. 13. Magge SN, Prasad D, Koren D. Prediabetic obese
adolescents have a more atherogenic lipoprotein profile compared with normoglycemic obese peers. J Pediatr 2012;161(5):881-886.
14. Shin JY, Lee HR, Lee DC. Increased arterial stiffness in healthy subjects with high normal glucose levels and in subjects with pre-diabetes. Cardiovasc Diabetol 2011;10:30.
15. Miyazaki Y, Furugen M, Akasaka H, et al. Atherogenic lipids profile relates to postprandial hyperglycemia and hyperinsulinemia due to whole body insulin resistance in prediabetic subjects. Journal of Diabetes Mellitus 2012;2(3):272-278.
16. Rahbar S. An abnormal hemoglobin in red cells of diabetics. Clin Chem Acta 1968;22(2):296-298. 17. Barzi F, Patel A, Woodward M, et al. A comparison of
J. Evid. Based Med. Healthc., pISSN- 2349-2562, eISSN- 2349-2570/ Vol. 3/Issue 44/June 02, 2016 Page 2212
18. Gaziano JM, Hennekens CH, O’Donnell CJ, et al. Fasting triglycerides, high-density lipoprotein, and risk of myocardial infarction. Circulation 1997;96(8):2520-2525.
19. Boizel R, Benhamou PY, Lardy B, et al. Ratio of triglycerides to HDL cholesterol is an indicator of LDL particle size in patients with type 2 diabetes and normal HDL cholesterol levels. Diabetes Care 2000;23(11):1679-1685.