Vol. 2 No. 2 pp. 127-134
127
TOWARDS NUTRITION SECURITY: FOOD LABEL USE
AMONG NIGERIANS
AbrahamFalola
Department of Agricultural Economics and Farm Management, University of Ilorin, P. M. B 1515, Ilorin, Kwara State, Nigeria E-mail: falolaabraham@yahoo.com
Abstract
This study focuses on food label use by Nigerians, using Kwara State as a case study. Specifically, the study describes the socio-economics characteristics of the respondents, determined people’s perception about food labels and examined factors influencing willingness-to-read food labels in the study area. A total of 120 respondents selected through a combination of purposive and random sampling techniques were used for the study. Data were analyzed with descriptive statistics, 5-point likert scale and logistic resgression analysis. Majority of the respondents were females (72.5%), married (60%) and had secondary education (50%). The mean age, household size, number of preschool children and household income of the respondents were 26years, 9 persons, 2 children and N25,250.00/month (USD 157.81) respectively. The respondents opined that food labels were used mainly for traceability (M = 3.24), registration status of the food producer (M = 3.01), advertisement (M =4.02), as a legal requirement (M = 4.00), to know the expiry dates (M = 4.57) and to distinguish the product from that of other competitors (M = 3.54). Results of the regression analysis revealed that women were more willing to read food labels than men, and positively related to age of respondent, household income level, educational status of food planner and nutritional knowledge of the food planner. However, willingness-to-read food labels by the respondents declined with household size and number of preschool children. The study therefore calls for enlightenment of the public by relevant stakeholders on importance of food labels to determine nutritional composition and health implications.
Key words: Food label, use, perception, factors, willingness-to-read
1. Introduction
The importance of good nutrition for healthy living cannot be overemphasized. This is necessary given the fact that the rate at which people suffer from health risks which can result from eating poor diet is very alarming in recent days. Some of these risks are high blood pressure, high body mass index, high cholesterol, high blood glucose, low food and vegetable intake. According to the World Health Organization (WHO) (2009), though these health risk factors are usually associated with high-income countries, over 84% of the total global burden of disease they cause occurs in low- and middle-income countries, including Nigeria. Hence, the need for low- and middle-income populations to be aware of health implications of the foods they eat becomes imperative.
Clearly, one way of mitigating these health risks is the use of food labels. Food labels may help people make better food purchase decisions and adopt healthier eating patterns (Grunert & Wills, 2007; Mhurchu & Gorton, 2007; Nørgaard & Brunsø, 2009). Use of food labels can bridge the health information gap between producers and consumers and aid in
128
labels can also be used as time-effective marketing tools to generate consumer confidence in food quality and communicate healthfulness of food items (Caswell & Padberg, 1992). This is very important especially in the quest to achieve nutrition security, which involves ensuring a good nutritional outcome (Adeniyi et al., 2011). This is moreso important given the fact that about 29% of Nigerian population are said to be chronically undernourished and this translates to about 5.4% of the total undernourished people in Sub-Saharan Africa as a whole (Adeniyi et al, 2011; FAO, 2005)
Several studies have focused on use of food labels in developed countries (Aygen, 2012; Grunert, 2007; Grunert et al., 2010; McLean-Meyinsse, 2001; Mhurchu & Gorton, 2007; Ollberding et al., 2010). However, such studies are either scanty or non-existent in developing countries, including Nigeria. This is a research gap which this study intends to fill. An understanding of food label use is important to influence dietary choices and food outcomes. Therefore, this study examines perception of Nigerians about food labels using Kwara State as a case study. The specific objectives are to: describe the socio-economic characterstics of food shoppers in the study area, examine their opinion about food labels, and determine factors influencing willingness to read food labels by the respondents.
2. Methodology
This study was carried out in Kwara State, Nigeria. The state is located in the North Central part of the country and is made up of sixteen (16) Local Government Areas (LGAs). The state lies between latitude 7015′E and 6018′ N of the equator and has a population of about 2.37 million people (National Population Commission, 2006). It shares local boundaries with Oyo, Osun, Ondo, Kogi, Ekiti, and Niger states and an international boundary with the Republic of Benin.
A three-stage sampling technique was adopted for the study study. First, four LGAs were randomly selected from the 16 LGAs in the state. This was followed by purposive selection of six supermarkets or food shops in each of the selected LGAs. Third, structured questionnaires were administered to five (5) shoppers across the selected supermarkets/food shops, giving a total of 120 respondents. Data collected include socio-economic characteristics of the respondents such as gender, marital status, age, highest educational level attained, occupational status, household size, household income and number of preschool children. Respondents were also asked to rate the nutritional knowledge of their food planners (those who decide and prepare their meal) as: none (0), low (1), medium (2) and high (3). Also, respondents were required to rate the importance accorded to price of food items, as this could determine their willingness to read food labels. this was rated as: not important (1), less important (2), fairly imporatnt (3), important (4) and very important (5). Respondents were also interviewed about their perception of food labels and their willingness to read them.
Data collected were analyzed with descriptive statistics, 5-point Likert scale and logistic regression. Descriptive tools were used to examine the socio-economic profile of the respondents. Five-point Likert scale was used to assess the opinion of the respondents about food labels. This was measured as: strongly agree (coded 5), agree (coded 4), undecided (coded 3), disagree (coded 2) and strongly disagree (coded 1). Respondents were provided with a list of possible reasons why food packages are labelled. A mean score of 3.0 and above was taken that respondents agreed to the particular reason.
The logistic regression model was used to determine factor influencing
129
situations in which one wants to predict the presence or absence of a characteristic or outcome based on values of a set of predictor variables (Agresti, 1996). According to Borooah (2002), logistic regression is similar to linear regression but is suited to situations in which the dependent variable is dichotomous. Logistic regression coefficients can be used to estimate odds ratios for each of the independent variables in the model. As such, logistic regression was most appropriate for this study due to its unique ability to account for both categorical and dichotomous dependent variables. According to Pampel, (2000), the model equation is given as:
Logit (E [Y]) = Logit (P) =XT β
Where
Logit (E [Y]) = is the binary response/dependent variable Logit (P) = the natural log of the odds of success
XT = the explanatory/independent variables β = is the regression co-efficient
The dependent variable was a dichotomous variable depicting the respondent’s
willingness status and took the value of 1 if the respondent was willing to read food label and 0 if not. The independent variables were the socio-economic factors. The hypothesized independent variables were:
X1 = Household income (N)
X2= Age (years)
X3 = Number of preschool children
X4 = Nutritional knowledge of food planner (None = 0, low = 1, medium = 2 and
high = 3)
X5 = Educational status of food planner
X6 = Household size
X7 = Working status of food planner (None = 2, Part-time = 1 and Full-time = 0)
X8 = Sex of food planner (female = 1, male = 0)
3. Results and Discussion
3.1 Socio-economic Characteristics of Respondents
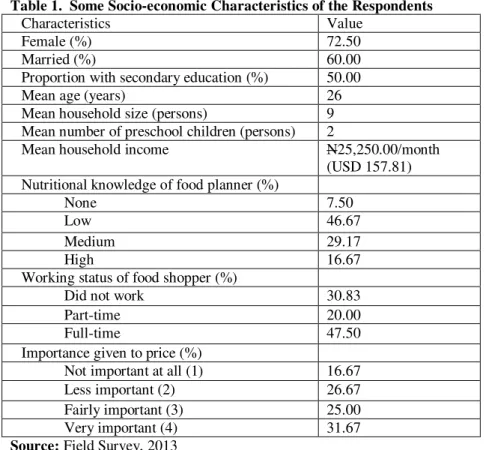
The relevant socio-economic characteristics of the respondents are presented in Table 1. Majority of the respondents were female (72.50%), married (60.00%) and attained secondary education (50%). The mean age and household size of the respondents were 26years and 9 persons respectively.
Number of preschool children of the respondents was ascertained as it could promt them to reading food labels. The mean number of preschool children of the respondents was 2. The average household income was N25,250.00/month (USD 157,81). As regards the nutritional
knowledge of the food planners in the respondents’ households, 46.67% of the respondents
opined that their meal planners had low level of nutritional knowledge, 29.17% had medium knowledge, 16.67% perceived that their food planners had very high knowledge about the food they eat while 7.50% had none at all.
The time available for food purchasing may affect consumer’s use of food labels (Food
Standards Agency, 2010; Grunert & Wills, 2007). For this reason the working status of the
food shoppers in the respondents’ household was assessed. Most (47.50%) of the food
130
Table 1. Some Socio-economic Characteristics of the Respondents
Characteristics Value
Female (%) 72.50
Married (%) 60.00
Proportion with secondary education (%) 50.00 Mean age (years) 26 Mean household size (persons) 9 Mean number of preschool children (persons) 2
Mean household income N25,250.00/month (USD 157.81) Nutritional knowledge of food planner (%)
None 7.50
Low 46.67
Medium 29.17
High 16.67
Working status of food shopper (%)
Did not work 30.83
Part-time 20.00
Full-time 47.50
Importance given to price (%)
Not important at all (1) 16.67 Less important (2) 26.67 Fairly important (3) 25.00 Very important (4) 31.67
Source: Field Survey, 2013
Importance accorded to price of food items was also included as a perception variable to assess its impact on label use. About 31.67% of the redpondents opined that price of food item is very important in determining label use, 25.0% perceived that it was fairly important, 26.67% opined that it was less important while 16.67% of the respondents opined that it is of no relevance to reading food labels.
Table 2. Respondents’ Opinion about Food Labels
Opinion about food labels Mean Standard deviation
For traceability 3.24* 1.0
To determine registration status 3.01* 0.9 To know the nutritional composition 2.14 0.7 Information about quantity to eat 1.99 1.3 For comparison with similar food products 2.02 0.8 Know the expiry date 4.57* 0.8 To provide consumers with information on the health benefits 2.22 1.0 To advertize the product 4.02* 0.8 To distinguish the product from that of competitors (establish a brand) 3.54* 1.0 It is a legal requirement 4.00* 0.9
Note: * Major reasons (Mean ≥ 3)
131 3.2 Perception of Respondents about Food Labels
Table 2 shows opinion of the respondents about food labels. Results shows out of the ten reasons suggested to the respondents, only six of them were perceived as the major reasons for labelling foods; viz: For traceability (mean = 3.24), to determine the registration status n (mean = 3.01), to know the manufacture and best-before date/ expiry date (mean = 4.57), to advertise the product (mean = 4.02), to distinguish the product from that of other competitors (mean = 3.54) and as a legal requirement (mean = 4.00). These results also suggest that the respondents perceived that food labels are not meant essentially for determining the nutritional composition of foods, the quantity to eat, for comparison with other food items and to provide information on the health status of the food item in question.
3.3 Determinants of Willingness to Read Food Labels by the Respondents
Table 3 shows factors influencing willingness to read food labels by the respondents. The chi-square of 117.75 obtained in the study implies that the parameters included in the logistic model are significantly different from zero at the 1 per cent significant level. Moreover, the likehood function of the model was significant (Wald = -23.2335, with p ˂ 0.0000) showing strong explanatory power of the model. The results of the resgression model indicated that seven of the explanatory variables influenced the probability of reading food labels by the respondents. Variables that positively affected willingness to read food labels include household income, age, nutritional knowledge of food planner, educational status of food planner and being a female. The sign of the slope of household income was positive indicating that meal planners of higher-income were more likely to read food labels than meal planners of lower-income households. This might result from the fact that the former households are more likely to afford other types of food provided the food item purchased does not have the nutritional information desired by the households compared to the latter group.
Table 3. Factors Influencing Willingness to Read Food Labels by the Respondents
Variable Coefficient Standard Error
z-value
Constant -1.1763 4.0606 -0.29 Household income 0.0027* 0.0015 1.80
Age 0.0061* 0.0035 1.75
Number of preschool children -0.4449* 0.2293 -1.94 Nutritional knowledge of food planner 0.1899** 0.0793 2.39 Educational level of food planner 1.7803** 0.7432 2.40 Household size -0.0719* 0.0432 -1.66 Working status of food shopper -0.5469 0.5587 -0.98 Importance accorded to price of food item 0.2727 0.3328 0.82
Sex 1.4901* 0.8205 1.82
LR chi2 (9) 117.75 Prob > chi2 0.0000 Pseudo R2 0.7170 Log likehood -23.2335
Note: ** and * = Figures significant at 5% and 10% significant levels respectively
132
Age was also positively related to willingness to read food labels. This means that the older one is, the more likely one reads food labels. This is logical, as older individuals might be more cautious of what they eat for health reasons.
Level of nutritional knowledge of food planner was also positively and significantly related to probability of reading food labels by the respondents. Food planners with sound nutritional knowledge are likely to be more aware of the relationship between diet and health, and so are more motivated to use nutritional labels. Besides, such planners are more likely to understand the health implications of any food item they procure.
Educational level of meal planner was also positively related to willingness to read food labels. This is probably because those with higher education are more likely to understand and process the information on food packages than the less educated ones.
Results of the regression model further revealed that the female were more likely to read food labels than the male. This may be because in Africa, including Nigeria, the female are usually the meal planners in many households.
The variables that negatively affected willingness to read food labels were household size and number of preschool children. The results also suggest that a unit increase in household size or number of school children decreased respondnets’willingness to read food labels by 7.19% and 44.49% respectively. This may result from the fact that the higher the number of either household members or number of preschool children, the lower the amount of income that would be available to cater for each member/child. Hence, such households may feel reluctant in reading information on food packages.
4. Conclusion and Recommendations
This study has assessed the perceptions of Nigerians about food labels using Kwara State as case study. It stemmed from the need to ensure nutrition securtiy and guide against health problems that result from taking unwholesome foods. It can be inferred from the study that Nigerians perceive traceability, determination of registration status of food producers, advertisement, legal requirement, knowing the expiry dates and distinguishing food item from that of other competitors as the major reasons why food packages are labelled. The study has also revealed that Nigerian females are more willing to read food labels than males. Moreover, willingness to read food labels is positively influenced by level of nutritional knowledge of food planners, age of food consumer, household income level and educational status of food planner. It however declines with household size and number of preschool children.
133 References
Adeniyi, O.R., Ayandiji, A. & Ojo, A. (2011). Food Security Status of Rural Farming Households in Osun State. In P. O. Arhabor, C. I. Ada-Okungbowa, C. O. Emokaro & M. O. Abiola (Eds). From Farm to Table:Wither Nigeria. Proceedings of the 12th Annual National Conference of Nigerian Association of Agricultural Economists, 369-376. Agresti, A. (1996). An Introduction to Categorical Data Analysis. John Wiley and Sons, Inc,
USA.
Aygen, F.G. (2012). Determinants of Nutrition Label Use among Turkish Consumers.
International Journal of Humanities and Social Science, 2(7), 53-70.
Borooah, V.K. (2002). Logit and Probit. Compares Odds Ratios vs. Risk Ratios, Logit vs. Probit, Multinomial Logit, Step-by-step Approach to Procedures. Thousand Oaks, CA: Sage Publications.
Caswell, J.A. & Padberg, D.I. (1992). Toward a More Comprehensive Theory of Food Labels. American Journal of Agricultural Economics, 74(2), 460-468.
Food and Agricultural Organization (2005). African Development Indicator, FAO, Rome. Food Standards Agency (2010). Public Attitudes Towards, and Use of General Food
labelling. Available at http://multimedia.food.gov.uk/multimedia/pdfs/ labelevidressummary.pdf. Accessed on 12th December, 2013.
Grunert, K.G. & Wills, J.M. (2007). A Review of European Research on Consumer Response to Nutrition Information on Food Labels. Journal of Public Health, 15, 385-399.
Grunert, K.G., Fernandez-Celemin, L., Wills, J.M., Bonsmann, S.S.G. & Nureeva, L. (2010). Use and Understanding of Nutrition Information on Food Labels in Six European Countries. Journal of Public Health, 18(3), 261–277.
Jordan Lin, C.T., Lee, J.Y. & Yen, S.T. (2004). Do Dietary Intakes Affect Search for Nutrient Information on Food Labels? Social Science & Medicine, 59(9):1955-1967. Loureiro, M.L. & McCluskey, J.J. (2000). Assessing Consumer Response to Protected
Geographical Identification Labeling. Agribusiness, 16(3), 309-320.
McLean-Meyinsse, P.E. (2001). An Analysis of Nutritional Label Use in the Southern United States. Journal of Food Distribution Research, 32(1), 110-114.
Mhurchu, C.N. & Gorton, D. (2007). Nutrition Labels and Claims in New Zealand and Australia: A Review of Use and Understanding. Australian and New Zealand Journal of Public Health, 31(2), 105-112.
Nørgaard, M.K. & Brunsø, K. (2009). Families’ Use of Nutritional Information on Food Labels. Food Quality and Preference, 20, 597-606.
Ollberding, N.J., Wolf, R.L. & Contento, I. (2010). Food Label Use and its Relation to Dietary Intake among US Adults. Journal of the American Dietetic Association, 110(8),1233-1237.
Pampel, F.C. (2000). Logistic regression: A Primer. Sage Quantitative Applications in the Social Sciences Series #132. Thousand Oaks, CA: Sage Publications. pp. 54-68