Embryonic Lethality Due to Arrested Cardiac
Development in
Psip1/Hdgfrp2
Double-Deficient Mice
Hao Wang, Ming-Chieh Shun¤, Amy K. Dickson, Alan N. Engelman*
Department of Cancer Immunology and AIDS, Dana-Farber Cancer Institute and Department of Medicine, Harvard Medical School, Boston, Massachusetts, 02215, United States of America
¤ Current address: Department of Molecular Biology and Microbiology, Case Western Reserve University, Cleveland, Ohio, United States of America
Abstract
Hepatoma-derived growth factor (HDGF) related protein 2 (HRP2) and lens epithelium-derived growth factor (LEDGF)/p75 are closely related members of the HRP2 protein family. LEDGF/p75 has been implicated in numerous human pathologies including cancer, autoim-munity, and infectious disease. Knockout of thePsip1gene, which encodes for LEDGF/p75 and the shorter LEDGF/p52 isoform, was previously shown to cause perinatal lethality in mice. The function of HRP2 was by contrast largely unknown. To learn about the role of HRP2 in development, we knocked out theHdgfrp2gene, which encodes for HRP2, in both normal andPsip1knockout mice.Hdgfrp2knockout mice developed normally and were fertile. By contrast, the double deficient mice died at approximate embryonic day (E) 13.5. Histological examination revealed ventricular septal defect (VSD) associated with E14.5 double knockout embryos. To investigate the underlying molecular mechanism(s), RNA recovered from ventricular tissue was subjected to RNA-sequencing on the Illumina plat-form. Bioinformatic analysis revealed several genes and biological pathways that were sig-nificantly deregulated by thePsip1knockout and/orPsip1/Hdgfrp2double knockout. Among the dozen genes known to encode for LEDGF/p75 binding factors, only the expres-sion ofNova1, which encodes an RNA splicing factor, was significantly deregulated by the knockouts. However the expression of other RNA splicing factors, including the LEDGF/ p52-interacting protein ASF/SF2, was not significantly altered, indicating that deregulation of global RNA splicing was not a driving factor in the pathology of the VSD. Tumor growth factor (Tgf)β-signaling, which plays a key role in cardiac morphogenesis during develop-ment, was the only pathway significantly deregulated by the double knockout as compared to control andPsip1knockout samples. We accordingly speculate that deregulated Tgf-β signaling was a contributing factor to the VSD and prenatal lethality ofPsip1/Hdgfrp2 dou-ble-deficient mice.
OPEN ACCESS
Citation:Wang H, Shun M-C, Dickson AK, Engelman AN (2015) Embryonic Lethality Due to Arrested Cardiac Development inPsip1/Hdgfrp2
Double-Deficient Mice. PLoS ONE 10(9): e0137797. doi:10.1371/journal.pone.0137797
Editor:Eugene Yujun Xu, Nanjing Medical University, CHINA
Received:March 12, 2015
Accepted:August 20, 2015
Published:September 14, 2015
Copyright:© 2015 Wang et al. This is an open access article distributed under the terms of the Creative Commons Attribution License, which permits unrestricted use, distribution, and reproduction in any medium, provided the original author and source are credited.
Data Availability Statement:RNA-Seq data in BAM file format has been uploaded to the National Center for Biotechnology Information (NCBI) Sequence Read Archive (SRA) database (accessible athttp://www. ncbi.nlm.nih.gov/sra/). The data can be accessed using accession number PRJNA277775.
Introduction
Members of the hepatoma-derived growth factor (HDGF) related protein (HRP) family have been implicated in numerous human diseases including cancer, autoimmunity, and virus infec-tion [1,2]. The family consists of six members including HDGF, HRP1, HRP2, HRP3, and lens epithelium-derived growth factor (LEDGF)/p52 and LEDGF/p75, the latter two of which are expressed from the PC4 and SFRS1-interacting protein 1 (Psip1) gene as splice variants [3]. The most common feature among these proteins is an N-terminally situated PWWP (Pro-Trp-Trp-Pro) domain [4], which is a type of Tudor domain [5]. Two of the proteins, LEDGF/p75 and HRP2, contain a second evolutionarily conserved domain, which we previously termed the integrase-binding domain because it was both necessary and sufficient to convey binding to lentiviral integrase proteins [3,6,7]. LEDGF/p75, which is an important lentiviral integrase cofactor, helps to guide the integration of the viral reverse transcripts into the bodies of active genes (see [1] and [8] for review).
Despite possessing a functional integrase-binding domain [3], HRP2 unlike LEDGF/p75 does not appear under normal circumstances to play a role in lentiviral DNA integration. A subsidiary role for HRP2 in guiding human immunodeficiency virus type 1 (HIV-1) integra-tion to active genes was however uncovered by either knocking down [9] or knocking out [10] the expression of HRP2 inPsip1knockout cells that are completely devoid of LEDGF/p75 expression. Two differences between HRP2 and LEDGF/p75 are likely to contribute to the inability for HRP2 to contribute to viral DNA integration under normal circumstances. Firstly, whereas LEDGF/p75 associates with chromatin throughout the cell cycle [11–13], HRP2, though localized to the cell nucleus, does not associate with chromatin [13,14]. Secondly, the affinity of the HRP2-integrase interaction is lower than the affinity of the LEDGF/p75-inte-grase interaction [3,13].
We previously knocked outPsip1[15] andHdgfrp2(the gene that encodes for HRP2) [10] in mice to generate mouse embryo fibroblasts (MEFs) as cell models for HIV-1 infection. In this report we detail the phenotypes of the knockout animals. Bickmore and colleagues previ-ously described that the majority ofPsip1knockout mice generated via gene trap vector inser-tion died perinatally [16], a result recapitulated here through Cre/lox-mediated disruption of thePsip1gene. We additionally found thatPsip1/Hdgfrp2double deficient mice displayed a high rate of prenatal mortality, with the underlying pathology of ventricular septal defect (VSD) mapping to approximate embryonic day (E) 13.5. Illumina-based sequencing of RNA transcripts (RNA-Seq) derived from tissues ofPsip1knockout,Psip1/Hdgfrp2double knock-out, and littermate-matched control animals revealed genes and pathways that were deregu-lated by the double knockout including tumor growth factor (Tgf)-βsignaling, extracellular matrix (Ecm)-receptor interaction, and focal adhesion. Deregulation of these pathways may contribute to the VSD and the mortality of the mice.
Material and Methods
Knockout animals and MEF cells
The procedures used to generatePsip1,Hdgfrp2, andPsip1/Hdgfrp2knockout mice were described previously [10,15]. In brief, LEDGF/p75 expression was knocked out by deleting exon 3 of thePsip1gene, which is the second coding exon, using Cre/lox-mediated DNA recombination [15]. Embryonic stem (ES) cells that harbored the insertion of the pGT2lfx gene trap vector between exons 3 and 4 ofHdgfrp2were obtained from BayGenomics [10]. Chimeric animals obtained from implanting ES cells that were disrupted for either thePsip1orHdgfrp2 gene were backcrossed to C57BL/6 mice (Charles River Laboratories) to yield heterozygous
Psip1(+/-) andHdgfrp2(+/g) animals. The heterozygous mice were mated to yieldPsip1(-/-) knockout,Hdgfrp2(g/g) knockout, or heterozygous +-/g+ and +-/gg animals, the latter of which were further interbred to yield−−/gg double knockout animals [10]. The statistical
rele-vance of observed frequencies of mouse genotypes was assessed versus the expected Mendelian frequencies using the chi-square test.
The E9 and E13 sets of WT (++/+g),Psip1knockout (−−/+g), andPsip1/Hdgfrp2double
knockout (−−/gg) MEF cell lines were previously described [10].
PCR analysis of mouse genomic DNA
Genotyping was performed by Southern blotting and by PCR [10,15]. In brief, DNA prepared from mouse tissue using the QIAamp DNA micro kit (Qiagen) was PCR-amplified using prim-ers AE2331 and AE2802 to monitor the status of thePsip1gene [15] and primer pairs AE2511/ AE2512 and AE3747/AE3748 to monitor theHdgfrp2locus [10].S1 Tablelists the sequences of the PCR primers that were used in this study.
The sex-determining region Y (Sry) gene was amplified using primers AE6796/AE6797 and 50 ng genomic DNA under cycling conditions: 98°C for 5 min, followed by 30 cycles of 30 sec at 98°C, 30 sec at 56°C, 15 sec at 72°C, followed by a final 10-min extension at 72°C. The result-ing 273 bpSry-specific amplification product was visualized by staining with ethidium bromide following agarose gel electrophoresis.
Quantitative (q) RT-PCR
The concentration of RNA extracted from mouse tissue using the RNeasy Mini Kit (Qiagen) was determined by spectrophotometry. Duplicate qRT-PCR mixtures contained 0.5μM
prim-ers, 1×Quantitect SYBR green master mix, 0.3μl QuantiTect RT mix (QuantiTect Sybr Green
RT-PCR kit), and 25 ng of RNA.Psip1expression was monitored using primers AE2624/ AE2625, which anneal to exons 2 and 3 [15]. Primers AE3160/AE3161 were used to amplify Hdgfrp2exons 1/2 whereas downstream exon 5/7 sequences were amplified using primers AE2553/2554 [10]. Gene expression data were normalized toPpia, which encodes for cyclophi-lin A, using primers AE3664/AE3665 [10]. PCR cycling conditions were as described [10]. Sig-nificance between levels of gene expression was assessed by one-tailed t test.
RNA-Seq analysis
Embryo hearts were dissected from euthanized E14.5 animals, and the ventricular tissue was isolated from the atrial chambers. RNA extracted from the ventricles using the RNeasy kit was subjected to the RNA-Seq pipeline at the Center for Cancer Computational Biology (Dana-Far-ber Cancer Institute). RNA was analyzed for quality control using Qubit fluorometric quantita-tion (Life Technologies) and Bioanalyzer (Agilent Technologies). RNA (50–100 ng) was converted into DNA libraries using the NEBNext Ultra RNA Library Prep Kit for Illumina (New England Biolabs). The quality of the DNA libraries was assessed using the Qubit High Sensitivity DNA Kit (Life Technologies) and library size was determined using the Bioanalyzer High Sensitivity Chip Kit (Agilent Technologies). Libraries that passed quality control were diluted to 2 nM using sterile water and then sequenced on the MiSeq2000 platform (Illumina) at the concentration of 12 pM on a single read flowcell with 50 sequencing cycles.
Western blotting
protease inhibitor cocktail (Roche Diagnostics). The samples were subjected to sonication for 5 to 10 sec, followed by centrifugation at 16,000 g for 5 min at 4°C. The concentration of super-natant protein was determined using the Bio-Rad DC Protein Assay Kit, and 5μg was
fraction-ated through 8% polyacrylamide gels under denaturing conditions. Proteins transferred to poly (vinylidene difluoride) membrane were probed with anti-Smad2/3 antibodies (Cell Signaling) at 1:1,000 dilution. Primary antibody binding was visualized using horseradish peroxidase-con-jugated rabbit anti-mouse antibodies (Dako Scientific) and enhanced chemiluminescence (Thermo Scientific). Membranes were reprobed with horseradish peroxidase-conjugated anti-body againstβ-actin (1:10,000 dilution, Cell Signaling) to control for the amount of protein loaded onto the gels. Membranes were imaged on a ChemiDoc MP imager (Bio-Rad) and sig-nals were quantified using Image Lab 4.1 software.
Bioinformatics and statistical analyses
Sequence reads were mapped toMus musculusreference genome mm9 (build name NCBIM 37) using TopHat [17]. HTSeq was used to map the reads to each gene from the alignment BAM file [18]. EdgeR was used to analyze differential gene expression [19]. Read counts from triplicate RNA samples were first normalized to library size, then relatively low expressed genes were filtered out by using the threshold setting of one read per kb per million reads (RPKM). Testing for differentially expressed genes was based on a negative binomial model. Significant differential expression was filtered using a false discovery rate of<0.05. The top
20 differentially expressed genes were additionally sorted byPvalue.
To analyze gene ontology, the differentially expressed genes identified using EdgeR were processed by the online tool provided bywww.biomart.com. Gene set and pathway analysis was performed using the Generally Applicable Gene-set Enrichment (GAGE) [20] package and the results were presented in KEGG pathway [21,22]. Significantly regulated pathways were fil-tered using a q value of<0.1. Pathview [23] was utilized to visualize results as indicated.
Histological analysis of mouse tissue
Mouse tissue was fixed in Bouin’s fixative (Sigma-Aldrich). Tissues were embedded in paraffin, sectioned at 6μm, stained with hematoxylin/eosin, and analyzed by light microscopy at the
Rodent Histopathology Core at Harvard Medical School.
Ethics statement
This study was carried out under strict supervision of the Beth Israel Deaconess Medical Center (BIDMC) Institutional Animal Care and Use Committee (IACUC) under guidelines set forth by the United States Department of Agriculture (USDA) and US Public Health Service (PHS) Office of Lab Animal Welfare (OLAW). The BIDMC IACUC, which is accredited by the Asso-ciation for Assessment and Accreditation of Laboratory Animal Care (approval date March 25, 2014) and US PHS Assurance code A3153-01 (expiration date February 28, 2018), approved this study as part of animal protocol number 038–2012 (“Breeding LEDGF and HRP2 knock-out mice”).
Mice were identified using ear punches and the universal mouse numbering system in accordance with Institutional and Federal guidelines. Tips (2–4 mm) of mice tails were snipped for genotyping purposes using an extremely sharp blade (scalpel or razor blade), and hemosta-sis was performed before returning the animals to cages to minimize any associated discomfort. Pregnant mothers were euthanized by CO2inhalation for 10 min using a smart box chamber
Results and Discussion
Generation of knockout mice
Several strains of mutant mice were generated to investigate the roles ofPsip1andHdgfrp2in mouse development.Psip1was knocked out using Cre/lox DNA recombination [15] and Hdgfrp2was disrupted by gene trap insertion [10]. Heterozygous animals (+/- forPsip1; +/g forHdgfrp2) were then interbred to generatePsip1/Hdgfrp2double knockout animals. Because Hdgfrp2(g/g) knockout animals reached adulthood (see below) and were fertile, +-/+g hetero-zygous animals were mated to +-/ggHdgfrp2knockout animals to increase the theoretical frequency of double knockout production from 6.25% to 12.5% of offspring. All animals gener-ated from the double knockout mating scheme were therefore eitherHdgfrp2(+/g) orHdgfrp2 (g/g).
The genotypes of knockout animals were monitored using PCR and Southern blotting whereas gene expression profiles were monitored by qRT-PCR and western blotting [10,15]. Examples of these measurements for animals generated by the double knockout mating scheme are presented inS1A–S1C Fig. Two sets of qRT-PCR primers were used to monitorHdgfrp2 expression: exon 1/2-specific primers detected sequences upstream from the gene trap inser-tion, whereas exon 5/7 primers monitored expression downstream from the insertion. The gene trap vector reduced the expression level of exon 1/2-containing sequences approximately 5 fold relative to a ++/+g littermate-matched control animal, whereas exon 5/7-contaning sequences were further reduced, to about 15-to-25 fold, compared to the control. The level of Hdgfrp2expression was by contrast unaffected byPsip1knockout in the +/g background (S1B Fig).Psip1knockout reduced the level of LEDGF/p75 mRNA between 300 and 1000 fold, whereasPsip1heterozygosity (+/-) yielded an approximate 2-fold reduction in message (S1C Fig). The strength of gene trap knockout depends on the position of vector integration in the mouse genome [24,25] and we accordingly expect that this parameter impacted the magnitude of theHdgfrp2mRNA reduction as compared to the more potent reduction inPsip1message that was achieved through Cre/lox-mediated DNA deletion (S1 Fig) [10]. Western blot analysis confirmed the lack of detectable HRP2 and LEDGF/p75 protein expression in MEF cells iso-lated fromPsip1/Hdgfrp2double-deficient animals [10].
Phenotypic characterization of knockout animals
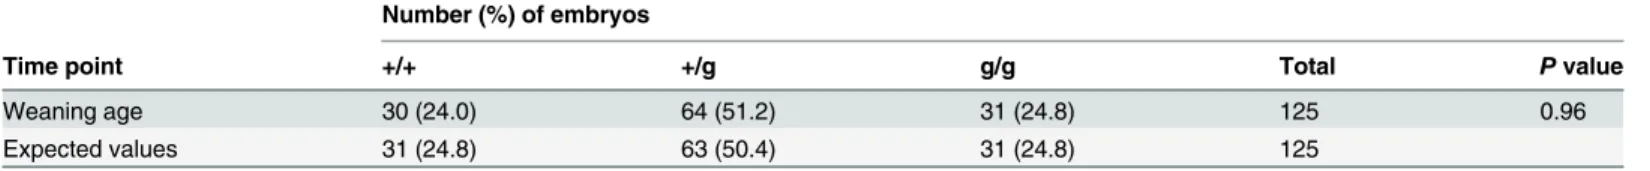
To ascertain the affect of gene knockout on mouse development, offspring of timed heterozy-gous animal matings were genotyped at various time points before and/or after birth. The monitoring of 125 animals at weaning age (21 days post-birth) revealed no affect from the Hdgfrp2knockout on development, as the frequency of the three expected genotypes (+/+, +/g, and g/g) were indistinguishable from the predicted Mendelian frequencies of 1:2:1 (Table 1, P= 0.96).Hdgfrp2knockout mice appeared physically normal and were fertile. The 16-exon Hdgfrp2gene yields three mRNA isoforms that differ in the extent of exon 3 and 4 or exon 7 content [26]. The expression of all three isoforms is predictably disrupted by the utilized gene trap vector, which was inserted within the large intron between exons 3 and 4 [10,26]. We note that mice knocked out for the namesake member of the HRP gene family,Hdgf, were like-wise phenotypically normal [27].
DNA deletion was not grossly deleterious to mouse embryogenesis. By contrast, only four of 302 animals reached the weaning age of 21 days (Table 2), a phenotype that is fully consistent with the perinatal lethality observed with gene trap knockout animals [16]. Histological charac-terization of surviving knockout mice revealed minor skeletal alterations consistent with those reported by Bickmore and colleagues (data not shown) [16]. Additional detailed histopathol-ogy of ourPsip1knockout animals was accordingly not performed. Due to deletion of proximal exon 3 from thePsip1gene, we note that our genetically null animals, similar to those gener-ated by the previously described gene trap insertion, were defective for expressing both LEDGF (p52 and p75) isoforms [15,16].
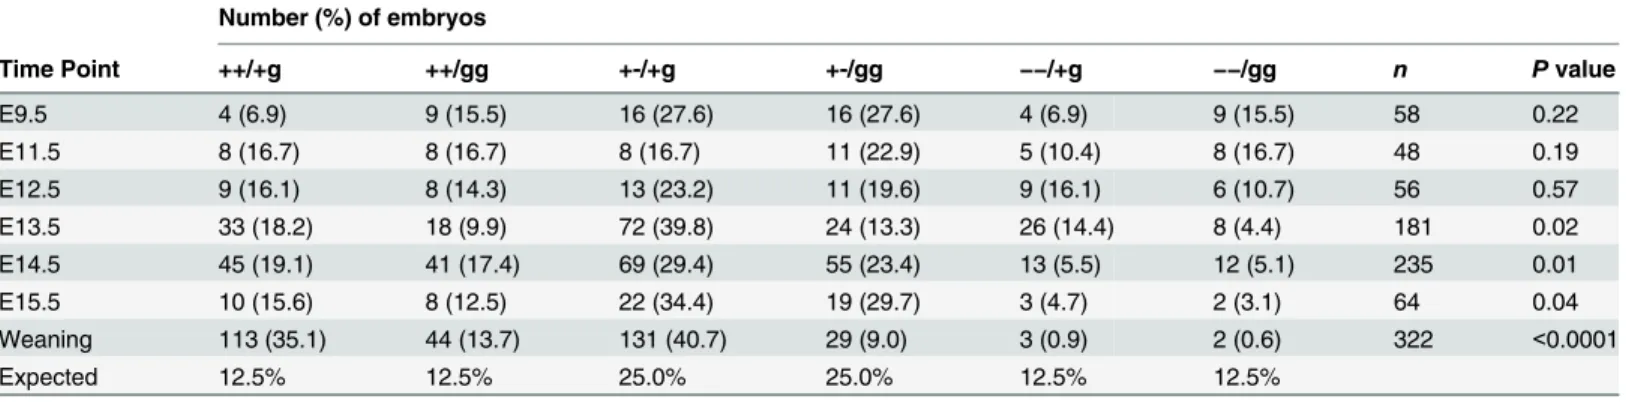
Due to the perinatal lethality associated withPsip1knockout, we expected few if anyPsip1/ Hdgfrp2double knockout animals to survive to 21 days of age. Indeed, out of 322 animals, only two were genotyped as double knockout (Table 3). To ascertain when double knockout animals succumbed during development, embryos were genotyped at several time points. The percent-age of double knockout animals recovered at E9.5, E11.5 and E12.5 did not significantly differ from the predicted Mendelian frequency of 12.5% (Table 3). By contrast, far fewer animals than predicted were recovered at E13.5, E14.5, and E15.5. Therefore, unlike the consequence from the sole knockout ofPsip1[16] (Table 2),Psip1/Hdgfrp2double knockout animals suc-cumbed during embryogenesis, at approximately E13.5.
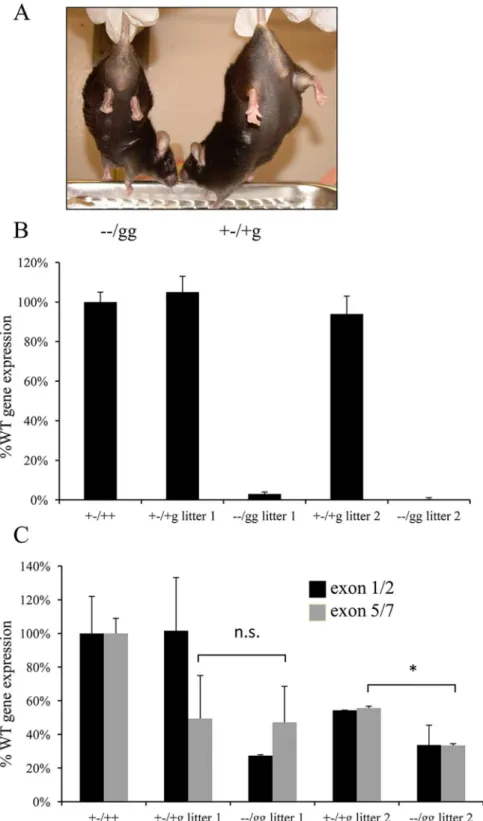
TwoPsip1/Hdgfrp2double knockout mice notably survived to adulthood (Table 3). Both animals had obvious retarded movement (not shown) and the tendency to clench their hind limbs to their bodies (Fig 1A), phenotypes similar to those previously reported forPsip1 knock-out animals [16]. To test if these animals harboredPsip1and/orHdgfrp2expression profiles that differed from those expected from dual knockout deficiency (S1 Fig), mRNA prepared from blood was compared to samples isolated from littermate matched +-/+g animals by qRT-PCR. As expected from the stable nature of DNA deletion, thePsip1gene expression pro-files of these double knockout animals were decreased in comparison to the controls (Fig 1B). As previously noted, the expression ofHdgfrp2sequences downstream from the gene trap insertion in heterozygous (+-/+g) control animals, which was detected using exon 5/7-specific primers, was reduced by approximately twofold as compared to mRNA isolated from a Hdgfrp2+/+ control [10] (Fig 1C). TheHdgfrp2expression patterns of the double deficient
Table 1. Genotypes of offspring from timed matings ofHdgfrp2heterozygous (+/g) animals.
Number (%) of embryos
Time point +/+ +/g g/g Total Pvalue
Weaning age 30 (24.0) 64 (51.2) 31 (24.8) 125 0.96
Expected values 31 (24.8) 63 (50.4) 31 (24.8) 125
doi:10.1371/journal.pone.0137797.t001
Table 2. Genotypes of offspring from timed matings ofPsip1heterozygous (+/-) animals.
Number (%) of embryos
Time point +/+ +/- -/- Total Pvalue
E13.5 2 (8.0) 10 (40.0) 13 (52.0) 25 <0.0001
E15.5 6 (35.3) 8 (47.1) 3 (17.6) 17 0.51
E17.5 3 (27.3) 4 (36.4) 4 (36.4) 11 0.61
Weaning age 113 (37.4) 185 (61.3) 4 (1.3) 302 <0.0001
Expected values 25% 50% 25%
animals differed greatly from those expected from the g/g knockout (compareFig 1CwithS1B Fig). The levels of exon 5/7-containing mRNA in the litter 1−−/gg animal was not significantly
different from its +-/+g sibling, whereas in the litter 2 animal this level was reduced<2-fold
from the matched sibling. Although this difference was statistically significant, the level of Hdgfrp2message distal from the gene trap in both double knockout animals matched or exceeded the level detected using upstream exon 1/2 primers (Fig 1C). We therefore suspect that mRNA read-through of the gene trap vector contributed to the survival of these two ani-mals. The results of PCR analysis revealed that each surviving animal retained the integrated gene trap vector (not shown). Read through of the gene trap vector effectively converted the phenotype of these two animals to that of survivingPsip1knockout mice.
Abnormal cardiac morphogenesis in
Psip1
/
Hdgfrp2
knockout mice
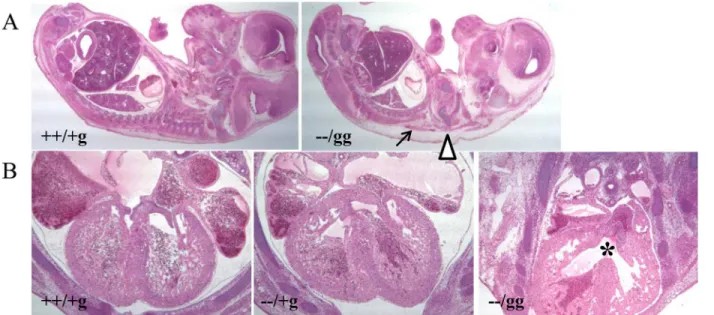
E14.5 embryos were histologically analyzed to investigate gross developmental defects associ-ated with the double knockout. Serial sagittal dissection revealed subcutaneous edema and hemorrhage compared to ++/+g control animals (Fig 2A). Generalized edema is often a sign of failure in the circulatory system due to cardiac defects [28,29]. Consistent with this, serial transverse sections demonstrated the consistent presence of VSD in double knockout but not in matched ++/+g control orPsip1(−−/+g) knockout animals (Fig 2B). The structures of thegreat aorta and pulmonary arteries by contrast appeared normal in the double knockout embryos (data not shown). The structures of other organs, such as brain, lung, liver, kidney, and intestines, also appeared normal in the double knockout animals (Fig 2A).
Transcriptional profiling of
Psip1
and
Psip1
/
Hdgfrp2
knockout mice
To probe the molecular mechanisms that underlie the mouse knockout phenotypes, RNA extracted from heart ventricle tissue of E14.5 control ++/+g,Psip1(−−/+g) knockout, anddouble knockout embryos was subjected to RNA-Seq. The utilization of tissue from three independent sets of littermate-matched dissections afforded data filtration for biological reproducibility.
A total of 12,306 protein-coding genes was detected by RNA-Seq analysis. The parsing of data in pairwise combinations revealedPsip1as a driving force behind differential gene expression. As shown inTable 4, 399 differentially expressed genes were determined by com-paring thePsip1knockout and ++/+g control samples (186 up-regulated and 213 down-regu-lated genes), whereas 406 genes between the double knockout and control samples were differentially expressed. Because comparing the knockout samples to each other yielded 37
Table 3. Genotypes of offspring from timed matings ofPsip1/Hdgfrp2+-/+g and +-/gg animals.
Number (%) of embryos
Time Point ++/+g ++/gg +-/+g +-/gg −−/+g −−/gg n Pvalue
E9.5 4 (6.9) 9 (15.5) 16 (27.6) 16 (27.6) 4 (6.9) 9 (15.5) 58 0.22
E11.5 8 (16.7) 8 (16.7) 8 (16.7) 11 (22.9) 5 (10.4) 8 (16.7) 48 0.19
E12.5 9 (16.1) 8 (14.3) 13 (23.2) 11 (19.6) 9 (16.1) 6 (10.7) 56 0.57
E13.5 33 (18.2) 18 (9.9) 72 (39.8) 24 (13.3) 26 (14.4) 8 (4.4) 181 0.02
E14.5 45 (19.1) 41 (17.4) 69 (29.4) 55 (23.4) 13 (5.5) 12 (5.1) 235 0.01
E15.5 10 (15.6) 8 (12.5) 22 (34.4) 19 (29.7) 3 (4.7) 2 (3.1) 64 0.04
Weaning 113 (35.1) 44 (13.7) 131 (40.7) 29 (9.0) 3 (0.9) 2 (0.6) 322 <0.0001
Expected 12.5% 12.5% 25.0% 25.0% 12.5% 12.5%
Fig 1. Phenotypic analysis of survivingPsip1/Hdgfrp2knockout mice.(A) The−−/gg mouse on the left,
as compared to the littermate-matched heterozygous animal, revealed the tendency to clench its hind limbs. (B) Analysis ofPsip1expression levels by qRT-PCR. (C) Levels ofHdgfrp2expression upstream and downstream from the gene trap insertion were detected by qRT-PCR using exon 1/2- and exon 5/7-specific primers, respectively. Heterozygous +-/+g littermate control animals for the two knockout animals (litter 1 and litter 2) and RNA from an unrelatedPsip1heterozygous (+-/++) animal [15] served as controls in panels B and C. Panels B and C data are averages and standard deviation derived from three independent experiments. n.s., not significant;*,P<0.05.
differentially expressed genes, the two knockout samples contained many genes in common
(Fig 3). Heat map representation of the genes that were up- and down-regulated for each of the
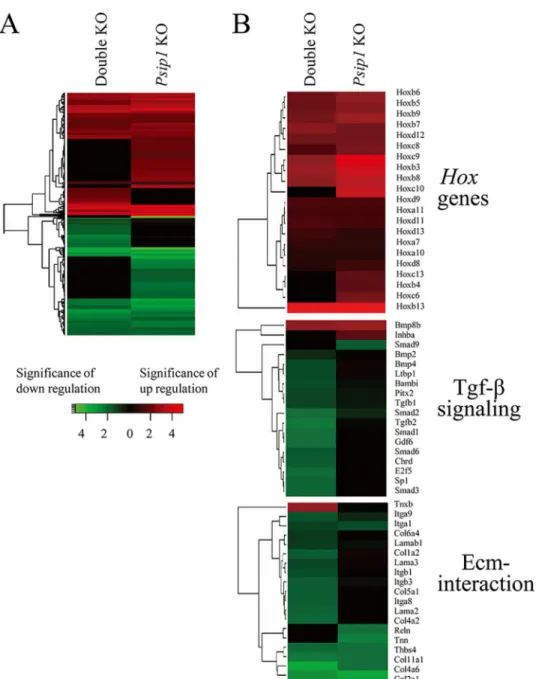
knockout conditions versus the ++/+g control highlighted several regions of overly similar dif-ferential gene expression patterns for thePsip1and double knockout animals (Fig 4A).
We next examined the top 20 most highly deregulated genes from the above noted pairwise comparisons (S2–S4Tables). The expression levels ofPsip1andHdgfrp2were deregulated as expected from these comparisons. For example,Psip1expression was depressed about 12-fold from the control in both thePsip1knockout (not listed inS2 Tablebecause it was not among the top 20 genes) and double knockout (S3 Table) samples. Similarly,Hdgfrp2expression was deregulated about 19-fold between thePsip1and double knockout samples (S4 Table). As anticipated from the results inTable 4andFig 3, several of the top 20 deregulated genes were identified in more than one pairwise comparison. For example, the expression levels ofSlnf2 andSp100were up-regulated similarly from the comparison ofPsip1knockout or double knockout tissue to the control sample, indicating that thePsip1deficiency was the likely driving factor in these expression profiles. The expression levels of several genes, includingDdx3y, Kdm5d,Uty,Eif2s3y,Prkcq,Alx1,Enpep,Chrdl1,Rspo1, andTmtc1were moreover down-regu-lated in more than one pairwise comparison.
Fig 2. Histological analysis of control and knockout mice.(A) Sagittal section of E14.5 embryos (20X magnification). The gross morphological structures of brain, lung, liver, kidney, intestines, and other organs appeared similar between−−/gg knockout animals and littermate matched ++/+g controls (n of 4 for
each genotype). Subcutaneous edema and hemorrhage in the knockout animal are marked by triangle and arrow, respectively. (B) Transverse section of littermate matched control ++/+g (left panel),Psip1knockout (central panel), and−−/gg double knockout (right panel) E14.5 animals (40X magnification).
Normal, septated ventricles are evident in the central regions of the left and middle panels. Double knockout animals (four out of 4 analyzed) by contrast presented VSD (highlighted by an asterisk).
doi:10.1371/journal.pone.0137797.g002
Table 4. Numbers of differentially expressed genes between samples.
Comparison Total genes Up-regulated Down-regulated
Psip1KO to ++/+g 399 186 213
Double KO to ++/+g 406 236 170
Psip1KO to double KO 37 19 18
Xist, which plays a key role in chromosome X inactivation in mammalian somatic cells [30], was significantly upregulated by thePsip1knockout whereasDdx3y,Kdm5d,Uty,Eif2s3y, each of which resides on the Y chromosome, were down-regulated significantly (S2andS4Tables). We accordingly wondered if thePsip1or double knockout influenced the sex of surviving ani-mals. To address this five different aliquots of DNA prepared from WT,Psip1knockout, and double knockout heart tissue and MEF cells were monitored for the presence of the Y chromo-some-specific sex-determining region Y (Sry) gene. Because the male-to-female ratios across all three sets of samples were 3:2 (data not shown), we conclude that, given these somewhat modest sample sizes, neither thePsip1norPsip1/Hdgfrp2knockout significantly influenced animal gender. ThePsip1knockout samples subjected to RNA-Seq were derived from one male and two female embryos, while the double knockout and WT control (++/+g) samples were each derived from two male and one female animal. We accordingly suspect that this accounts for the significant levels of deregulated X- and Y-chromosome genes observed in the Psip1versus double knockout or WT pairwise combinations (S2–S4Tables).
Fig 3. Numbers of common genes that are deregulated byPsip1andPsip1/Hdgfrp2knockout.(A) Venn diagram of genes up-regulated by the indicated knockout (KO) showing the overlap between conditions. The data is fromTable 4. (B) Same as in (A), but for down regulated genes.
Numerous cellular proteins, including Jpo2 [31,32], Pogz [33], Menin [34], Dbf4/Ask [35], Mll [36], and Iws1 [37] interact with LEDGF/p75 through the integrase-binding domain while other factors, including Tox4, Nova1, Mcm7, C3orf59, and Map1a, interact with the PWWP domain that is in common to both LEDGF/p75 and LEDGF/p52 [38]. The genes that encode
Fig 4. Heat maps of differentially expressed genes by pairwise comparison of knockout versus control samples.(A) Colors indicate the significance of fold change (log2) values in gene count level. Each row represents a gene, and each column represents the indicated comparison. Red indicates relative degree of significance of up-regulation, and green relative significance of down-regulation. Genes that failed to achieve significant levels of deregulation versus the ++/+g control were scored as zero and appear as black. (B) Differential expression patterns ofHoxgenes (upper panel) as well as genes involved in Tfg-βsignaling (central panel) and the Ecm-interaction pathway (lower panel). The data were dissected out from the total gene expression profiles in panel A. KO, knockout.
known LEDGF-interacting proteins were queried to ascertain if either thePsip1knockout or Psip1/Hdgfrp2double knockout altered their expression levels in embryonic heart tissue. Nova1, whose expression was up-regulated approximately threefold by both knockout condi-tions, was the only gene among this set that scored as significantly deregulated (S5 Table). Because Nova1 is an RNA splicing factor, the expression levels of 138 additional genes that were identified from using the gene ontology search term“mRNA splicing, via spliceosome”, which included theSfrs1gene that encodes for the LEDGF/p52-interacting protein ASF/SF2 (see below), were queried. The only other gene with deregulated expression among the expanded set of RNA splicing factors wasPsip1.
RT-PCR was utilized to confirm the expression profiles of a subset of genes that were deter-mined as differentially regulated by RNA-Seq. For example, significant up-regulation ofSlfn expression was confirmed in both thePsip1and double knockout samples (about 11-fold in each), though these values were tampered somewhat from the approximate 48- and 18-fold lev-els of up-regulation determined by RNA-Seq for thePsip1knockout and double knockout sam-ples, respectively (S2andS3Tables). Extending this analysis to a set of seven genes that were deregulated to milder levels (from ~20% to 5-fold;S2A Fig) confirmed the deregulated gene expression profiles that were detected by RNA-Seq (S2 Fig, compare panels A and B).
Bickmore and colleagues previously noted thatPsip1knockout significantly deregulated the expression of numerous homeobox (Hox) genes [16,39], a result that was generally confirmed here (S2andS6Tables;Fig 4B). The expression of theHoxb13gene was most significantly up-regulated, by ~300 to 400-fold, by bothPsip1knockout and double knockout when compared to matched ++/+g controls. The expression levels ofHoxa1andHoxa3, which from the RNA-Seq analysis were not significantly deregulated by the knockouts, as well asHoxb3andHoxc9, which were up-regulated by ~7 to 17-fold (S6 Table), were queried by qRT-PCR. For this anal-ysis, RNA derived from embryonic head and limb tissue was additionally compared to heart-derived RNA. While the expression levels ofHoxa1andHoxa3were not significantly altered by the knockouts, the expression levels ofHoxb3andHoxc9were significantly up-regulated, by ~4 to 10-fold, in all tissues examined from knockout animals (S3A Fig). We also confirmed sig-nificant levels of up-regulation ofHoxb3andHoxb13expression in MEF cells derived from Psip1and double knockout animals (S3B Fig).
Gene ontology and pathway analyses of differentially expressed genes
Ontology term analysis of the genes that were differentially expressed between the double knockout and control samples revealed statistically significant differences in anatomical struc-ture development, cell differentiation, proteinaceous Ecm, extracelluar region, and cellTable 5. Significantly deregulated metabolic pathways across samples.
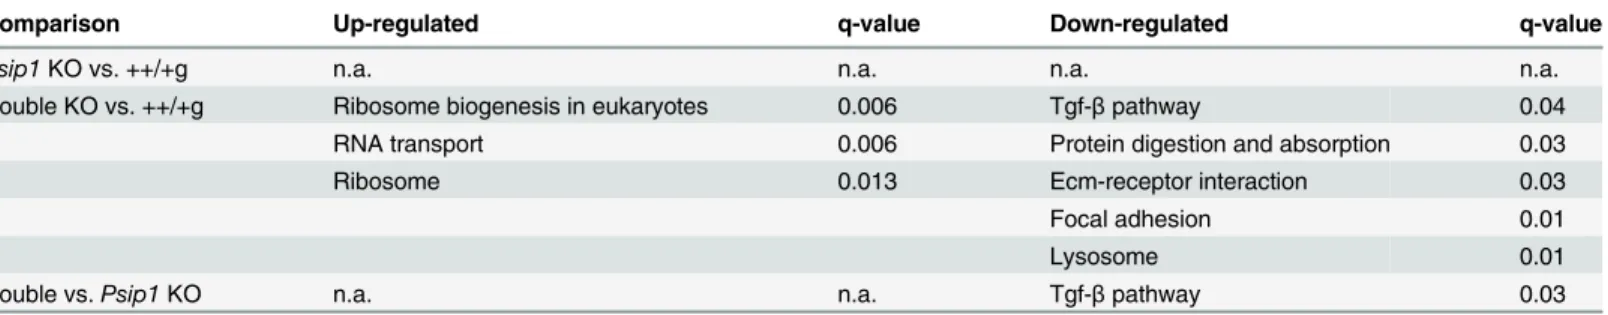
Comparison Up-regulated q-value Down-regulated q-value
Psip1KO vs. ++/+g n.a. n.a. n.a. n.a.
Double KO vs. ++/+g Ribosome biogenesis in eukaryotes 0.006 Tgf-βpathway 0.04
RNA transport 0.006 Protein digestion and absorption 0.03
Ribosome 0.013 Ecm-receptor interaction 0.03
Focal adhesion 0.01
Lysosome 0.01
Double vs.Psip1KO n.a. n.a. Tgf-βpathway 0.03
KO, knockout; n.a., not applicable.
adhesion (S4A Fig). For the comparison betweenPsip1knockout and control, proteinaceous Ecm, extracelluar region, cell adhesion, extracellular space, and nucleic acid binding transcrip-tion factor activity were significantly enriched among the differentially expressed genes (S4B Fig).
The GAGE R package was utilized to analyze gene set and KEGG pathways taking into account all differentially expressed genes and the associated fold change values [20]. Signifi-cantly regulated KEGG pathways (q-value<0.1) are reported inTable 5. The comparison of
Psip1knockout and control ++/+g samples did not yield a significantly regulated pathway. By contrast, several pathways emerged from comparing the double knockout and control samples: ribosome, ribosome biogenesis in eukaryotes, and RNA transport were up-regulated, whereas Tgf-βsignaling, protein digestion and absorption, focal adhesion, Ecm-receptor interaction, and lysosome were down regulated. Comparing the double knockout andPsip1knockout sam-ples yielded the sole down regulated pathway of Tgf-βsignaling (Table 5).
The Tgf-βsignaling pathway regulates different processes related to cardiovascular biology, including cardiac development and angiogenesis [40,41]. Knockout of theTgfb1gene is embryonic lethal to mice due to inflammation of the heart and lungs [40,42] andTgfb2 knock-out is embryonic lethal due in part to VSD, myocardial thinning, and a double knock-outlet right ven-tricle [43]. Pathview visualization revealed significant deregulation of several key genes in the Tgf-βsignaling pathway includingTgfb1,Bmp[44],Activin[45], andSmad[46] (S5 Fig). To confirm these results,Tgfb1andSmad1expression levels were analyzed by qRT-PCR utilizing RNA extracted from embryonic head, limb, and heart tissues. The expression level ofTgfb1 was significantly down regulated across the tissues derived from double knockout animals, whileSmad1expression was significantly down regulated in head and in heart tissue (Fig 5A). Western blot analysis confirmed lower levels of Smad2/3 protein expression in the tissues derived from the double knockout as compared toPsip1knockout and control animals (Fig 5B and 5C).
Heart development depends on the interaction between integrins in cardiomyocytes with the surrounding Ecm [47] and Tgf-βsignaling influences the expression of several integrins [48–50] and the production of the Ecm [51]. The knockout ofβ1 integrin moreover resulted in embryonic lethality with associated cardiac defects [52–54]. We accordingly speculate that down-regulation of the Ecm receptor interaction pathway could result from the down-regula-tion of the TGF-βsignaling pathway. Focal adhesion kinase (FAK) is a key downstream media-tor of Ecm-integrin signaling [55] and FAK knockout mice die within hours of birth due to incomplete formation of the septum between the ventricles and overriding aorta [56]. Down regulation of the focal adhesion pathway in our embryonic tissue samples is consistent with a role for TGF-βsignaling in the underlying cardiac pathology and prenatal lethality of the dou-ble knockoutPsip1/Hdgfrp2mice.
The transcriptional activities of Hox proteins can be regulated by Smads [57]. Group 13 Hox proteins Hoxa13 and Hoxd13 in particular were reported to interact with Smad5 and repressed Smad-mediated transcriptional activation [58]. Although this prior study did not study Hoxb13, it is tempting to speculate that the significant up-regulation of Hoxb13 observed here could have negatively impactedSmadgene expression and Tgf-βsignaling. If true, other factors, which would be attributable to theHdgfrp2knockout, must contribute to the VSD, as the Tfg-βsignaling pathway was not deregulated through solePsip1knockout (Table 5) yet kDa are indicated to the left;β-actin was blotted as a protein loading control. (C) Quantification of Smad2/3 proteins normalized forβ-actin content for n = 3 independent experiments (average and standard deviation). *,P<0.05;**,P<0.01.
Hoxb13expression was similarly up-regulated under both knockout conditions (S6 Tableand
S3B Fig).
LEDGF/p52 can interact with the mRNA splicing factor ASF/SF2 (the product of theSfrs1 gene) and modulate its activity [59,60], and ASF/SF2 has been identified as a key participant in regulated postnatal heart remodeling in mice [61]. To ascertain ifPsip1knockout resulted in differential mRNA splicing in heart tissue, the RNA-Seq data was analyzed using multivariate analysis of transcript splicing (MATS) [62]. No significant alternative splicing events were detected by comparing thePsip1knockout and ++/+g control datasets. Comparing the double knockout and control samples yielded five alternative splicing events (S7 Table). The expres-sion level of theSfrs1gene, which encodes for ASF/SF2, was not significantly deregulated in Psip1knockout (P= 0.64) orPsip1/Hdgfrp2double knockout (P= 0.69) embryonic ventricular tissue compared to the matched ++/+g control samples (S5 Table). Although we cannot rule out a role for mRNA splicing in the VSD, the lack of significant deregulation of RNA splicing factor gene expression, which was detected for onlyNova1andPsip1among a set of 139 genes, leads us to believe that differential splicing was not a driving factor in the underlying pathology of VSD.
Conclusions
Our genetically nullPsip1knockout mice phenocopied the perinatal lethality previously reported using gene trap vector insertion [16]. While knockout of the related HRP2 protein product did not detectably influence mouse development,Psip1/Hdgfrp2double deficiency resulted in embryonic lethality at approximate E13.5 with associated VSD. RNA-Seq analysis revealed significant deregulation of the Tgf-βsignaling pathway as well as deregulation of downstream Ecm-interaction and focal adhesion pathways in the tissue of double knockout animals. The expression levels of genes that encode for key LEDGF/p75 interacting proteins, such as Menin and Mll, were not altered by the knockouts described here. Though the expres-sion level of theNova1gene, which encodes for an RNA splicing factor that interacts with LEDGF/p75, was up-regulated, the expression levels of genes that encode for other RNA splic-ing factors, includsplic-ing the key LEDGF/p52 interactor ASF/SF2, were not altered significantly. We conclude that the deregulation the Tgf-βsignaling pathway was a likely contributing factor to abnormal cardiac morphogenesis and prenatal mortality of thePsip1/Hdgfrp2 double-defi-cient mice.
Supporting Information
S1 Fig. Genotypic and phenotypic characterization of animals generated during the double knockout mating scheme.(A) Genomic DNA from tails of mouse embryos were subjected to PCR using the indicated primer pairs. Primers AE2331 and AE2802 detect a 803 bp product from wild-typePsip1DNA whereas exon 3 deletion yields a 324 bp fragment [15]. The 535 bp Hdgfrp2product (primers AE2511, AE2512) is disrupted by gene trap insertion; primers AE3747 and AE3748, specific for the pGT2lfx vector, detect a 433 bp product in all cell types [10]. The migration positions of expected DNA products in bp and of mass standards in kb are shown to the left and right sides of the gels, respectively. DNA was detected by ethidium bro-mide staining. (B) Phenotypic characterization ofHdgfrp2mRNA expression levels using the indicated primer pairs.Pvalues from the indicated comparisons of expression levels are shown. (C)Psip1mRNA expression levels. The data in panels B and C are averages and stan-dard deviation of three independent experiments, with qRT-PCR samples conducted in dupli-cate for each experiment.
S2 Fig. RT-PCR analysis of a subset of genes that were detected by RNA-Seq as differen-tially regulated byPsip1and/orPsip1/Hdgfrp2knockout.(A) RNA-Seq data expressed as log2fold changes in mRNA expression levels with associatedPvalues for the seven indicated
genes. (B) Results from qRT-PCR analysis (average and standard deviation from three inde-pendent sets of qRT-PCR measurements). The levels of gene expression in the double knock-out samples in panel B were statistically different (P<0.05) from the matched ++/+g controls
for all seven genes whereas the levels of expression of only two genes in thePsip1knockout samples, Integrinα1 and Caveolin 2, achieved significance versus the controls. n.s., not signifi-cant (control versusPsip1knockout comparison).
(PDF)
S3 Fig. RT-PCR analysis ofHoxgene expression.(A) Results from qRT-PCR analysis of the indicatedHoxgenes in different embryonic tissue (average and standard deviation from two independent sets of qRT-PCR measurements).Hoxb3andHoxc9gene expression levels in the double knockout andPsip1knockout samples were statistically different from the matched + +/+g controls across tissues, whileHoxa1andHoxa3gene expression levels were not. (B) Lev-els ofHoxb3andHoxb13expression inPsip1andPsip1/Hdgfrp2knockout MEFs. The expres-sion of bothHoxb3andHoxb13was significantly up-regulated (average and standard deviation from two independent sets of qRT-PCR measures).,P<0.01.
(PDF)
S4 Fig. Enriched gene ontology terms between expression patterns in control and knockout ventricular tissue.(A) Comparison of double knockout (−−/gg) versus control samples. (B)
Psip1knockout versus control. (PDF)
S5 Fig. KEGG analysis of differential gene expression in the Tgf-βsignaling pathway.The data is from the comparison of double knockout and ++/+g control samples. Symbol codes: +p, phosphorylation;-p, dephosphorylation; +u, ubiquitination;!o!, activation;–|o!,
repression. Dashed lines indicate indirect effects. The heat map key indicates relative degrees of significance in levels of transcriptional down-regulation (green) and up-regulation (red). (PDF)
S1 Table. Sequences of PCR primers. (PDF)
S2 Table. Top 20 differentially expressed genes comparingPsip1knockout to control ++/+g tissue.
(PDF)
S3 Table. Top 20 differentially expressed genes comparingPsip1/Hdgfrp2knockout to con-trol ++/+g tissue.
(PDF)
S4 Table. Top 20 differentially expressed genes comparingPsip1knockout toPsip1/ Hdgfrp2knockout tissue.
(PDF)
S5 Table. Gene expression profiles of LEDGF interacting proteins vs. ++/+g control. (PDF)
S7 Table. Alternatively spliced genes in double knockout versus control ++/+g samples. (PDF)
Acknowledgments
The generation and characterization of knockout mice spanned multiple years and we accord-ingly thank the efforts of past Engelman laboratory members Janet Daigle and Jiyong Lee for their efforts in mouse colony management and maintenance. We also thank Roderick Bronson of the Rodent Histopathology Core at Harvard Medical School for valuable discussion.
Author Contributions
Conceived and designed the experiments: HW M-CS ANE. Performed the experiments: HW M-CS AKD. Analyzed the data: HW M-CS AKD ANE. Wrote the paper: HW ANE.
References
1. Llano M, Morrison J, Poeschla EM. Virological and cellular roles of the transcriptional coactivator LEDGF/p75. Curr Top Microbiol Immunol. 2009; 339:125–146. doi:10.1007/978-3-642-02175-6_7
PMID:20012527
2. Bao C, Wang J, Ma W, Wang X, Cheng Y. HDGF: a novel jack-of-all-trades in cancer. Future Oncol. 2014; 10(16):2675–2685. doi:10.2217/fon.14.194PMID:25236340
3. Cherepanov P, Devroe E, Silver PA, Engelman A. Identification of an evolutionarily conserved domain in human lens epithelium-derived growth factor/transcriptional co-activator p75 (LEDGF/p75) that binds HIV-1 integrase. J Biol Chem. 2004; 279(47):48883–48892. doi:10.1074/jbc.M406307200PMID:
15371438
4. Izumoto Y, Kuroda T, Harada H, Kishimoto T, Nakamura H. Hepatoma-derived growth factor belongs to a gene family in mice showing significant homology in the amino terminus. Biochem Biophys Res Commun. 1997; 238(1):26–32. PMID:9299445
5. Lu R, Wang GG. Tudor: a versatile family of histone methylation 'readers'. Trends Biochem Sci. 2013; 38(11):546–55. doi:10.1016/j.tibs.2013.08.002PMID:24035451
6. Cherepanov P, Maertens G, Proost P, Devreese B, Van Beeumen J, Engelborghs Y, et al. HIV-1 inte-grase forms stable tetramers and associates with LEDGF/p75 protein in human cells. J Biol Chem. 2003; 278(1):372–381. doi:10.1074/jbc.M209278200PMID:12407101
7. Cherepanov P. LEDGF/p75 interacts with divergent lentiviral integrases and modulates their enzymatic activity in vitro. Nucleic Acids Res. 2007; 35(1):113–124. doi:10.1093/nar/gkl885PMID:17158150 8. Kvaratskhelia M, Sharma A, Larue RC, Serrao E, Engelman A. Molecular mechanisms of retroviral
inte-gration site selection. Nucleic Acids Res. 2014; 42(16):10209–10225. doi:10.1093/nar/gku769PMID:
25147212
9. Schrijvers R, Vets S, De Rijck J, Malani N, Bushman FD, Debyser Z, et al. HRP-2 determines HIV-1 integration site selection in LEDGF/p75 depleted cells. Retrovirology. 2012; 9:84. doi: 10.1186/1742-4690-9-84PMID:23046603
10. Wang H, Jurado KA, Wu X, Shun MC, Li X, Ferris AL, et al. HRP2 determines the efficiency and speci-ficity of HIV-1 integration in LEDGF/p75 knockout cells but does not contribute to the antiviral activity of a potent LEDGF/p75-binding site integrase inhibitor. Nucleic Acids Res. 2012; 40(22):11518–11530.
doi:10.1093/nar/gks913PMID:23042676
11. Nishizawa Y, Usukura J, Singh DP, Chylack LT Jr. Shinohara T. Spatial and temporal dynamics of two alternatively spliced regulatory factors, lens epithelium-derived growth factor (ledgf/p75) and p52, in the nucleus. Cell Tissue Res. 2001; 305(1):107–114. PMID:11512661
12. Maertens G, Cherepanov P, Pluymers W, Busschots K, De Clercq E, Debyser Z, et al. LEDGF/p75 Is essential for nuclear and chromosomal targeting of HIV-1 integrase in human cells. J Biol Chem. 2003; 278(35):33528–33539. doi:10.1074/jbc.M303594200PMID:12796494
13. Vanegas M, Llano M, Delgado S, Thompson D, Peretz M, Poeschla E. Identification of the LEDGF/p75 HIV-1 integrase-interaction domain and NLS reveals NLS-independent chromatin tethering. J Cell Sci. 2005; 118(8):1733–1743. doi:10.1242/jcs.02299
15. Shun MC, Raghavendra NK, Vandegraaff N, Daigle JE, Hughes S, Kellam P, et al. LEDGF/p75 func-tions downstream from preintegration complex formation to effect gene-specific HIV-1 integration. Genes Dev. 2007; 21(14):1767–1778. doi:10.1101/gad.1565107PMID:17639082
16. Sutherland HG, Newton K, Brownstein DG, Holmes MC, Kress C, Semple CA, et al. Disruption of Ledgf/Psip1 results in perinatal mortality and homeotic skeletal transformations. Mol Cell Biol. 2006; 26 (19):7201–7210. doi:10.1128/MCB.00459-06PMID:16980622
17. Trapnell C, Pachter L, Salzberg SL. TopHat: discovering splice junctions with RNA-Seq. Bioinformatics. 2009; 25(9):1105–1111. doi:10.1093/bioinformatics/btp120PMID:19289445
18. Anders S, Pyl PT, Huber W. HTSeq—a Python framework to work with high-throughput sequencing
data. Bioinformatics. 2015; 31:166–169. doi:10.1093/bioinformatics/btu638PMID:25260700 19. Robinson MD, McCarthy DJ, Smyth GK. edgeR: a Bioconductor package for differential expression
analysis of digital gene expression data. Bioinformatics. 2010; 26(1):139–140. doi:10.1093/
bioinformatics/btp616PMID:19910308
20. Luo W, Friedman M, Shedden K, Hankenson K, Woolf P. GAGE: generally applicable gene set enrich-ment for pathway analysis. BMC Bioinformatics. 2009; 10(1):161. doi:10.1186/1471-2105-10-161
21. Kanehisa M, Goto S. KEGG: Kyoto Encyclopedia of Genes and Genomes. Nucleic Acids Res. 2000; 28(1):27–30. doi:10.1093/nar/28.1.27PMID:10592173
22. Kanehisa M, Goto S, Sato Y, Kawashima M, Furumichi M, Tanabe M. Data, information, knowledge and principle: back to metabolism in KEGG. Nucleic Acids Res. 2014; 42(D1):D199–D205. doi:10.
1093/nar/gkt1076
23. Luo W, Brouwer C. Pathview: an R/Bioconductor package for pathway-based data integration and visu-alization. Bioinformatics. 2013; 29(14):1830–1831. doi:10.1093/bioinformatics/btt285PMID:
23740750
24. McClive P, Pall G, Newton K, Lee M, Mullins J, Forrester L. Gene trap integrations expressed in the developing heart: insertion site affects splicing of the PT1-ATG vector. Dev Dyn. 1998; 212(2):267–
276. PMID:9626501
25. Salmon NA, Reijo Pera RA, Xu EY. A gene trap knockout of the abundant sperm tail protein, outer dense fiber 2, results in preimplantation lethality. Genesis. 2006; 44(11):515–522. PMID:17078042 26. Thakar K, Votteler I, Kelkar D, Shidore T, Gupta S, Kelm S, et al. Interaction of HRP-2 isoforms with
HDGF: chromatin binding of a specific heteromer. FEBS J. 2012; 279(5):737–751. doi:
10.1111/j.1742-4658.2011.08464.xPMID:22212508
27. Gallitzendoerfer R, Abouzied MM, Hartmann D, Dobrowolski R, Gieselmann V, Franken S. Hepatoma-derived growth factor (HDGF) is dispensable for normal mouse development. Dev Dyn. 2008; 237 (7):1875–1885. doi:10.1002/dvdy.21589PMID:18570251
28. Kirchhoff S, Kim J-S, Hagendorff A, Thönnissen E, Krüger O, Lamers WH, et al. Abnormal cardiac con-duction and morphogenesis in connexin40 and connexin43 double-deficient mice. Circ Res. 2000; 87 (5):399–405. doi:10.1161/01.res.87.5.399PMID:10969038
29. Savolainen SM, Foley JF, Elmore SA. Histology atlas of the developing mouse heart with emphasis on E11.5 to E18.5. Toxicol Pathol. 2009; 37(4):395–414. doi:10.1177/0192623309335060PMID:
19359541
30. Briggs SF, Reijo Pera RA. X chromosome inactivation: recent advances and a look forward. Curr Opin Genet Dev. 2014; 28:78–82. doi:10.1016/j.gde.2014.09.010PMID:25461454
31. Maertens GN, Cherepanov P, Engelman A. Transcriptional co-activator p75 binds and tethers the Myc-interacting protein JPO2 to chromatin. J Cell Sci. 2006; 119(12):2563–2571. doi:10.1242/jcs.02995 32. Bartholomeeusen K, De Rijck J, Busschots K, Desender L, Gijsbers R, Emiliani S, et al. Differential
interaction of HIV-1 integrase and JPO2 with the C terminus of LEDGF/p75. J Mol Biol. 2007; 372 (2):407–421. PMID:17669426
33. Bartholomeeusen K, Christ F, Hendrix J, Rain J-C, Emiliani S, Benarous R, et al. Lens epithelium-derived growth factor/p75 interacts with the transposase-epithelium-derived DDE domain of PogZ. J Biol Chem. 2009; 284(17):11467–11477. doi:10.1074/jbc.M807781200PMID:19244240
34. Yokoyama A, Cleary ML. Menin critically links MLL proteins with LEDGF on cancer-associated target genes. Cancer Cell. 2008; 14(1):36–46. doi:10.1016/j.ccr.2008.05.003PMID:18598942
35. Hughes S, Jenkins V, Dar MJ, Engelman A, Cherepanov P. Transcriptional co-activator LEDGF inter-acts with Cdc7-activator of S-phase kinase (ASK) and stimulates its enzymatic activity. J Biol Chem. 2010; 285(1):541–554. doi:10.1074/jbc.M109.036491PMID:19864417
36. Murai MJ, Pollock J, He S, Miao H, Purohit T, Yokom A, et al. The same site on the integrase-binding domain of lens epithelium–derived growth factor is a therapeutic target for MLL leukemia and HIV.
37. Gérard A, Ségéral E, Naughtin M, Abdouni A, Charmeteau B, Cheynier R, et al. The integrase cofactor LEDGF/p75 associates with Iws1 and Spt6 for postintegration silencing of HIV-1 gene expression in latently infected cells. Cell Host Microbe. 2015; 17(1):107–117. doi:10.1016/j.chom.2014.12.002
PMID:25590759
38. Morchikh M, Naughtin M, Di Nunzio F, Xavier J, Charneau P, Jacob Y, et al. TOX4 and NOVA1 proteins are partners of the LEDGF PWWP domain and affect HIV-1 replication. PLoS One. 2013; 8(11): e81217. doi:10.1371/journal.pone.0081217PMID:24312278
39. Pradeepa MM, Grimes GR, Taylor GCA, Sutherland HG, Bickmore WA. Psip1/Ledgf p75 restrains Hox gene expression by recruiting both trithorax and polycomb group proteins. Nucleic Acids Res. 2014; 42 (14):9021–9032. doi:10.1093/nar/gku647PMID:25056311
40. Kulkarni AB, Karlsson S. Transforming growth factor-beta 1 knockout mice. A mutation in one cytokine gene causes a dramatic inflammatory disease. Am J Pathol. 1993; 143(1):3–9. PMID:8317552 41. Gordon KJ, Blobe GC. Role of transforming growth factor-beta superfamily signaling pathways in
human disease. Biochim Biophys Acta. 2008; 1782(4):197–228. doi:10.1016/j.bbadis.2008.01.006
PMID:18313409
42. Hines KL, Kulkarni AB, McCarthy JB, Tian H, Ward JM, Christ M, et al. Synthetic fibronectin peptides interrupt inflammatory cell infiltration in transforming growth factor beta 1 knockout mice. Proc Natl Acad Sci USA. 1994; 91(11):5187–5191. PMID:8197206
43. Sanford LP, Ormsby I, Gittenberger-de Groot AC, Sariola H, Friedman R, Boivin GP, et al. TGFbeta2 knockout mice have multiple developmental defects that are non-overlapping with other TGFbeta knockout phenotypes. Development. 1997; 124(13):2659–2670. PMID:9217007
44. Bobik A. Transforming growth factor-βs and vascular disorders. Arterioscler Thromb Vasc Biol. 2006; 26(8):1712–1720. doi:10.1161/01.ATV.0000225287.20034.2cPMID:16675726
45. Takehara-Kasamatsu Y, Tsuchida K, Nakatani M, Murakami T, Kurisaki A, Hashimoto O, et al. Charac-terization of follistatin-related gene as a negative regulatory factor for activin family members during mouse heart development. J Med Invest. 2007; 54(3–4):276–288. PMID:17878677
46. Chen Q, Chen H, Zheng D, Kuang C, Fang H, Zou B, et al. Smad7 Is required for the development and function of the heart. J Biol Chem. 2009; 284(1):292–300. doi:10.1074/jbc.M807233200PMID:
18952608
47. Peng X, Wu X, Druso JE, Wei H, Park AY, Kraus MS, et al. Cardiac developmental defects and eccen-tric right veneccen-tricular hypertrophy in cardiomyocyte focal adhesion kinase (FAK) conditional knockout mice. Proc Natl Acad Sci USA. 2008; 105(18):6638–6643. doi:10.1073/pnas.0802319105PMID:
18448675
48. Heino J, Ignotz RA, Hemler ME, Crouse C, Massague J. Regulation of cell adhesion receptors by trans-forming growth factor-beta. Concomitant regulation of integrins that share a common beta 1 subunit. J Biol Chem. 1989; 264(1):380–388. PMID:2491849
49. Heino J, Massague J. Transforming growth factor-beta switches the pattern of integrins expressed in MG-63 human osteosarcoma cells and causes a selective loss of cell adhesion to laminin. J Biol Chem. 1989; 264(36):21806–21811. PMID:2600089
50. Zambruno G, Marchisio PC, Marconi A, Vaschieri C, Melchiori A, Giannetti A, et al. Transforming growth factor-beta 1 modulates beta 1 and beta 5 integrin receptors and induces the de novo expres-sion of the alpha v beta 6 heterodimer in normal human keratinocytes: implications for wound healing. J Cell Biol. 1995; 129(3):853–865. PMID:7537276
51. Corda S, Samuel JL, Rappaport L. Extracellular matrix and growth factors during heart growth. Heart Fail Rev. 2000; 5(2):119–130. PMID:16228139
52. Stephens LE, Sutherland AE, Klimanskaya IV, Andrieux A, Meneses J, Pedersen RA, et al. Deletion of beta 1 integrins in mice results in inner cell mass failure and peri-implantation lethality. Genes Dev. 1995; 9(15):1883–1895. PMID:7544312
53. Fassler R, Rohwedel J, Maltsev V, Bloch W, Lentini S, Guan K, et al. Differentiation and integrity of car-diac muscle cells are impaired in the absence of beta 1 integrin. J Cell Sci. 1996; 109(Pt 13):2989–
2999. PMID:9004034
54. Shai SY, Harpf AE, Babbitt CJ, Jordan MC, Fishbein MC, Chen J, et al. Cardiac myocyte-specific exci-sion of the beta1 integrin gene results in myocardial fibrosis and cardiac failure. Circ Res. 2002; 90 (4):458–464. PMID:11884376
55. Boudreau NJ, Jones PL. Extracellular matrix and integrin signalling: the shape of things to come. Bio-chem J. 1999; 339(Pt 3):481–488. PMID:10215583
56. Vadali K, Cai X, Schaller MD. Focal adhesion kinase: an essential kinase in the regulation of cardiovas-cular functions. IUBMB life. 2007; 59(11):709–716. doi:10.1080/15216540701694245PMID:
57. Li X, Nie S, Chang C, Qiu T, Cao X. Smads oppose Hox transcriptional activities. Exp Cell Res. 2006; 312(6):854–864. PMID:16405960
58. Williams TM, Williams ME, Heaton JH, Gelehrter TD, Innis JW. Group 13 HOX proteins interact with the MH2 domain of R-Smads and modulate Smad transcriptional activation functions independent of HOX DNA-binding capability. Nucleic Acids Res. 2005; 33(14):4475–4484. doi:10.1093/nar/gki761PMID:
16087734
59. Ge H, Si Y, Wolffe AP. A novel transcriptional coactivator, p52, functionally interacts with the essential splicing factor ASF/SF2. Mol Cell. 1998; 2(6):751–759. PMID:9885563
60. Pradeepa MM, Sutherland HG, Ule J, Grimes GR, Bickmore WA. Psip1/Ledgf p52 binds methylated histone H3K36 and splicing factors and contributes to the regulation of alternative splicing. PLoS Genet. 2012; 8(5):e1002717. doi:10.1371/journal.pgen.1002717PMID:22615581
61. Xu X, Yang D, Ding JH, Wang W, Chu PH, Dalton ND, et al. ASF/SF2-regulated CaMKIIdelta alterna-tive splicing temporally reprograms excitation-contraction coupling in cardiac muscle. Cell. 2005; 120 (1):59–72. PMID:15652482
62. Park JW, Tokheim C, Shen S, Xing Y. Identifying differential alternative splicing events from RNA sequencing data using RNASeq-MATS. Methods Mol Biol. 2013; 1038:171–179. doi: