JHEP05(2012)063
Published for SISSA by SpringerReceived: January 26, 2012
Accepted: April 23, 2012
Published:May 14, 2012
Suppression of non-prompt
J
/ψ
, prompt
J
/ψ
, and
Υ(1S)
in PbPb collisions at
√
s
NN
= 2
.
76
TeV
The CMS collaboration
Abstract:Yields of prompt and non-prompt J/ψ, as well as Υ(1S) mesons, are measured
by the CMS experiment via their µ+µ− decays in PbPb and pp collisions at √s
NN =
2.76 TeV for quarkonium rapidity |y| < 2.4. Differential cross sections and nuclear mod-ification factors are reported as functions of y and transverse momentum pT, as well as
collision centrality. For prompt J/ψwith relatively highpT(6.5< pT<30 GeV/c), a strong,
centrality-dependent suppression is observed in PbPb collisions, compared to the yield in pp collisions scaled by the number of inelastic nucleon-nucleon collisions. In the same kine-matic range, a suppression of non-prompt J/ψ, which is sensitive to the in-medium b-quark energy loss, is measured for the first time. Also the low-pT Υ(1S) mesons are suppressed
in PbPb collisions.
Keywords: Heavy Ions
JHEP05(2012)063
Contents
1 Introduction 1
2 The CMS detector 3
3 Data selection 4
3.1 Event selection 4
3.2 Muon selection 6
4 Signal extraction 7
4.1 J/ψ analysis 7
4.1.1 Inclusive J/ψ 7
4.1.2 Prompt and non-prompt J/ψ 9
4.2 Υ(1S) analysis 10
5 Acceptance and efficiency 12
5.1 Acceptance 12
5.2 Efficiency 14
6 The pp baseline measurement 16
7 Results 18
7.1 Inclusive and prompt J/ψ 20
7.2 Non-prompt J/ψ 22
7.3 Υ(1S) 23
8 Discussion 26
9 Summary 27
A Tables of results 28
The CMS collaboration 37
1 Introduction
JHEP05(2012)063
The formation of a QGP in high-energy nuclear collisions can be evidenced in avari-ety of ways. One of its most striking expected signatures is the suppression of quarkonium states [7], both of the charmonium (J/ψ,ψ′,χc, etc.) and the bottomonium (Υ(1S, 2S, 3S),
χb, etc.) families. This is thought to be a direct effect of deconfinement, when the binding potential between the constituents of a quarkonium state, a heavy quark and its antiquark, is screened by the colour charges of the surrounding light quarks and gluons. The suppres-sion is predicted to occur above the critical temperature of the medium (Tc) and depends on the QQ binding energy. Since the Υ(1S) is the most tightly bound state among all quarko-nia, it is expected to be the one with the highest dissociation temperature. Examples of dissociation temperatures are given in ref. [8]: Tdissoc∼1Tc, 1.2Tc,and 2Tc for the Υ(3S), Υ(2S), and Υ(1S), respectively. Similarly, in the charmonium family the dissociation tem-peratures are≤1Tc and 1.2Tc for the ψ′ and J/ψ, respectively. However, there are further possible changes to the quarkonium production in heavy-ion collisions. On the one hand, modifications to the parton distribution functions inside the nucleus (shadowing) and other cold-nuclear-matter effects can reduce the production of quarkonia without the presence of a QGP [9,10]. On the other hand, the large number of heavy quarks produced in heavy-ion collisheavy-ions, in particular at the energies accessible by the Large Hadron Collider (LHC), could lead to an increased production of quarkonia via statistical recombination [11–16].
Charmonium studies in heavy-ion collisions have been carried out for 25 years, first at the Super Proton Synchrotron (SPS) by the NA38 [17], NA50 [18,19], and NA60 [20] fixed-target experiments at 17.3–19.3 GeV centre-of-mass energy per nucleon pair (√sNN), and
then at the Relativistic Heavy Ion Collider (RHIC) by the PHENIX experiment at √sNN
= 200 GeV [21]. In all cases, J/ψ suppression was observed in the most central collisions. At the SPS, the suppression of the ψ′ meson was also measured [19]. Experimentally, the suppression is quantified by the ratio of the yield measured in heavy-ion collisions and a reference. At RHIC, the reference was provided by the properly scaled yield measured in pp collisions. Such a ratio is called the nuclear modification factor,RAA. In the absence of modifications, one would expectRAA= 1 for hard processes, which scale with the number of inelastic nucleon-nucleon collisions. For bottomonia, the production cross section is too small at RHIC to make definitive statements [22]. With the higher energy and luminosity available at the LHC, new studies for charmonia and bottomonia have become possible: (i) ATLAS has reported a suppression of inclusive J/ψ with high transverse momenta
pT in central PbPb collisions compared to peripheral collisions at √sNN = 2.76 TeV [23];
(ii) ALICE has measured the RAA for inclusive J/ψ with low pT and sees no centrality
dependence of the J/ψ suppression [24]; (iii) a suppression of the excited Υ states with respect to the ground state has been observed in PbPb collisions at √sNN = 2.76 TeV compared to pp collisions at the same centre-of-mass energy by the Compact Muon Solenoid (CMS) collaboration [25].
JHEP05(2012)063
the binary-collision-scaled pp yield. In heavy-ion collisions, only indirect measurements ofthis effect exist, through single electrons from semileptonic open heavy-flavour decays [29– 31]; to date, the contributions from charm and bottom have not been disentangled. The importance of an unambiguous measurement of open bottom flavour is driven by the lack of knowledge regarding key features of the dynamics of parton energy loss in the QGP, such as its colour-charge and parton-mass dependencies [32,33] and the relative role of radiative and collisional energy loss [34]. CMS is well equipped to perform direct measurements of b-hadron production in heavy-ion collisions by identifying non-prompt J/ψ from b-hadron decays via the reconstruction of secondaryµ+µ− vertices.
The paper is organised as follows: the CMS detector is briefly described in section 2. Section3 presents the data collection, the PbPb event selection, the muon reconstruction and selection, and the Monte Carlo (MC) simulations. The methods employed for signal extraction are detailed in section 4. Section 5 describes the acceptance correction factors and the estimation of the reconstruction efficiencies. The pp baseline measurements are summarized in section6. The results are presented in section7, followed by their discussion in section 8.
2 The CMS detector
A detailed description of the CMS experiment can be found in ref. [35]. The central feature of the CMS apparatus is a superconducting solenoid of 6 m internal diameter. Within the field volume are the silicon tracker, the crystal electromagnetic calorimeter, and the brass/scintillator hadron calorimeter.
CMS uses a right-handed coordinate system, with the origin at the nominal interaction point, thex axis pointing to the centre of the LHC, they axis pointing up (perpendicular to the LHC plane), and the z axis along the counterclockwise-beam direction. The polar angle θis measured from the positivez axis and the azimuthal angleφis measured in the
x-y plane. The pseudorapidity is defined asη =−ln[tan(θ/2)].
Muons are detected in the interval |η|<2.4 by gaseous detectors made of three tech-nologies: drift tubes, cathode strip chambers, and resistive plate chambers, embedded in the steel return yoke. The silicon tracker is composed of pixel detectors (three barrel layers and two forward disks on either side of the detector, made of 66 million 100×150µm2
pixels) followed by microstrip detectors (ten barrel layers plus three inner disks and nine forward disks on either side of the detector, with strips of pitch between 80 and 180µm). The transverse momentum of muons matched to reconstructed tracks is measured with a resolution better than ∼1.5% for pT smaller than 100 GeV/c [36]. The good resolution is
JHEP05(2012)063
3 Data selection
3.1 Event selection
Inelastic hadronic PbPb collisions are selected using information from the BSC and HF calorimeters, in coincidence with a bunch crossing identified by the beam pick-up (one on each side of the interaction point) [35]. Events are further filtered offline by requiring a reconstructed primary vertex based on at least two tracks, and at least 3 towers on each HF with an energy deposit of more than 3 GeV per tower. These criteria reduce contributions from single-beam interactions with the environment (e.g. beam-gas collisions and collisions of the beam halo with the beam pipe), ultra-peripheral electromagnetic interactions, and cosmic-ray muons. A small fraction of the most peripheral PbPb collisions are not selected by theseminimum-biasrequirements, which accept (97±3)% of the inelastic hadronic cross section [37]. A sample corresponding to 55.7 M minimum-bias events passes all these filters. Assuming an inelastic PbPb cross section ofσPbPb = 7.65 b [37], this sample corresponds to
an integrated luminosity ofLint= 7.28µb−1. This value is only mentioned for illustration
purposes; the final results are normalized to the number of minimum-bias events.
The measurements reported here are based on dimuon events triggered by the Level-1 (L1) trigger, a hardware-based trigger that uses information from the muon detectors. The CMS detector is also equipped with a software-based high-level trigger (HLT). However, no further requirements at the HLT level have been applied to the L1 muon objects used for this analysis.
The event centrality distribution of minimum-bias events is compared to events selected by the double-muon trigger in figure 1. The centrality variable is defined as the fraction of the total cross section, starting at 0% for the most central collisions. This fraction is determined from the distribution of total energy measured in both HF calorimeters [38]. Using a Glauber-model calculation as described in ref. [37], one can estimate variables related to the centrality, such as the number of nucleons participating in the collisions (Npart) and the nuclear overlap function (TAA), which is equal to the number of elementary nucleon-nucleon (NN) binary collisions divided by the elementary NN cross section and can be interpreted as the NN equivalent integrated luminosity per heavy ion collision, at a given centrality [39]. The values of these variables are presented in table1for the centrality bins used in this analysis. The double-muon-triggered events are more frequent in central collisions since the main physics processes that generate high-pT muon pairs scale with the
number of inelastic nucleon-nucleon collisions. In the following, Npart will be the variable
used to show the centrality dependence of the measurements.
JHEP05(2012)063
Centrality (%)
Fraction of minimum-bias events
-8
10
-7
10
-6
10
-5
10
-4
10
-3
10
-2
10
-1
10 1
0 20 40
60 80
100
Minimum-bias sample Double-muon-triggered sample
= 2.76 TeV
NN
s CMS PbPb
Figure 1. Centrality distribution of the minimum-bias sample (solid black line) overlaid with the double-muon triggered sample (hashed red) in bins of 2.5%.
Npart TAA (mb−1) Centrality (%) Mean RMS Mean RMS
0–10 355.4 33.3 23.19 3.77 10–20 261.4 30.4 14.48 2.86 20–30 187.2 23.4 8.78 1.94 30–40 130.0 17.9 5.09 1.27 40–50 86.3 13.6 2.75 0.80 50–100 22.1 19.3 0.47 0.54 0–20 308.4 56.8 18.83 5.49 20–100 64.2 63.0 2.37 3.05 0–100 113.1 115.6 5.66 7.54
Table 1. Average and root-mean-square (RMS) values of the number of participating nucleons (Npart) and of the nuclear overlap function (TAA) for the centrality bins used in this analysis [37].
shower evolution. For the non-prompt J/ψstudies, the b-hadron events are produced with pythia in generic QCD 2→2 processes. In all three samples, the J/ψ or Υ(1S) decay is
simulated using the evtgen [43] package. Prompt J/ψand Υ(1S) are simulated assuming unpolarized production, while the non-prompt J/ψ polarization is determined by the sum of the exclusive states generated by evtgen. Final-state bremsstrahlung is implemented using photos [44].
JHEP05(2012)063
are produced with the hydjet event generator [46] and then simulated with geant4 aswell. The hydjet parameters were tuned to reproduce the particle multiplicities at all centralities seen in data. The embedding is done at the level of detector hits and requires that the signal and background production vertices match. The embedded event is then processed through the trigger emulation and the full event reconstruction chain. Collision data are used to validate the efficiencies evaluated using MC simulations, as discussed in section 5.2.
3.2 Muon selection
The muon offline reconstruction algorithm starts by reconstructing tracks in the muon detectors, calledstandalone muons. These tracks are then matched to tracks reconstructed in the silicon tracker by means of an algorithm optimized for the heavy-ion environment [47, 48]. The final muon objects, calledglobal muons, result from a global fit of the standalone muon and tracker tracks. These are used to obtain the results presented in this paper.
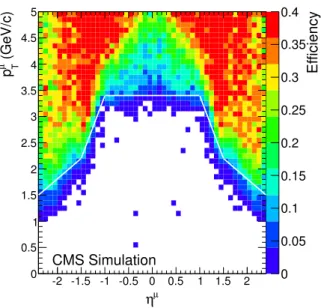
In figure2, the single-muon reconstruction efficiency from MC simulations is presented as a function of the muonpµTandηµ. The reconstruction efficiency is defined as the number of all reconstructed global muons divided by the number of generated muons in a given (ηµ, pµ
T) bin. It takes into account detector resolution effects, i.e. reconstructed pT and η
values are used in the numerator and generated pT and η values in the denominator. To
obtain a clear separation between acceptance and efficiency corrections, adetectable single-muon acceptance is defined in the (ηµ, pµT) space. For the J/ψ analysis this separation is defined by the contour that roughly matches a global muon reconstruction efficiency of 10%, indicated by the white lines superimposed in figure 2, which are described by the conditions
pµT >3.4 GeV/c for|ηµ|<1.0,
pµT >(5.8−2.4× |ηµ|) GeV/c for 1.0<|ηµ|<1.5, (3.1)
pµT >(3.4−0.78× |ηµ|) GeV/c for 1.5<|ηµ|<2.4.
Muons failing these conditions are accounted for in the acceptance corrections discussed in section 5.1. Muons that pass this acceptance requirement can still fail to pass the trigger, track reconstruction, or muon selection requirements. These losses are accounted for by the efficiency corrections discussed in section5.2.
For the Υ(1S) analysis, where the signal-to-background ratio is less favourable than in the J/ψ mass range, a higherpµT is required than for the J/ψanalysis,
pµT>4 GeV/c, (3.2)
independent ofηµ.
JHEP05(2012)063
µ
η
-2 -1.5 -1 -0.5 0 0.5 1 1.5 2
(GeV/c) µ T p 0 0.5 1 1.5 2 2.5 3 3.5 4 4.5 5 E ff ic ie n c y 0 0.05 0.1 0.15 0.2 0.25 0.3 0.35 0.4 CMS Simulation
Figure 2. Reconstruction efficiency of global muons in the (ηµ, pµ
T) space, illustrating the lower
limits (white lines) of what is considered a detectable single muon for the J/ψ analysis.
hits in the silicon tracker, and theχ2 per degree of freedom of the global (inner) track fit is less than 20 (4). Theχ2 probability of the two tracks originating from a common vertex is
required to be larger than 1%. From MC simulations we find that these criteria result in a 6.6%, 5.1%, and 3.9% loss of prompt J/ψ, non-prompt J/ψ, and Υ(1S) events, respectively, given two reconstructed tracks associated with the double muon trigger.
4 Signal extraction
4.1 J/ψ analysis
4.1.1 Inclusive J/ψ
Theµ+µ−pair invariant-massmµµ spectrum is shown in figure3in the region 2< mµµ< 4 GeV/c2 for muon pairs with 0< pT<30 GeV/cand rapidity |y|<2.4, after applying the
single-muon quality requirements. No minimum pair-pT requirement is applied explicitly.
However, the CMS acceptance for µ+µ− pairs in this mass range requires a minimum pT
that is strongly y-dependent and is ≈6.5 GeV/c at y = 0. The black curve in figure 3 represents an unbinned maximum likelihood fit to theµ+µ−pair spectrum, with the signal described by the sum of a Gaussian and a Crystal Ball function, with common mean m0
and widthσ, and the background described by an exponential. The Crystal Ball function
fCB(m) combines a Gaussian core and a power-law tail with an exponentnto account for energy loss due to final-state photon radiation,
fCB(m) =
N √
2πσexp
−(m−m0)2
2σ2
, for m−m0
σ >−α; N
√
2πσ
n |α|
n
exp−|α2|2 n
|α|− |α|− m−m0
σ
−n
, for m−m0
σ ≤ −α.
(4.1)
JHEP05(2012)063
) 2 (GeV/c
µ µ
m
2 2.2 2.4 2.6 2.8 3 3.2 3.4 3.6 3.8 4
)
2
Events / ( 0.02 GeV/c
0 50 100 150 200 250 300
= 2.76 TeV NN
s CMS PbPb
-1
b µ = 7.28
int
L
Cent. 0-100%, |y| < 2.4 < 30 GeV/c
T
0 < p σ = 39 MeV/c2
data total fit background
Figure 3. Invariant-mass spectrum of µ+µ− pairs (black circles) with |y| < 2.4 and
0< pT<30 GeV/c integrated over centrality. The fit to the data with the functions discussed in
the text is shown as the black line. The dashed blue line shows the fitted background contribution.
eq. (4.1), one parameter is the fraction of the Gaussian contribution to the total signal yield (typically≈0.47) and two parameters define the normalization and the slope of the exponential background. The fitted mean value,m0 = (3.090±0.002) GeV/c2, is 0.2% below
the PDG value ofmJ/ψ = 3.097 GeV/c2 [49] because of slight momentum scale biases in the
data reconstruction; the width is σ = (39±2) MeV/c2, consistent with MC expectations. The number of inclusive J/ψ mesons obtained by the fit is 734±54.
The analysis is performed in bins of the J/ψ meson pT and y, as well as in bins of event centrality. Integrating over all centrality (0–100%) andpT (6.5< pT<30 GeV/c) the
rapidity bins are
|y|<1.2, 1.2<|y|<1.6, and 1.6<|y|<2.4.
For the two forward bins, the CMS acceptance extends to lower pT, so results are also
presented for the bins
1.2<|y|<1.6 and 5.5< pT<30 GeV/c, as well as 1.6<|y|<2.4 and 3< pT <30 GeV/c.
These values allow a better comparison with the low-pT measurements of the ALICE experiment, which has acceptance for J/ψ with pT > 0 GeV/c for the rapidity intervals |y|<0.9 and 2.4< y <4.0, in the electron and muon decay channels, respectively [50].
Integrating over all centrality (0–100%) and rapidity (|y|<2.4) thepT bins are
6.5< pT<10 GeV/cand 10< pT<30 GeV/c.
Integrating over thepTrange 6.5< pT<30 GeV/cand rapidity|y|<2.4, the centrality
JHEP05(2012)063
The unbinned maximum likelihood fit with the sum of Crystal Ball and Gaussianfunc-tions is performed in each of these bins. Because of the small sample size, the parameters of the signal shape are determined for each rapidity and pT interval, integrated over
cen-trality, as the dominant effect on the mass shape is the pT- and rapidity-dependent mass resolution. As a function of rapidity, the width of the Crystal Ball function varies from 24 MeV/c2 (|y|<1.2) to 51 MeV/c2 (1.6<|y|<2.4), for the p
T range 6.5< pT <30 GeV/c.
As a function ofpT, the width changes from 39 MeV/c2 (6.5< pT<10 GeV/c) to 23 MeV/c2
(10 < pT < 30 GeV/c), when integrated over rapidity. The values are then fixed for the
finer centrality bins. The background shape is allowed to vary in each bin. The raw yields of inclusive J/ψ are listed in table4of appendix A.
4.1.2 Prompt and non-prompt J/ψ
The identification of J/ψ mesons coming from b-hadron decays relies on the measurement of a secondaryµ+µ−vertex displaced from the primary collision vertex. The displacement vector between theµ+µ− vertex and the primary vertex~r is measured in the plane trans-verse to the beam direction. The most probable transtrans-verse b-hadron decay length in the laboratory frame [51,52] is calculated as
Lxy = ˆ
uTS−1~r
ˆ
uTS−1uˆ, (4.2)
where ˆuis the unit vector in the direction of the J/ψmesonpT~ andS−1is the inverse of the sum of the primary and secondary vertex covariance matrices. FromLxy the pseudo-proper decay lengthℓJ/ψ =LxymJ/ψ/pT is computed as an estimate of the b-hadron decay length.
The pseudo-proper decay length is measured with a resolution of ∼35µm.
To measure the fraction of non-prompt J/ψ, the invariant-mass spectrum of µ+µ− pairs and their ℓJ/ψ distribution are fitted simultaneously using a two-dimensional un-binned maximum-likelihood fit in bins of pT, rapidity, and centrality with the fraction of
non-prompt J/ψ as a free parameter. The fitting procedure is similar to the one used in the pp analysis at √s = 7 TeV [27]. The differences are: (i) the parametrisation of the
JHEP05(2012)063
in the prompt and non-prompt J/ψ reconstruction efficiencies that increases with the J/ψmesonpT.
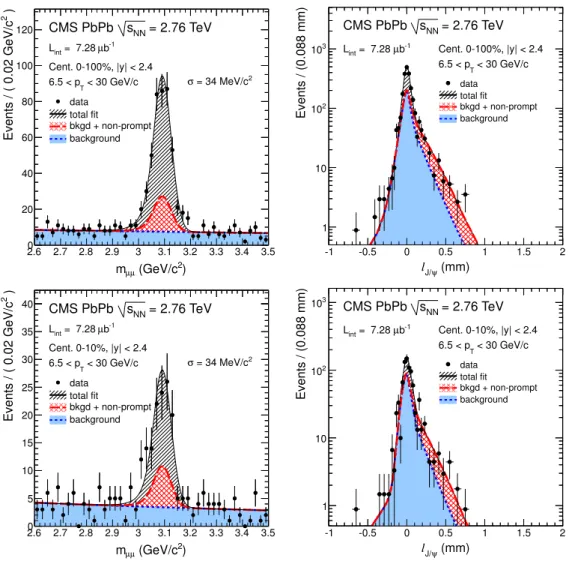
The prompt J/ψ result is presented (in section 7.1) in the centrality bins 0–10%, 10– 20%, 20–30%, 30–40%, 40–50%, and 50–100%, while the non-prompt J/ψ result, given the smaller sample, is presented (in section 7.2) in only two centrality bins, 0–20% and 20– 100%. Examples of mµ+µ− and ℓJ/ψ distributions are shown in figure4, including the one
for the 0–10% centrality bin, which is one of the worst in terms of signal over background ratio. The two-dimensional fit results are shown as projections onto the mass and ℓJ/ψ
axes. Integrated over centrality, the numbers of prompt and non-prompt J/ψ mesons with |y|<2.4 and 6.5< pT<30 GeV/care 307±22 and 90±13, respectively.
In order to determine the systematic uncertainty on the yield extraction, the signal and background shapes are varied: for the signal mass shape, in addition to the default sum of the Crystal Ball and Gaussian functions, a single Gaussian and a single Crystal Ball function are tried. Alternatively, theα andnparameters of the Crystal Ball function are fixed individually for each pT and rapidity bin to the values found in the centrality
integrated bin. This is in contrast to the default procedure in which the values for each rapidity bin are fixed to the values found in the bin integrated over centrality and all pT.
For the background mass shape, a straight line is tried as an alternative. A crosscheck using a simple counting of the yield in the signal region after the subtraction of the same-sign spectrum leads to consistent results. The uncertainty on the fraction of non-prompt J/ψdue to the parametrisation of theℓJ/ψ distribution is estimated by varying the number of free parameters in the resolution function while the other parameters are fixed to their MC values. The systematic uncertainty is taken as the RMS of the yields obtained from the different variations of the fit function. The systematic uncertainties vary between 0.5% and 5.7% for the prompt J/ψ yield, while the non-prompt J/ψ yield has uncertainties up to the extreme case of 14% in the most forward rapidity (1.6 <|y| <2.4) and lowest pT
(3< pT<30 GeV/c) bin.
4.2 Υ(1S) analysis
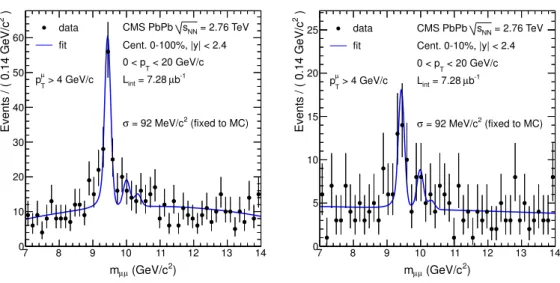
To extract the Υ(1S) yield, an extended unbinned maximum-likelihood fit to the µ+µ−
invariant mass spectrum between 7 and 14 GeV/c2is performed, integrated overp
T, rapidity,
and centrality, as shown in the left panel of figure5. The measured mass line shape of each Υ state is parametrised by a Crystal Ball function. Since the three Υ resonances partially overlap in the measured dimuon mass spectrum, they are fitted simultaneously. Therefore, the probability distribution function describing the signal consists of three Crystal Ball functions. In addition to the three Υ(nS) yields, the Υ(1S) mass is the only parameter left free, to accommodate a possible bias in the momentum scale calibration. The mass ratios between the states are fixed to their world average values [49], and the mass resolution is forced to scale linearly with the resonance mass. The Υ(1S) resolution is fixed to the value found in the simulation, 92 MeV/c2. This value is consistent with what is measured
JHEP05(2012)063
) 2 (GeV/c µ µ m2.6 2.7 2.8 2.9 3 3.1 3.2 3.3 3.4 3.5
)
2
Events / ( 0.02 GeV/c
0 20 40 60 80 100
120 CMS PbPb sNN = 2.76 TeV
-1
b
µ
= 7.28
int
L
Cent. 0-100%, |y| < 2.4 < 30 GeV/c
T
6.5 < p σ = 34 MeV/c2
data total fit
bkgd + non-prompt background
(mm)
ψ
J/
l
-1 -0.5 0 0.5 1 1.5 2
Events / (0.088 mm)
1 10 2 10 3 10
= 2.76 TeV NN s CMS PbPb -1 b µ
= 7.28
int
L Cent. 0-100%, |y| < 2.4
< 30 GeV/c
T
6.5 < p
data total fit bkgd + non-prompt background ) 2 (GeV/c µ µ m
2.6 2.7 2.8 2.9 3 3.1 3.2 3.3 3.4 3.5
)
2
Events / ( 0.02 GeV/c
0 5 10 15 20 25 30 35
40 = 2.76 TeV
NN s CMS PbPb -1 b µ
= 7.28
int
L
Cent. 0-10%, |y| < 2.4 < 30 GeV/c
T
6.5 < p σ = 34 MeV/c2
data total fit
bkgd + non-prompt background
(mm)
ψ
J/
l
-1 -0.5 0 0.5 1 1.5 2
Events / (0.088 mm)
1 10
2
10
3
10 = 2.76 TeV
NN s CMS PbPb -1 b µ
= 7.28
int
L Cent. 0-10%, |y| < 2.4
< 30 GeV/c
T
6.5 < p
data total fit bkgd + non-prompt background
Figure 4. Invariant-mass spectra (left) and pseudo-proper decay length distributions (right) of
µ+µ−pairs integrated over centrality (top) and for the 0–10% centrality bin (bottom). The spectra
are integrated over the rapidity range |y| < 2.4 and the pT range 6.5 < pT < 30 GeV/c. The
projections of the two-dimensional fit onto the respective axes are overlaid as solid black lines. The dashed red lines show the fitted contribution of non-prompt J/ψ. The fitted background contributions are shown as dotted blue lines.
mass range 7–14 GeV/c2. From this fit, before accounting for acceptance and efficiencies,
the measured Υ(1S) raw yield is 86±12. The observed suppression of the excited states was discussed in [25]. The fitted mean value ism0= (9.441±0.016) GeV/c2, which, for the
same reason as for the J/ψ, is slightly below the PDG valuemΥ(1S)= 9.460 GeV/c2 [49].
The data are binned in pT and rapidity of the µ+µ− pairs, as well as in bins of
the event centrality (0–10%, 10–20%, and 20–100%). The bins in rapidity are |y| < 1.2 and 1.2 < |y| < 2.4. In contrast to the J/ψ case, CMS has acceptance for Υ down to
pT = 0 GeV/c over the full rapidity range. The pT bins in this analysis are 0 < pT <
JHEP05(2012)063
) 2 (GeV/c µ µ m7 8 9 10 11 12 13 14
)
2
Events / ( 0.14 GeV/c
0 10 20 30 40 50 60
= 2.76 TeV
NN
s CMS PbPb
Cent. 0-100%, |y| < 2.4
< 20 GeV/c
T
0 < p
-1 b µ = 7.28 int L > 4 GeV/c µ
T
p
(fixed to MC)
2
= 92 MeV/c
σ data fit ) 2 (GeV/c µ µ m
7 8 9 10 11 12 13 14
)
2
Events / ( 0.14 GeV/c
0 5 10 15 20
25 CMS PbPb sNN = 2.76 TeV
Cent. 0-10%, |y| < 2.4
< 20 GeV/c
T
0 < p
-1 b µ = 7.28 int L > 4 GeV/c µ
T
p
(fixed to MC)
2
= 92 MeV/c
σ
data
fit
Figure 5. Invariant-mass spectrum ofµ+µ−pairs (black circles) withp
T<20 GeV/cand|y|<2.4,
for muons above 4 GeV/c, integrated over centrality (left) and for the 0–10% centrality bin (right).
a µ+µ− pair in the Υ mass region and pT > 20 GeV/c. The invariant-mass distribution
for the centrality bin 0–10% is illustrated in the right panel of figure 5. The raw yields of Υ(1S) are tabulated in table5 of appendixA.
The systematic uncertainties are computed by varying the line shape in the follow-ing ways: (i) the Crystal Ball function tail parameters are varied randomly accordfollow-ing to their covariance matrix and within conservative values covering imperfect knowledge of the amount of detector material and final-state radiation in the underlying process; (ii) the width is varied by±5 MeV/c2, a value motivated by the current understanding of the detector performance (e.g., the dimuon mass resolution, accurately measured at the J/ψ
mass, is identical in pp and PbPb collisions); (iii) the background shape is changed from quadratic to linear, and the mass range of the fit is varied from 6–15 to 8–12 GeV/c2; the observed RMS of the results in each category is taken as the systematic uncertainty. The quadratic sum of these three systematic uncertainties is dominated by the variation of the resolution of the mass fit, and is of the order of 10%, reaching 13% for the 0–10% centrality bin. As was the case for the J/ψ selection, a simple counting of the yield in the signal region after the subtraction of the same-sign spectrum leads to consistent results.
5 Acceptance and efficiency
5.1 Acceptance
The dimuon acceptance,A, is defined as the fraction of µ+µ− pairs for which both muons are declared detectable in the CMS detector with respect to all muon pairs produced in
|y|<2.4,
A(pT, y;λθ) =
Ndetectableµµ (pT, y;λθ)
Ngeneratedµµ (pT, y;λθ)
, (5.1)
JHEP05(2012)063
(GeV/c) T p
0 2 4 6 8 10 12 14 16 18 20
Acceptance
0 0.1 0.2 0.3 0.4 0.5 0.6 0.7 0.8
ψ
J/
(1S)
ϒ
= 2.76 TeV s
pp
PYTHIA + EvtGen + PHOTOS CMS Simulation
|y| < 2.4
|y|
0 0.2 0.4 0.6 0.8 1 1.2 1.4 1.6 1.8 2 2.2 2.4
Acceptance
0 0.1 0.2 0.3 0.4 0.5 0.6 0.7 0.8
ψ
J/
> 6.5 GeV/c)
T
(p
ψ
J/ (1S)
ϒ
= 2.76 TeV s
pp
PYTHIA + EvtGen + PHOTOS CMS Simulation
Figure 6. Dimuon acceptance as a function ofpT (left) and |y|(right) for J/ψ (red squares) and
Υ(1S) (green diamonds). Also shown in the right panel is the acceptance for J/ψwithpT>6.5 GeV/c
(open black squares). The error bars represent the statistical uncertainties only.
• Nµµdetectable is the number of generated events in a given quarkonium (pT, y) bin in
the MC simulation, for which both muons are detectable according to the selections defined in eqs. (3.1) and (3.2);
• Nµµgenerated is the number of all µ+µ− pairs generated within the considered (pT, y) bin.
The acceptance depends on thepTandy of theµ+µ−pair, and the polarization parameter λθ. Different polarizations of the J/ψ and Υ(1S) will cause different single-muon angular distributions in the laboratory frame and, hence, different probabilities for the muons to fall inside the CMS detector acceptance. Since the quarkonium polarization has not been measured in heavy-ion or pp collisions at √sNN = 2.76 TeV, the prompt J/ψ and Υ(1S) results are quoted for the unpolarized scenario only. For non-prompt J/ψ the results are reported for the polarization predicted by evtgen. The impact of the polarization on the acceptance is studied for the most extreme polarization scenarios in the Collins-Soper and helicity frames. For fully longitudinal (transverse) polarized J/ψ in the Collins-Soper frame, the effect is found to be at most −20% (6%). In the helicity frame, the effects are at most 40% and −20% for the two scenarios. For Υ(1S) the polarization effects range between −20% for longitudinal polarization in the Collins-Soper frame to 40% for transverse polarization in the helicity frame.
The acceptance is calculated using the MC sample described in section 3.1. The pT
and rapidity dependencies of the J/ψ and Υ(1S) acceptances are shown in figure 6. Since the acceptance is a function of both pT and y, uncertainties in the predicted
JHEP05(2012)063
to 1.3 over the range 0 < |y| < 2.4 and 0 < pT < 30 GeV/c (20 GeV/c) for J/ψ (Υ(1S)).The RMS of the resulting changes in the acceptance for each pT and y bin are summed
in quadrature to compute the overall systematic uncertainty from this source. The largest relative systematic uncertainties obtained are 4.2%, 3.2%, and 2.8% for the prompt J/ψ, non-prompt J/ψ, and Υ(1S) acceptances, respectively.
5.2 Efficiency
The trigger, reconstruction, and selection efficiencies of µ+µ− pairs are evaluated using simulated MC signal events embedded in simulated PbPb events, as described in section3.1. The overall efficiency is calculated, in each analysis bin, as the fraction of generated events (passing the single muon phase space cuts) where both muons are reconstructed, fulfil the quality selection criteria and pass the trigger requirements. In the embedded sample, the signal over background ratio is by construction higher than in data, so the background contribution underneath the resonance peak is negligible and the signal is extracted by simply counting theµ+µ− pairs in the quarkonium mass region. The counting method is crosschecked by using exactly the same fitting procedure as if the MC events were collision data. Only muons in the kinematic region defined by eqs. (3.1) and (3.2) are considered.
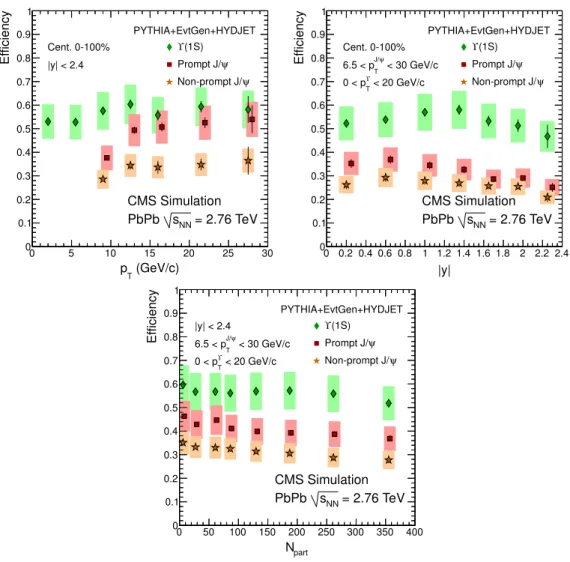
In figure7, the efficiencies are shown as a function of theµ+µ−pairpT,y, and the event centrality, for each signal: red squares for prompt J/ψ, orange stars for non-prompt J/ψ, and green diamonds for Υ(1S). As discussed in section 4.1.2, the efficiency of non-prompt J/ψis lower than that of prompt J/ψ, reaching about 35% forpT>12 GeV/c. The prompt J/ψefficiency increases with pT until reaching a plateau slightly above 50% atpT of about
12 GeV/c, while the Υ(1S) efficiency is∼55%, independent of pT. The efficiencies decrease
slowly as a function of centrality because of the increasing occupancy in the silicon tracker; the relative difference between peripheral and central collisions is 17% for J/ψand 10% for Υ(1S). The integrated efficiency values are 38.3%, 29.2%, and 54.5% for the prompt J/ψ, non-prompt J/ψ (both with 6.5< pT <30 GeV/c, |y|< 2.4, and 0–100% centrality), and
Υ(1S) (with 0< pT <20 GeV/c,|y|<2.4, and 0–100% centrality), respectively.
The systematic uncertainty on the final corrections due to the kinematic distributions is estimated by a±30% variation of the slopes of the generatedpTand rapidity shapes, similar
to the acceptance variation described in the previous section. The systematic uncertainties are in the ranges 1.8–3.4%, 2.2–4.2%, and 1.4–2.7% for prompt J/ψ, non-prompt J/ψ, and Υ(1S), respectively, including the statistical precision of the MC samples.
JHEP05(2012)063
(GeV/c) T p
0 5 10 15 20 25 30
E ff ic ie n c y 0 0.1 0.2 0.3 0.4 0.5 0.6 0.7 0.8 0.9 1 (1S) ϒ ψ Prompt J/ ψ Non-prompt J/ CMS Simulation = 2.76 TeV
NN
s PbPb
PYTHIA+EvtGen+HYDJET
Cent. 0-100%
|y| < 2.4
|y|
0 0.2 0.4 0.6 0.8 1 1.2 1.4 1.6 1.8 2 2.2 2.4
E ff ic ie n c y 0 0.1 0.2 0.3 0.4 0.5 0.6 0.7 0.8 0.9 1 (1S) ϒ ψ Prompt J/ ψ Non-prompt J/ Cent. 0-100%
< 30 GeV/c ψ
J/ T
6.5 < p
< 20 GeV/c ϒ
T
0 < p
CMS Simulation = 2.76 TeV
NN s PbPb PYTHIA+EvtGen+HYDJET part N
0 50 100 150 200 250 300 350 400
E ff ic ie n c y 0 0.1 0.2 0.3 0.4 0.5 0.6 0.7 0.8 0.9 1 (1S) ϒ ψ Prompt J/ ψ Non-prompt J/ CMS Simulation = 2.76 TeV
NN
s PbPb
PYTHIA+EvtGen+HYDJET
|y| < 2.4
< 30 GeV/c ψ
J/ T
6.5 < p
< 20 GeV/c ϒ
T
0 < p
Figure 7. Combined trigger, reconstruction, and selection efficiencies as a function of quarkonium
pT and |y|, and event centrality, for each signal: red squares and orange stars for prompt and
non-prompt J/ψ, respectively, and green diamonds for Υ(1S). For better visibility, the prompt J/ψ points are shifted by ∆pT = 0.5 GeV/c, ∆y = 0.05, and ∆Npart = 2. Statistical (systematic)
uncertainties are shown as bars (boxes). The systematic uncertainties are the quadratic sum of the uncertainty on the kinematic distributions and the MC validation uncertainty.
forµ+µ− pairs are directly obtained from the MC simulation, rather than as a product of the partial components.
The fits are performed fortag-probepairs with apTabove 6.5 GeV/cas this is the region
measured over the full rapidity range, with and without applying the probed selection on one of the muons:
1. The trigger efficiency is estimated by measuring the fraction of global muons (used as probes) associated to the double-muon trigger in an event sample selected by tag-muons associated to a single-muon trigger. A Crystal Ball function is used to describe the J/ψ peak. The pµT and ηµ dependencies of the trigger efficiency are compatible between data and MC. For J/ψwithpT>6.5 GeV/c, thepµT andηµintegrated trigger
JHEP05(2012)063
2. Standalone muons passing the quality selections required in this analysis are usedto evaluate the efficiency of the silicon tracker reconstruction, which includes losses induced by the matching between the silicon-tracker track and the muon detector track, and by the imposed quality selection criteria (both on the global track and on its silicon-tracker segment). For this efficiency measurement, the signal is fitted with a Gaussian function and the background with a second-order polynomial. A Gaussian, rather than a Crystal Ball function, is used because of the poor momen-tum resolution of the standalone muons. No pT > 6.5 GeV/c requirement was used,
since the poorer momentum resolution of standalone muons would have biased the measurement. The single-muon efficiencies measured in MC and data of 84.9% and (83.7+5−5..73)%, respectively, are in good agreement.
The systematic uncertainty of the muon pair efficiency, 13.7%, is determined by comparing thetag-and-probe efficiencies evaluated in PbPb data and MC samples, and is dominated by the statistical uncertainties of the measurements. The standalone muon reconstruction efficiency (99% in the plateau) cannot be probed with silicon-tracker tracks because of the large charged particle multiplicity in PbPb collisions. Since this part of the reconstruction is identical to that used for pp data, a systematic uncertainty of 1%, reported in ref. [53], is assumed.
6 The pp baseline measurement
A pp run at √s = 2.76 TeV was taken in March 2011. The integrated luminosity was 231 nb−1, with an associated uncertainty of 6%. For hard-scattering processes, the integrated luminosity of the pp sample is comparable to that of the PbPb sample (7.28µb−1·2082 ≈315 nb−1).
Given the higher instantaneous luminosity, the Level-1 trigger required slightly higher quality muons in the pp run than in the PbPb run. The offline event selection is the same as in the PbPb analysis, only slightly relaxed for the HF coincidence requirement: instead of three towers, only one tower with at least 3 GeV deposited is required in the pp case. The same reconstruction algorithm, i.e. the one optimized for the heavy-ion environment, is used for both pp and PbPb data. The products of the trigger, reconstruction, and selection efficiencies determined in pp MC simulations are 42.5%, 34.5%, and 55.1% for the prompt J/ψ, non-prompt J/ψ (both with 6.5< pT<30 GeV/c,|y|<2.4), and Υ(1S) (with
0< pT <20 GeV/c,|y|<2.4), respectively.
tag-and-JHEP05(2012)063
) 2 (GeV/c µ µ m2.6 2.7 2.8 2.9 3 3.1 3.2 3.3 3.4 3.5
)
2
Events / ( 0.02 GeV/c
0 50 100 150 200 250
300 CMS pp s = 2.76 TeV
-1
= 231 nb
int
L
|y| < 2.4
< 30 GeV/c
T
6.5 < p σ = 36 MeV/c2
data total fit
bkgd + non-prompt background
(mm)
ψ
J/
l
-1 -0.5 0 0.5 1 1.5 2
Events / (0.088 mm)
1 10 2 10 3 10
= 2.76 TeV s
CMS pp
-1
= 231 nb
int
L |y| < 2.4
< 30 GeV/c
T
6.5 < p
data total fit bkgd + non-prompt background
Figure 8. Non-prompt J/ψsignal extraction for pp collisions at√s= 2.76 TeV: dimuon invariant mass fit (left) and pseudo-proper decay length fit (right).
probe efficiencies evaluated in data and MC samples, and is dominated by the statistical uncertainties of the measurements.
The quarkonium signals in pp collisions are extracted following the same methods as in PbPb collisions, described in sections4.1and 4.2, apart from the non-prompt J/ψsignal extraction: the four Gaussians of the lifetime resolution are fixed to the MC values because of the lack of events in the dimuon mass sidebands. The systematic uncertainty on the signal extraction in pp is 10% for Υ(1S) and varies, depending onpT and rapidity, between
0.4 and 6.2% for prompt J/ψand between 5 and 20% for non-prompt J/ψ. The fit results for the prompt and non-prompt J/ψyield extraction are shown in figure8for|y|<2.4 and 6.5< pT<30 GeV/c. The numbers of prompt and non-prompt J/ψmesons in this rapidity
and pT range are 820±34 and 206±20, respectively.
The invariant-mass spectrum ofµ+µ−pairs in the Υ region from pp collisions is shown in figure9. The same procedure as the one described for the PbPb analysis is used. The number of Υ(1S) mesons with |y|<2.4 and 0< pT <20 GeV/c is 101±12. The fit result
of the excited states is discussed in [25].
The differential cross section results include the systematic uncertainties of the recon-struction efficiency and acceptance, estimated in the same way as for the PbPb analysis. The systematic uncertainties on the efficiencies are 1.6–3%, 1.4–2%, and 0.4–0.9% for prompt J/ψ, non-prompt J/ψ, and Υ(1S), respectively. The uncertainty on the acceptance is identical in the pp and PbPb analyses.
For the measurement of the nuclear modification factors, in which the ratio of PbPb to pp results is computed, most of the reconstruction systematic uncertainties cancel out because the same algorithm is used. However, the following factors must be accounted for:
JHEP05(2012)063
) 2 (GeV/c
µ µ
m
7 8 9 10 11 12 13 14
)
2
Events / ( 0.14 GeV/c
0 10 20 30 40 50 60 70
80 CMS pp s = 2.76 TeV
|y| < 2.4
< 20 GeV/c
T
0 < p
-1
= 231 nb
int
L > 4 GeV/c µ
T
p
(fixed to MC)
2
= 92 MeV/c σ
data
fit
Figure 9. The pp dimuon invariant-mass distribution in the rangepT<20 GeV/cfor|y|<2.4 and
the result of the fit to the Υ resonances.
the PbPb yield is normalized by the number of minimum-bias events, which has a negligible uncertainty, no systematic uncertainty on the PbPb luminosity has to be considered.
2. The uncertainty on TAA. For results integrated over centrality, this is a global sys-tematic uncertainty of 5.7%, based on the Glauber model employed. For results as a function of centrality, the uncertainty varies between a minimum of 4.3% in the most central bin and a maximum of 15% in the most peripheral bin [37].
3. The systematic uncertainty associated with the trigger efficiency. The ratios between thetag-and-probe efficiencies obtained in pp and PbPb are the same in data and MC events, within the statistical accuracy of the data (1% for the single-muon efficiency). Twice this value (2%) is assigned as the uncertainty on the difference of the trigger efficiencies of µ+µ− pairs in PbPb and pp collisions.
4. The tracking efficiency uncertainty due to different charged particle multiplicities in pp and PbPb collisions. The ratios between thetag-and-probe efficiencies obtained in pp and central PbPb events are the same in data and MC events, within the statistical accuracy of the data (6.8% for the single-muon efficiency). This value is propagated as the tracking systematic uncertainty in all the ratios of PbPb to pp data.
7 Results
The double-differential quarkonium cross sections in PbPb collisions are reported in the form
1
TAA · d2N
dydpT
= 1
TAANMB ·
1 ∆y∆pT ·
NQQ
JHEP05(2012)063
while in pp collisions they are calculated asd2σ
dydpT
= 1
Lpp ·
1 ∆y∆pT ·
NQQ
A ε , (7.2)
where:
• NQQ is the number of measured prompt J/ψ, non-prompt J/ψ, or Υ(1S) in theµ+µ−
decay channel;
• NMB is the number of minimum-bias events sampled by the event selection; when
binned in centrality, only the fraction of minimum-bias events in that centrality bin is considered;
• A is the geometric acceptance, which depends on the pT and y of the quarkonium
state;
• εis the combined trigger and reconstruction efficiency, which depends on thepT and y of the quarkonium state and on the centrality of the collision;
• ∆y and ∆pT are the bin widths in rapidity andpT, respectively;
• TAA is the nuclear overlap function, which depends on the collision centrality;
• Lpp = (231±14) nb−1 is the integrated luminosity of the pp data set.
Following eq. (7.1), the uncorrected yields of inclusive, prompt and non-prompt J/ψ, and Υ(1S), measured in PbPb collisions are corrected for acceptance and efficiency (re-ported in figures6and7), and converted into yields divided by the nuclear overlap function
TAA. These quantities can be directly compared to cross sections in pp collisions measured from the raw yields according to eq. (7.2). The rapidity and centrality-dependent results are presented integrated overpT. All results are presented for the unpolarized scenario and
are tabulated in tables6–13 of appendix A.
The systematic uncertainties detailed in the previous sections are summarized in ta-bles 2 and 3. The relative uncertainties for all terms appearing in eqs. (7.1) and (7.2) are added in quadrature, leading to a total of 15–21% on the corrected yields. For results plotted as a function ofpTor rapidity, the systematic uncertainty onTAA enters as a global uncertainty on the scale and is not included in the systematic uncertainties of the yields. As a function of centrality, the uncertainty onTAA varies point-to-point and is included in the systematic uncertainties of the yields.
The nuclear modification factor,
RAA = Lpp
TAANMB
NPbPb(QQ) Npp(QQ) ·
εpp εPbPb
, (7.3)
is calculated from the raw yields NPbPb(QQ) and Npp(QQ), correcting only for the
multiplicity-dependent fraction of the efficiency ( εpp
εPbPb ∼1.16 for the most central bin);
JHEP05(2012)063
prompt J/ψ(%) non-prompt J/ψ(%) Υ(1S) (%)Yield extraction 0.5–5.7 1.5–14.0 8.7–13.4
Efficiency 1.8–3.4 2.2–4.2 1.4–2.7
Acceptance 0.9–4.2 2.0–3.2 1.5–2.8
MC Validation 13.7 13.7 13.7
Stand-aloneµreco. 1.0 1.0 1.0
TAA 4.3–15.0 4.6–8.6 4.3–8.6
Total 15–21 15–21 18–20
Table 2. Point-to-point systematic uncertainties on the prompt J/ψ, non-prompt J/ψ, and Υ(1S) yields measured in PbPb collisions.
prompt J/ψ(%) non-prompt J/ψ(%) Υ(1S) (%)
Yield extraction 0.8–5.3 5.3–16.8 10.0
Efficiency 1.6–3.0 1.4–2.0 0.4–0.9
Acceptance 0.9–4.2 2.0–3.2 1.5–2.8
MC Validation 13.7 13.7 13.7
Stand-aloneµreco. 1.0 1.0 1.0
Total 14–16 15–22 17–18
Table 3. Point-to-point systematic uncertainties on the prompt J/ψ, non-prompt J/ψ, and Υ(1S) yields measured in pp collisions.
also tabulated in appendixA. It should be noted that theRAAwould be sensitive to changes of the J/ψpolarization between pp and PbPb collisions, an interesting physics effect on its own [54].
In all figures showing results, statistical uncertainties are represented by error bars and systematic uncertainties by boxes. Results as a function of rapidity are averaged over the positive and negative rapidity regions.
7.1 Inclusive and prompt J/ψ
The inclusive and prompt J/ψ differential yields in PbPb collisions, divided by TAA, are shown in the left panel of figure 10 as a function of pT, for |y|<2.4 and integrated over
centrality. The corresponding pp cross sections are also shown. The suppression of the prompt J/ψ yield by a factor of ∼3 with respect to pp is easier to appreciate through the RAA observable, shown in the right panel of figure 10. The RAA measurements do not exhibit a pT dependence over the measured pT range, while there is an indication of less suppression in the most forward rapidity bin (1.6 < |y| < 2.4) in comparison to the mid-rapidity bin, as shown in figure 11. At forward rapidity, in addition to 6.5 < pT <30 GeV/c the nuclear modification factor is measured for lowerpT (down to 3 GeV/c)
JHEP05(2012)063
(GeV/c) T p
0 5 10 15 20 25 30
(nb c/GeV) T
/dydp
σ
2
or d T
N/dydp
2
d
AA
1/T10-2 -1
10 1
10 Inclusive J/ψ (PbPb) (pp)
(PbPb)
ψ
Prompt J/ (pp)
= 2.76 TeV
NN
s CMS pp & PbPb
Cent. 0-100% |y| < 2.4
(GeV/c) T p
0 5 10 15 20 25 30
AA R 0 0.2 0.4 0.6 0.8 1 1.2 1.4 ψ Prompt J/
= 2.76 TeV
NN
s CMS PbPb
Cent. 0-100% |y| < 2.4
Figure 10. Left: yield of inclusive J/ψ (blue circles) and prompt J/ψ (red squares) divided by
TAA as a function of pT. The results are compared to the cross sections of inclusive J/ψ (black
triangles) and prompt J/ψ (black crosses) measured in pp. The global scale uncertainties on the PbPb data due to TAA (5.7%) and the pp integrated luminosity (6.0%) are not shown. Right: nuclear modification factorRAA of prompt J/ψas a function of pT. A global uncertainty of 8.3%,
fromTAAand the integrated luminosity of the pp data sample, is shown as a grey box atRAA= 1. Points are plotted at their measured average pT. Statistical (systematic) uncertainties are shown
as bars (boxes). Horizontal bars indicate the bin width.
|y|
0 0.2 0.4 0.6 0.8 1 1.2 1.4 1.6 1.8 2 2.2 2.4
/dy (nb)
σ
dN/dy or d
AA 1/T 0 2 4 6 8 10 12 14 16 18 20 (PbPb) ψ
Inclusive J/ (pp)
(PbPb)
ψ
Prompt J/ (pp)
= 2.76 TeV
NN
s CMS pp & PbPb
Cent. 0-100% 6.5 < pT < 30 GeV/c
|y|
0 0.2 0.4 0.6 0.8 1 1.2 1.4 1.6 1.8 2 2.2 2.4
AA R 0 0.2 0.4 0.6 0.8 1 1.2 1.4 ψ Prompt J/
= 2.76 TeV
NN
s CMS PbPb
Cent. 0-100% < 30 GeV/c
T
6.5 < p
JHEP05(2012)063
part N
0 50 100 150 200 250 300 350 400
/dy (nb)
σ
dN/dy or d
AA
1/T
0 2 4 6 8 10 12
(PbPb)
ψ
Inclusive J/ (pp)
(PbPb)
ψ
Prompt J/ (pp)
= 2.76 TeV
NN
s CMS pp & PbPb
|y| < 2.4
< 30 GeV/c
T
6.5 < p
part N
0 50 100 150 200 250 300 350 400
AA
R
0 0.2 0.4 0.6 0.8 1 1.2 1.4
ψ
Prompt J/
= 2.76 TeV
NN
s CMS PbPb
|y| < 2.4
< 30 GeV/c
T
6.5 < p
Figure 12. Left: yield of inclusive J/ψ (blue circles) and prompt J/ψ (red squares) divided byTAA as a function ofNpart. The results are compared to the cross sections of inclusive J/ψ(black triangle)
and prompt J/ψ (black cross) measured in pp. The inclusive J/ψ points are shifted by ∆Npart= 2
for better visibility. Right: nuclear modification factorRAA of prompt J/ψ as a function ofNpart.
A global uncertainty of 6%, from the integrated luminosity of the pp data sample, is shown as a grey box atRAA= 1. Statistical (systematic) uncertainties are shown as bars (boxes).
The inclusive J/ψyield in PbPb collisions divided byTAA, integrated over thepT range
6.5–30 GeV/c and |y|<2.4, is shown in the left panel of figure 12 as a function of Npart.
Also included is the prompt J/ψ yield, which exhibits the same centrality dependence as the inclusive J/ψ: from the 50–100% centrality bin (hNparti= 22.1) to the 10% most central
collisions (hNparti= 355.4) the yield divided by TAA falls by a factor of∼2.6. The results are compared to the cross sections measured in pp, showing that prompt J/ψ are already suppressed in peripheral PbPb collisions. The RAA of prompt J/ψ as a function of Npart
is shown in the right panel of figure 12: a suppression of ∼5 is observed in the 10% most central PbPb collisions with respect to pp. This suppression is reduced in more peripheral collisions, reaching a factor of∼1.6 in the 50–100% centrality bin.
7.2 Non-prompt J/ψ
The uncorrected fraction of non-prompt J/ψ is obtained from the two-dimensional fit to the invariant mass and ℓJ/ψ spectra discussed in section 4.1.2. To obtain the corrected b fraction, which is the ratio of non-prompt to inclusive J/ψ, the raw fraction is corrected for the different reconstruction efficiencies and acceptances for prompt and non-prompt J/ψ. The b fraction in pp and in PbPb (integrated over centrality) at√sNN = 2.76 TeV is presented in figure 13 as a function of pT, for several rapidity bins, together with results from CDF [42] and CMS [27] at other collision energies. There is good agreement, within uncertainties, between the earlier results and the present measurements.
The non-prompt J/ψ yield in PbPb collisions divided by TAA, integrated over the pT
JHEP05(2012)063
(GeV/c)
T
p
0 5 10 15 20 25 30
b fraction
0 0.1 0.2 0.3 0.4 0.5 0.6 0.7 0.8 0.9 1
= 2.76 TeV (|y|<2.4)
NN
s CMS PbPb
= 2.76 TeV (1.6<|y|<2.4)
NN
s CMS PbPb
= 2.76 TeV (|y|<2.4) s
CMS pp
= 2.76 TeV (1.6<|y|<2.4) s
CMS pp
= 7 TeV (1.6 < |y| < 2.4) s
CMS pp
= 7 TeV (1.2 < |y| < 1.6) s
CMS pp
= 7 TeV (|y| < 1.2) s
CMS pp
= 1.96 TeV (|y|<0.6) s
p CDF p
Figure 13. b fraction of J/ψ production in pp and PbPb collisions at √sNN = 2.76 TeV as a function ofpTfor the rapidity bins|y|<2.4 and 1.6<|y|<2.4, compared to b fractions measured
by CDF in pp collisions at√s= 1.96 TeV [42] and by CMS in pp collisions at√s = 7 TeV [27]. Points are plotted at their measured average pT. Statistical (systematic) uncertainties are shown
as bars (boxes).
Npart, together with the pp cross section. Non-prompt J/ψ are suppressed by a factor of ∼2.6 with respect to pp collisions, as can be seen in the right panel of figure 14. The suppression does not exhibit a centrality dependence, but the most peripheral centrality bin (20–100%, hNparti = 64.2) is very broad. Hard processes, such as quarkonium and
b-hadron production, are produced following a scaling with the number of nucleon-nucleon collisions, thus most events in such a large bin occur towards its most central edge.
7.3 Υ(1S)
In figure 15, the Υ(1S) yield divided by TAA in PbPb collisions and its cross section in pp collisions are shown as a function of pT; the RAA of Υ(1S) is displayed in the right panel of figure 15. The pT dependence shows a significant suppression, by a factor of ∼2.3 at low pT, that disappears for pT > 6.5 GeV/c. The rapidity dependence indicates a slightly
smaller suppression at forward rapidity, as shown in figure 16. However, the statistical uncertainties are too large to draw strong conclusions on any pT or rapidity dependence. The Υ(1S) yield in PbPb collisions divided by TAA and the Υ(1S) RAA are presented as a function ofNpart in the left and right panels of figure17, respectively. Within uncertainties,
JHEP05(2012)063
part N
0 50 100 150 200 250 300 350 400
/dy (nb)
σ
dN/dy or d
AA 1/T 0 0.5 1 1.5 2 2.5 (PbPb) ψ
Non-prompt J/ (pp)
= 2.76 TeV
NN
s CMS pp & PbPb
|y| < 2.4
< 30 GeV/c
T
6.5 < p
0-20% 20-100%
part N
0 50 100 150 200 250 300 350 400
AA R 0 0.2 0.4 0.6 0.8 1 1.2 1.4 ψ Non-prompt J/
= 2.76 TeV
NN
s CMS PbPb
|y| < 2.4
< 30 GeV/c
T
6.5 < p
0-20% 20-100%
Figure 14. Left: non-prompt J/ψ yield divided by TAA (orange stars) as a function of Npart
compared to the non-prompt J/ψcross section measured in pp (black cross). Right: nuclear mod-ification factor RAA of non-prompt J/ψ as a function ofNpart. A global uncertainty of 6%, from
the integrated luminosity of the pp data sample, is shown as a grey box atRAA = 1. Statistical (systematic) uncertainties are shown as bars (boxes).
(GeV/c) T p
0 2 4 6 8 10 12 14 16 18 20
(nb c/GeV) T
/dydp
σ
2
or d T
N/dydp 2 d AA 1/T -2 10 -1 10 (1S) (PbPb) ϒ (pp)
= 2.76 TeV
NN
s CMS pp & PbPb
Cent. 0-100% |y| < 2.4 Cent. 0-100% |y| < 2.4
(GeV/c) T p
0 2 4 6 8 10 12 14 16 18 20
AA R 0 0.5 1 1.5 2 2.5 (1S) ϒ
= 2.76 TeV
NN
s CMS PbPb
Cent. 0-100% |y| < 2.4
Figure 15. Left: Υ(1S) yield divided by TAA in PbPb collisions (green diamonds) as a function of pT. The result is compared to the cross section measured in pp collisions (black crosses). The
global scale uncertainties on the PbPb data due to TAA (5.7%) and the pp integrated luminosity (6.0%) are not shown. Right: nuclear modification factor RAA of Υ(1S) as a function of pT. A
global uncertainty of 8.3%, fromTAAand the integrated luminosity of the pp data sample, is shown as a grey box atRAA= 1. Points are plotted at their measured averagepT. Statistical (systematic)
JHEP05(2012)063
|y|
0 0.2 0.4 0.6 0.8 1 1.2 1.4 1.6 1.8 2 2.2 2.4
/dy (nb)
σ
dN/dy or d
AA 1/T 0 0.2 0.4 0.6 0.8 1 1.2 1.4 1.6 1.8 (1S) (PbPb) ϒ (pp)
= 2.76 TeV
NN
s CMS pp & PbPb
Cent. 0-100% < 20 GeV/c
T
0 < p
|y|
0 0.2 0.4 0.6 0.8 1 1.2 1.4 1.6 1.8 2 2.2 2.4
AA R 0 0.2 0.4 0.6 0.8 1 1.2 1.4 (1S) ϒ
= 2.76 TeV
NN
s CMS PbPb
Cent. 0-100% < 20 GeV/c
T
0 < p
Figure 16. Left: Υ(1S) yield divided byTAAin PbPb collisions (green diamonds) as a function of rapidity. The result is compared to the cross section measured in pp collisions (black crosses). The global scale uncertainties on the PbPb data due to TAA (5.7%) and the pp integrated luminosity (6.0%) are not shown. Right: nuclear modification factorRAA of Υ(1S) as a function of rapidity. A global uncertainty of 8.3%, from TAA and the integrated luminosity of the pp data sample, is shown as a grey box at RAA = 1. Points are plotted at their measured average |y|. Statistical (systematic) uncertainties are shown as bars (boxes). Horizontal bars indicate the bin width.
part N
0 50 100 150 200 250 300 350 400
/dy (pb)
σ
dN/dy or d
AA 1/T 0 0.2 0.4 0.6 0.8 1 1.2 1.4 1.6 1.8 (1S) (PbPb) ϒ (pp)
= 2.76 TeV
NN
s CMS pp & PbPb
|y| < 2.4 < 20 GeV/c
T
0 < p
0-10% 10-20% 20-100%
part N
0 50 100 150 200 250 300 350 400
AA R 0 0.2 0.4 0.6 0.8 1 1.2 1.4 (1S) ϒ
= 2.76 TeV
NN
s CMS PbPb
|y| < 2.4 < 20 GeV/c
T
0 < p
0-10% 10-20%
20-100%
Figure 17. Left: Υ(1S) yield divided byTAA (green diamonds) as a function of Npart compared
to the Υ(1S) cross section measured in pp (black cross). Right: nuclear modification factorRAAof Υ(1S) as a function ofNpart. A global uncertainty of 6%, from the integrated luminosity of the pp
JHEP05(2012)063
8 Discussion
This paper has presented the first measurements of the prompt and non-prompt J/ψ, as well as the Υ(1S) mesons, via their decays into µ+µ− pairs in PbPb and pp collisions at
√s
NN = 2.76 TeV. The results are based on data recorded with the CMS detector from the
first LHC PbPb run in 2010, and from a pp run during March 2011 at√s= 2.76 TeV.
The prompt J/ψ cross section shows a factor of two suppression in central PbPb colli-sions with respect to peripheral collicolli-sions for J/ψ with 6.5< pT <30 GeV/c. With respect
to pp, a nuclear modification factor of RAA = 0.20±0.03 (stat.)±0.01 (syst.) has been measured in the 10% most central collisions. Prompt J/ψ produced in peripheral colli-sions are already suppressed with respect to pp: RAA = 0.61±0.12 (stat.)±0.10 (syst.) in the 50–100% centrality bin. While no pT dependence is observed in the measured pT
range, within uncertainties, less suppression is observed at forward rapidity (RAA = 0.43± 0.06 (stat.)±0.01 (syst.)) than at mid-rapidity (RAA= 0.29±0.04 (stat.)±0.02 (syst.)).
A comparison of the RAA centrality dependence to results measured for pT<5 GeV/c by PHENIX [21] in AuAu collisions at √sNN = 200 GeV shows a similar suppression,
despite the different collision energies and kinematic ranges. Integrated over central-ity, CMS has measured an inclusive J/ψ nuclear modification factor of RAA = 0.41± 0.05 (stat.)±0.02 (syst.) in the most forward rapidity bin (1.6<|y|<2.4) in thepT range
3< pT <30 GeV/c. This result is consistent with the ALICE measurement of an inclusive
J/ψ RAA of ∼0.5 at rapidity 2.5< y <3.25 for pT>3 GeV/c[24].
A strong suppression of non-prompt J/ψ mesons is observed in PbPb collisions when compared to pp collisions. This is the first unambiguous measurement of b-hadron sup-pression in heavy-ion collisions, which is likely connected to in-medium energy loss of b quarks. The average pT of the non-prompt J/ψ in the measured kinematic range is ∼ 10 GeV/c. Based on simulations of b-hadron decays, this translates into an average b-hadron pT of ∼ 13 GeV/c. The suppression of non-prompt J/ψ is of a comparable
magnitude to the charged hadron RAA measured by ALICE [55], which reflects the in-medium energy loss of light quarks. The non-prompt J/ψyield, though strongly suppressed (RAA= 0.37±0.08 (stat.)±0.02(syst.)) in the 20% most central collisions, shows no strong centrality dependence, within uncertainties, when compared to a broad peripheral region (20–100%). Furthermore, this suppression of non-prompt J/ψ is comparable in size to that observed for high-pT single electrons from semileptonic heavy-flavour decays at RHIC [29–
31] in which charm and bottom decays were not separated.
The Υ(1S) yield divided by TAA as a function of pT, rapidity, and centrality has
been measured in PbPb collisions. No strong centrality dependence is observed within the uncertainties. The nuclear modification factor integrated over centrality is RAA = 0.63±0.11 (stat.)±0.09 (syst.). This suppression is observed predominantly at low pT.
Using pp collisions at √s = 1.8 TeV, CDF measured the fraction of directly produced Υ(1S) as (50.9±8.2 (stat.)±9.0 (syst.))% for Υ(1S) withpT >8 GeV/c[56]. Therefore, the
JHEP05(2012)063
9 Summary
In summary, CMS has presented the first measurements of prompt J/ψ, non-prompt J/ψ, and Υ(1S) suppression in PbPb collisions at √sNN = 2.76 TeV. Prompt J/ψ are found to be suppressed, with a strong centrality dependence. By measuring non-prompt J/ψ, CMS has directly observed the suppression of b hadrons for the first time. The measurement of Υ(1S) suppression, together with the suppression of the Υ(2S+3S) states [25], marks the first steps of detailed bottomonium studies in heavy-ion collisions.
Acknowledgments
JHEP05(2012)063
of Turkey, and Turkish Atomic Energy Authority; the Science and Technology FacilitiesCouncil, U.K.; the US Department of Energy, and the US National Science Foundation. Individuals have received support from the Marie-Curie programme and the European Research Council (European Union); the Leventis Foundation; the A. P. Sloan Foundation; the Alexander von Humboldt Foundation; the Belgian Federal Science Policy Office; the Fonds pour la Formation `a la Recherche dans l’Industrie et dans l’Agriculture (FRIA-Belgium); the Agentschap voor Innovatie door Wetenschap en Technologie (IWT-(FRIA-Belgium); the Council of Science and Industrial Research, India; and the HOMING PLUS programme of Foundation for Polish Science, cofinanced from European Union, Regional Development Fund.
A Tables of results
|y| pT centrality Raw yield
[ GeV/c] PbPb pp
0.0–2.4
6.5–30
0–100%
396±24 1026±35
6.5–10 261±20 684±30
10–30 138±14 342±19
0.0–1.2 6.5–30 0–100% 174±16 462±36
1.2–1.6 5.5–30 0–100% 103±13 360±23
6.5–30 90±11 272±21
1.6–2.4 3.0–30 0–100% 446±56 1006±34
6.5–30 150±15 329±19
0.0–2.4 6.5–30
0–10% 113±12 10–20% 80±10 20–30% 63±9 30–40% 58±8 40–50% 45±7 50–100% 37±6 0–20% 193±16 20–100% 205±15
Table 4. Raw yield of inclusive J/ψas a function of J/ψrapidity andpTin PbPb and pp collisions.
JHEP05(2012)063
|y| pT centrality Raw yield
[ GeV/c] PbPb pp
0.0–2.4
0–6.5
0–100%
44±9 75±10
6.5–10 18±5 15±5
10–20 24±6 10±4
0–20 86±12 101±12
0.0–1.2
0–20 0–100% 48±9 66±9
1.2–2.4 40±8 34±7
0.0–2.4 0–20
0–10% 24±7 10–20% 30±7 20–100% 32±6 0–20% 54±9
Table 5. Raw yield of Υ(1S) as a function of Υ(1S) rapidity andpTin PbPb and pp collisions. For
PbPb, the raw yield is also included as a function of collision centrality. All quoted uncertainties are statistical.
|y| pT centrality hpTi T1
AA ·
dN
dy RAA
[ GeV/c] [ GeV/c] [nb]
0.0–2.4
6.5–30
0–100%
9.87 2.40±0.15±0.34±0.14 0.32±0.02±0.01±0.03 6.5–10 8.11 2.05±0.15±0.30±0.12 0.32±0.03±0.02±0.03 10–30 13.22 0.40±0.04±0.06±0.02 0.31±0.04±0.01±0.03 0.0–1.2 6.5–30 0–100% 10.92 2.76±0.26±0.43±0.16 0.29±0.04±0.02±0.02
1.2–1.6 5.5–30 0–100% 9.21 3.57±0.45±0.51±0.20 0.23±0.03±0.02±0.02 6.5–30 9.65 2.29±0.28±0.33±0.13 0.28±0.04±0.02±0.02
1.6–2.4 3.0–30 0–100% 6.27 21.18±2.65±3.18±1.21 0.41±0.05±0.02±0.03 6.5–30 8.92 2.22±0.21±0.32±0.13 0.40±0.05±0.01±0.03
0.0–2.4 6.5–30
0–10% 10.39 1.78±0.20±0.27 0.24±0.03±0.02±0.01 10–20% 9.70 1.92±0.24±0.30 0.26±0.03±0.02±0.02 20–30% 10.23 2.37±0.33±0.38 0.31±0.04±0.02±0.02 30–40% 9.27 3.73±0.53±0.63 0.50±0.07±0.05±0.03 40–50% 9.29 5.22±0.81±0.95 0.70±0.11±0.08±0.04 50–100% 9.64 4.67±0.80±0.97 0.62±0.11±0.10±0.04 0–20% 9.27 1.84±0.15±0.28 0.25±0.02±0.02±0.02 20–100% 9.29 3.46±0.26±0.58 0.46±0.04±0.04±0.03
Table 6. Yield per unit of rapidity of inclusive J/ψdivided byTAAand nuclear modification factor
RAA as a function of J/ψ rapidity, pT, and collision centrality. The averagepT value for each bin
![Table 1. Average and root-mean-square (RMS) values of the number of participating nucleons (N part ) and of the nuclear overlap function (T AA ) for the centrality bins used in this analysis [37].](https://thumb-eu.123doks.com/thumbv2/123dok_br/16300352.186051/6.892.272.621.526.776/average-participating-nucleons-nuclear-overlap-function-centrality-analysis.webp)