The relationship between
sovereign risk and bank risk
Trabalho Final na modalidade de Dissertação apresentado à Universidade Católica Portuguesa
para obtenção do grau de mestre em Finanças
por
Ricardo Alfredo Teixeira da Costa Branco
sob orientação de
Professor João Filipe Monteiro Pinto
Católica Porto Business School Abril 2016
Acknowledgements
Having reached to the end of another journey, I would like to acknowledge everyone that contributed to this thesis.
My first words of gratitude are undoubtedly to Professor João Pinto for his guidance and support but also because of the extra motivation provided that allowed me to exceed my expectations. This work was an important chance to learn even more and, without a question, this objective was reached.
To my family, who supported this journey from the beginning, although the many obstacles faced, always encouraging myself to never give up: as they usually say “calm waters does not make a good sailor”.
Finally, a word to my son and my wife. I knew that this journey would be very demanding to myself, but I realized that it was also extremely challenging to them.
Resumo
O principal objetivo desta dissertação passa por estudar empiricamente a relação entre o risco bancário e o risco soberano. Paralelamente, e controlando por variáveis micro e macroeconómicas, estudou-se ainda o efeito causado pela crise financeira e pelo programa de compra de obrigações hipotecárias por parte do Banco Central Europeu (BCE) no spread de crédito de obrigações emitidas por bancos da europa ocidental entre 1 de Janeiro de 2000 e 31 de Dezembro de 2011. A amostra utilizada, que serviu de base para a elaboração da análise empírica, é composta por 16,860 observações, dividindo-se em três categorias de obrigações: Obrigações Hipotecárias (covered bonds) – 10.920 observações; Obrigações tradicionais (bank bonds) – 5.695 observações; e obrigações garantidas por créditos (securitization bonds) – 245 observações.
Tendo por base a análise estatística realizada, concluiu-se que a crise financeira de 2007/2008 teve um impacto substancial no aumento do risco bancário, já que os spreads praticados após o seu início aumentaram substancialmente. Concluímos também que (i) o risco soberano influencia o spread das obrigações emitidas pelos bancos , após controlar por variáveis micro e macroeconómicas; (ii) em tempos de crise financeira a relação entre o risco soberano e o risco bancário torna-se mais estreita; e (iii) este efeito verifica-se para Covered Bonds e Bank Bonds, mas não para Securitization Bonds, tendo subjacente qualquer uma das três proxies utilizadas para medir o risco soberano (Rating, Yields de obrigações e CDS). Relativamente ao risco soberano, conclui-se que os CDS são a proxy do risco soberano que influencia de forma mais significativa as obrigações emitidas pelos bancos. Conclui-se ainda que os países com melhor solidez financeira fornecem uma rede de proteção aos “seus” bancos em tempos de crise. Adicionalmente, concluiu-se que o programa de compra de
obrigações hipotecárias por parte do BCE atingiu os seus objectivos primários, permitindo uma redução do custo de financiamento dos bancos. No entanto, com o início da crise da dívida soberana os seus efeitos foram-se desvanecendo. Os resultados obtidos mantêm-se mesmo quando são introduzidas variáveis contabilísticas e financeiras dos bancos nos modelos de regressão.
Palavras-chave: Risco Bancário, Risco Soberano, Spread de crédito, Obrigações, Covered Bonds, Securitization, Credit Default Swaps.
Abstract
This dissertation aims to empirically analyze the relationship between Bank Risk and Sovereign Risk. Simultaneously, and controlling for micro and macroeconomic variables, it also examine the impact of both the financial crisis and the first Covered Bond Purchase Programme launched by the European Central Bank on bank bond credit spreads.
Using a sample of 16,860 bonds – 10,920 Covered Bonds; 5,695 Bank Bonds; and 245 Securitization Bonds - issued by Western European banks between January 1, 2000 and December 31, 2011, we found that: (i) the 2007/2008 financial crisis had a significant impact on banking risk, because it led to a rise of banks’ funding costs, as the spreads paid at time of issuance increased substantially; (ii) the sovereign risk affects the bonds spreads , after controlling micro and macroeconomic variables;(iii) specially in times of financial distress, sovereign and bank risk relationship becomes more tight. This effect affects more specifically Covered Bonds (CB) and Bank Bonds (BB), but not Securitization Bonds (SB). To measure sovereign risk, we used three proxies: Rating, Credit Default Swaps (CDS) and Government Bond Yields. We also concluded that CDS are the sovereign risk proxy that influences more significantly bond spreads; countries with better soundness provide a safety net to “their banks” in times of financial crisis; and the ECB Covered Bond Purchase Programme fulfilled their main goals leading to a decrease in credit spreads. However, with the appearance of the Sovereign Debt Crisis, the effects started to fade. For robustness tests, we used bank’s accounting and financial ratios, and the results proved to be the same.
Keywords: Banking Risk, Sovereign Risk, Credit spread, Bonds, Covered Bonds, Securitization, Credit Default Swaps.
Contents
Acknowledgements ... iii Resumo ... v Abstract ... vii Contents ... ix List of figures ... xiList of tables ... xiii
INTRODUCTION ... 15
1. LITERATURE REVIEW ... 20
1.1 Banking vs Sovereign Risk ... 20
1.2 Covered Bond Purchase Programme ... 24
1.3 Sovereign Risk: how to measure it? ... 25
2. HYPOTHESES AND SAMPLE SELECTION ... 27
2.1 Hypotheses ... 27
2.2 Sample Selection ... 30
2.2.1 Description of Variables ... 31
3. UNIVARIATE ANALYSIS ... 44
3.1 Descriptive statistics by Bond Type ... 44
3.2 Credit Spread over time by Issuer Country ... 48
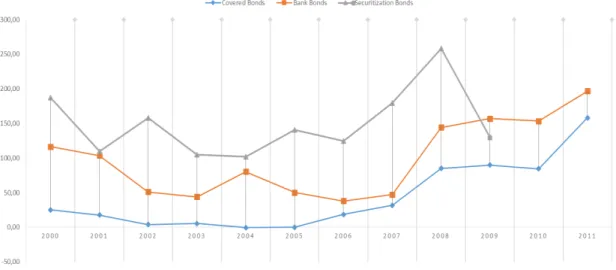
3.3 Credit Spread over time by deal type ... 51
3.4 Spread by Issuer Country and by Bond Type ... 51
3.5 The impact of the Financial Crisis on BB, SB, and CB Credit Spreads ... 54
3.6 Analysis of Covered Bonds (CB), Bank Bonds (BB) and Securitization Bonds (SB). ... 58
4. REGRESSION ANALYSIS ... 60
4.1 Regression Results ... 61
4.1.1 The impact of pricing factors on credit spreads ... 61
4.1.2 Sovereign risk and bank risk ... 71
4.1.3 The 2007-2008 financial crisis and the impacted of sovereign risk on bank risk ... 77
4.1.4 Countries with Triple A and banks funding conditions. ... 82 4.1.5 Countries with international finance assistance and banks funding conditions... 85 4.1.6 The impact of the first Covered Bond Purchase Programme (CBBP) 88 4.1.7 Robustness tests ... 93
5. CONCLUSION ... 98
List of figures
Figure 3.1. Credit spread across time by issuer country ... 48
Figure 3.2. Credit spread across time by issuer country (Germany, Greece, Ireland, Portugal & Spain) ... 49
Figure 3.3 Credit Spread over time by deal type ... 51
Figure 3.4. Credit Spread by Deal Type and Issuer country ... 54
Figure 3.5. Credit Spread by Country Rating for CB ... 56
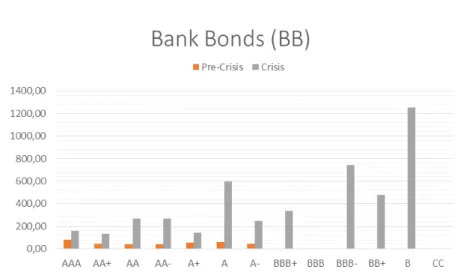
Figure 3.6 Spread by Country Rating, before and after crisis, For BB ... 57
Figure 3.7 Spread by Country Rating, before and after crisis, for SB ... 57
Figure 4.1 Period of Analysis CBPP1 ... 89
List of tables
Table 3.1 Descriptive statistics for BB, CB, and SB ... 45
Table 3.2 Credit spread across time by issuer country ... 50
Table 3.3 Credit Spread by Deal Type and Issuer Country ... 53
Table 3.4. The impact of the Financial Crisis on Credit Spreads ... 55
Table 3.5 Covered bonds, bonds and securitization classification ... 59
Table 4.1 Variables used in the Hypotheses ... 61
Table 4.2 Chow Test for differences on credit spread determinants ... 62
Table 4.3 Regression Analysis on the impact of the independent variables on the credit spread ... 65
Table 4.4 Standardized coefficients of table 4.3 ... 69
Table 4.5 Regression analysis by sovereign risk variable ... 74
Table 4.6 Standardized regress coefficients of table 4.5 ... 76
Table 4.7 Regression analysis on the impact of the financial crisis ... 79
Table 4.8 Standardized coefficients of regressions presented on table 4.7 ... 81
Table 4.9 Regression analysis on the effect of Triple A countries during the financial crisis ... 84
Table 4.10 Regression analysis on the effect of countries under financial assistance during the financial crisis ... 87
Table 4.11 Credit spread values during different periods of analysis ... 90
Table 4.12 Regression analysis on the effect of covered bond purchase programme ... 92
Table 4.13 Regression Analysis on the impact of the independent variables on the credit spread Using Financial Ratios ... 96
Table 4.15 Variables Description, related Empirical Literature, Expected Sign and Findings (1) ... 108 Table 4.16 Variables Description, related Empirical Literature, Expected Sign and Findings (2) ... 109
INTRODUCTION
Since 1929 that the world didn’t observed a financial crisis so severe. The bankruptcy of the investment bank Lehman Brothers1, announced in September
15, 2008 unleashed a financial turmoil that would affect the world. The seriousness of the situation led Henry Paulson2, United States Secretary of
Treasury and Ben Bernanke3, FED’s Chairman, to set up an emergency meeting
in Washington with the senior legislators from both parties of the congress and the senate. The subject was that it was necessary to collect 700 Billion dollars to inject in the financial market to unlock the credit market. Paulson said “Unless
you act, the financial system of this country and the entire world will meltdown in a matter of days”. Bernanke also claimed “If we don’t do this tomorrow we will not have an economy on Monday”. The main consequence of the financial crisis was that the market of banking credit simply frozen, leading to a significant increase in the funding costs of financial institutions. All the banking system is based in a very simple but highly important feeling that it’s trust and despite all the signs, the bailout of Bear Stearns, the nationalization of Fanny Mae and Freddie Mac in September 7, 2008, the bankruptcy of Lehman was the final blow in the market trust. Investors started to wonder if the United States Government saved two of the largest financial institutions and, at the same time would let a bank to fail, them any bank could go bankrupt. The problem was that with the
1Lehman Brothers Holdings Inc. was an investment and a global financial services bank. Was founded in
1850 and announced its bankruptcy in 15th September of 2008 mainly because its exposure to the subprime
crisis. It is commonly accept has the trigger of the financial crisis.
2 Henry Merrit Paulson Jr, also known as Hank Paulson, was the 74º Secretary of treasury of the United
States of America
3 Benjamin Shalom Bernanke (Ben Bernanke) was the president of the Federal Reserve System (FED)
complex connections between the financial institutions all around the world a problem with an American bank would affect banks and financial institutions worldwide. In September 27, 2008 the United Kingdom bail out Bradford & Bingley, in October 3, 2008 Germany gave assistance to Hypo Real, in October 13, 2008 Spain opened a line of credit of one hundred billion Euros, Germany a line of credit of five hundred billions, etc. The existing literature (Zaghini, 2014) has shown that after the onset of the financial crisis, the connection between banks and countries, in terms of risk, became tighter due to the enormous liquidity injections in banks provided by governments. Imperio absenti chaos regit, or “Too Big to Fail4” was an expression that started to be heard as an excuse to some of
the bailouts.
The 2007/2008 financial crisis came to show us, once more, the importance that the financial system has to the economy. Through the period of crisis, several non-financial companies filled bankruptcy, but governments didn´t bailout them as it did with banks. In April, 2012 the Portuguese Central Bank issued an instruction, Nº 15/2012, limiting the rate that banks could pay to depositors. This measure only wanted to limit the funding costs of banks or to stop them from growing to levels that banks could not support. (Beau, Hill, Hussain, & Nixon, 2014) developed an article about bank funding costs. In short, banks finance their activity through retail funding, such as deposits, wholesale funding, such as
4 (Labonte, 2015)states that financial firms are said to be Too Big to Fail when policy makers judge that their
failure would cause unacceptable disruptions to the overall financial system because of their size or interconnectedness. Additionally, this concept leads to another important point that if a firm will not be allowed to fail creates moral hazard. This means that if creditors and counterparties believes that governments will rescue TBTF firms they will have less incentive to monitor their riskiness (Kaufman, 2013) concludes that firms are TBTF when their insolvency is perceived to have material adverse spillover effects on other firms and sectors. In other words they believe that the losses are perceived to do serious collateral damage. Such has (Labonte, 2015), he points an important cost with this special insolvency resolutions that is the moral hazard. He states that this procedure reduces market discipline and encourage excessive risk-taking.
bonds, loans from other banks, repo transactions, covered bonds, asset securitization bonds, and equity. Money is the commodity that banks transacts and if the price of it goes up, the bank has two choices: (i) it absorbs the higher cost of funding, reducing its profitability; or (ii) increases the coupon rates on new loans and, if possible, on existent ones, creating significant difficulties to companies and families. In the worst case scenario, borrowers can simply be unable to repay their loans, which impose losses in banks’ balance sheets with a direct impact in their solvency rations. We can thus conclude that banks’ funding costs can affect the growth of the economy and inflation (deflation) being and important variable in monetary policy.
On May 7, 2009 ECB Executive Board announced a Covered Bond Purchase Programme (CBBP) up to 60 billion Euros. The Decision of the European Central Bank of July 2, 2009 on the implementation of the CBPP (ECB/2009/16) describes the following objectives:
• Promoting the ongoing decline in money market term rates;
• Easing funding conditions for credit institutions and enterprises;
• Encouraging credit institutions to maintain and expand their lending to clients;
• Improving market liquidity in important segments of the private debt securities market.
Using a sample of 16 860 bonds issued by banks during the 2000-2011 period, this work studies the impact of several micro (bond characteristics and banks’ accounting and market data) and macroeconomic variables in bond credit spreads issued by banks. We use three different bond instruments: Bank Bonds5,
5 A bond is a type of debt instrument where basically you lend money to a larger borrower such as a
Covered Bond6, and securitization bonds.7 The onset of the financial crisis,
trigged by the collapse of Lehman Brothers announced in September 15, 2008 is an important mark in this investigation, since one of our objectives is to examine its impact on bond credit spreads issued by Western European banks. We also wonder to determine which variable is the most suitable to be used as a proxy for the Sovereign risk - sovereign credit rating, sovereign credit default swaps or yields on treasury bonds. The guarantees provided implicitly by countries to “their” banks during the financial crisis will also be examined, trying to analyze the role of these guarantees in the cost of funding of banks belonging to triple A countries versus those who were financial assisted. We will also investigate the impact of the ECB CBPP on the bank’s cost of funding.
Our results show that the common pricing determinants of the cost of funding differ significantly between Covered Bonds, Bank Bonds and Securitization Bonds. We demonstrate that the 2007/2008 financial crisis had a significant influence in the cost of funding, namely on CB and BB credit spreads. The sovereign risk, represented by sovereign rating, Credit Default Swaps (CDS) and Government Yields, are important variables in determining the cost of funding, especially in times of financial crisis. Additionally, we conclude that CDS is the variable that better captures sovereign risk. Countries with higher ratings provide a safety net to “their banks” in times of financial crisis. Inversely,
Lender (the bondholder) through periodic interest payments in the form of coupons and to repay the original sum (the principal) in full on a stipulated date, which is known as the bond’s “maturity date.” (Thau, 2011)
6 Covered bonds are debt instruments secured by a cover pool of mortgage loans (property as collateral) or
public-sector debt to which investors have a preferential claim in the event of default. ((ECBC), 2014) (Carbó-Valverde, Rosen, & Rodríguez-Fernández, 2011) (Prokopczuk, B. Siewert, & Vonhoff, 2012)
7 Process where loans are package and sold backed by securities. The most common are Mortgage Backed
Securities (MBS), Asset backed Securities (ABS) and Collateralized debt Obligations (CDO) (Vink & Thibeault, 2008).
countries that had international financial assistance imposed higher funding costs for “their” banks. The Covered Bond Purchase Programme, announced in May 7, 2009 fulfill their main objectives easing funding conditions for credit institutions.
This work contributes to show that different types of funding instruments are differently affected by common pricing factors. It also contributes to a better comprehension of the relation between the sovereign and banking risk, which is very important for public governors because changes on sovereign risk determinants, such as GDP growth, fiscal balance, external balance, inflation (Cantor & Packer, 1996) can affect significantly the funding conditions of banks. Additionally, it empathizes the effects of a financial crisis on bank’s funding conditions and shows the important role played by the soundness of countries in the funding conditions of banks. Finally, it shows that the first CBPP lowered the funding costs of western European banks, achieving one of the main goals of the programme.
The present work is organized as follows: Next section presents the literature review, where prior theoretical and empirical studies regarded the relationship between bank and sovereign risks are reviewed. In section 3 we present the research hypotheses and describe our sample. Section 4 details the descriptive statistics of the three different bank debt instruments used in this study – bonds, covered bonds, and asset securitization bonds. In section 5 the results of the regression analyses are presented and discussed. Finally, section 6 summarizes the dissertation.
1.
LITERATURE REVIEW
With the unwind of the 2007/2008 financial crisis and the massive bank bailouts applied to the financial sector by countries all over the world, the relation between banking8 and sovereign9 risk has been studied by several authors. As
since 1929 that we didn’t had a financial crisis with this magnitude, the empirical studies have succeeded by studying not only the banking and sovereign risk but also what other variables can determine bank’s cost of funding.
1.1 Banking vs Sovereign Risk
(Gómez-Puig, Sosvilla-Rivero, & K.Singh, 2014) in an attempt to identify the linkage between sovereign and banking risk developed an investigation using Contingent Claim Analysis as an indicator of banking risk and the 10-Year government yield spread over Germany’s bonds as a measure of sovereign risk. Using data from banks belonging to ten euro area countries in the 2005-2013 period, authors find that (i) the linkage exists significantly in time of major crisis and the contagion goes from banks to sovereigns; (ii) until the collapse of Lehman Brothers the great majority of all episodes of contagion where from sovereign to banks, as a consequence of economic stagnation and decrease on the growth rates
8 The risk of a Bank incorporates several types of risk that it may incur during its activities. (Barrios, Iversen,
Lewandowska, & Setzer, 2009) divides credit risk in three types: (i) default risk as the probability that the issuer fails to meet their obligations, (ii) credit spread risk is the one based on the price performance of the bond and is defined by the probability that the market value of the bond will be less than the value of other comparable quality bond and (iii) downgrade risk which reflects the possibility of downgrade by a credit rating agency. In our work, we will only consider the credit risk represented has the probability of default of the Issuer.
of Gross Domestic Product (GDP) in the euro area. However, since the dawn of the financial crisis, the majority of all episodes where from banks to sovereign. An important fact of this study is that Germany and Luxembourg were excluded and that when investor’s confidence decrease German Bunds were a safety harbor to investments. In conclusion, authors found that there is a bidirectional linkage between bank and sovereign risk, and that during specific times and circumstances the source of the epicenter varies.
(Acharya, Drechsler, & Schnabl, 2014) also study the loop between sovereign and bank risk. Using CDS rates on European Countries and banks between 2007 and 2011, authors present two main conclusions. First, bailouts triggered the rise of sovereign credit risk and after that changes on sovereign CDS explain significantly changes on banks CDS. Second, greater financial sector distress predicts larger bank bailouts, increasing sovereign credit risk and consequently higher debt-to-GDP ratios across countries.
(Alter & Schuler, 2012) studied the interdependence between the default risk of countries that belong to the Eurozone and the default risk of their domestic banks. Using daily CDS data during the 2007-2010 period, they found that: (i) before bailouts, the increase in countries’ default risk has its origin in financial sector; and (ii) after the financial crisis, banking sector default risk became strongly influenced by sovereign risk, increasing the sensitivity of sovereign risk because of shocks in the financial sector.
In studying the link between banking and sovereign risk (Gerlach, Schulz, & Wolff, 2010) conducted an investigation in which euro area sovereign bond spreads were used as dependent variables. They concluded that aggregate risk factor, and size and structure of national banking sectors are important determinants of sovereign bond spreads. In times of aggregate risk increasing, economies with larger banking sectors experience a rise on risk and consequently
on spreads. Additionally, banks with lower equity ratios have also to pay larger sovereign risk premiums. This findings leads us to conclude that in times of financial instability, banks with lower equity cushions and countries with larger banking sectors increase significantly the financial effort of countries if they have to bailout their banks. This leads to an increase of public debt and ultimately to an increase on sovereign risk. Considering that sovereign spreads decrease with the increase of bank’s equity ratio, they suggest that governments should require banks to hold more equity in order to reduce aggregate risk.
(Gabbi & Sironi, 2005) have investigated empirically the main factors that affect the pricing of corporate bonds. Using a database with the yield issuance spreads on Eurobonds issues on almost 600 major corporations from fifteen developed countries during 1991 to 2001, they have arrived to the following main conclusions: (i) rating, provided by Moody’s or Standard & Poor’s, are one of the most important variable in determining the spread between the yield to maturity of corporate bonds and the equivalent Treasury securities; (ii) during this period, the investors’ reliance on rating agencies’ judgment has increased; (iii) variables such as the amount of fees charged, the number of managers in the bond issuing syndicate, and the issuance process - representing the primary market efficiency -, and the expected secondary market liquidity explain corporate bonds cross-sectional issuance spread variability. Another interesting conclusion is that rating agencies discordance regarding the credit rating assigned are perceived by investors as a sign of higher uncertainty about the default risk of the issuers.
(Zaghini, 2014) studied the determinants of the premium paid on bond issuance by banks resident in the Unites States, Euro area and the United Kingdom during the 2006-2011 period. The author focuses on the systemic relevance of the implicit and explicit guarantees provided by countries to “their” banks. The author proves that the crisis induced deterioration in bank’s funding conditions, leading also to a liquidity crisis and the freezing of the credit markets.
With the bailout of several financial institutions and the injection of liquidity in credit markets, concerns about public finances in several countries of the euro zone led to problems in the sustainability of public finances and deterioration of sovereign creditworthiness. As a consequence, banks from those countries started to suffer the same problem with increasing of their CDS spreads and rating downgrades witch ultimately led to worse funding conditions. The author also concludes that countries with Triple A Rating provided a safety net to their home banking system, while countries without it could not give that implicit support increasing the funding costs of banks. This rating effect was more explicit in the years of the financial crisis. Regarding to other variables studied in the paper, their conclusion were that: (i) bonds with higher ratings usually get lower spreads; (ii) looking to the type of bond issued, subordinated debt is more expensive than senior bonds, while covered bonds coefficient was considered statistically not different from zero; (iii) government guarantees generated a reduction in the issuance premium, proving that that AAA countries provide additional security and that the spread paid reflects the characteristics of the guarantor rather than the issuer; (iv) banks’ CDS are highly significant and , as expected, an increase in the CDS premiums leads to an increase in the cost of funding; (v) and looking to the size and systemic relevance, the safety net benefits provided by the Too Big to Fail theory induces a reduction on the premium paid on the primary debt market. However, when interacted with the systemic relevance and the crisis effect, before crisis banks with higher relevance pay a lower spread, but after crisis the signal reversed. In short, their findings show that the link between sovereign and banking risk is particularly significant in crisis periods.
1.2
Covered Bond Purchase Programme
The ECB has been using Covered Bond Purchase Programmes10 to
unfreeze credit markets after the 2007/2008 financial crisis and the subsequent European sovereign debt crisis. There is scan research on the impact of these ECB programs on both credit markets and pricing of bank debt instruments. (Beirne, Dalitz, & Ejsing, 2011) concluded that the first CBPP has fulfill its primary objectives. First, it stimulated a considerable reactivation of covered bonds being issue in the primary market, which has consolidated the image that covered bonds where an important funding instrument, increased the primary market activity and revived market segments, at least temporary. As a consequence, funding conditions on the Eurozone started to improve significantly and if it wasn´t the sovereign debt crisis that started in 2010, the effects could had been more lasting.
The (ECB, 2010)presents the main conclusions about the covered bond market developments and the Covered Bond Purchase Programme (CBPP). Announced in May 7, 2009 the purchases started on July 6, 2009 and ended in
10 The ECB/2009/16 decision of the European Central Bank (ECB) of July, 2 2009 explains the main guidelines
of the implementation of the first covered bond purchase programme, namely the scope of the outright purchase of Covered Bonds and the eligible criterions. In the first programme the amount established to fulfill the programme was 60 billion euros to purchase eligible covered bonds between June of 2009 and June of 2010.
In November, 3 2011 the ECB/2011/17 Decision of ECB implemented a second covered bond purchase programme with an estimation of 40 billion euros to purchase eligible covered bonds between November 2011 to October 2012. The objectives were practically the same of the first one: (i) easing funding conditions for credit institutions and enterprises; (ii) encouraging credit institutions to maintain and expand lending to their clients. In October, 15 2014, the ECB/2014/40 decision of the ECB on a third programme was implemented. In this programme the objectives referred are: (i) enhance the transmission of monetary policy, (ii) facilitate credit provision to the euro area economy, (iii) generate positive spill-overs to other markets and (iv) contribute to a return of inflation rates to levels closer to 2 %.ECB estimates to make monthly purchases up to 60 billion until March of 2017.
June 30, 2010. With the aim of improving financial institutions funding conditions, market liquidity of covered bonds, encouraging and easing credit conditions, the measures adopted were ultimately to spur credit growth. One of the results was a growing number of credit institutions that turned to use covered bonds as a funding instrument. As a consequence, the liquidity of the covered bonds secondary market improved significantly. In the primary market, it re-activation was notorious with 25 banks issuing covered bonds for the first time. Overall, the effectiveness of the CBPP was proved. Although the negatives effects of the sovereign debt crisis in the first months of 2010, there was a significant improvement in the functioning of the covered bond market and a tightening in spreads between covered bond yields and swap rates.
(Szczerbowicz, 2014) investigated the impact of the European Central Bank’s (ECB) unconventional policies on bank and government borrowing costs. Regarding to the CBPP1 and CBPP2, the paper confirms the results of (Beirne, Dalitz, & Ejsing, 2011) study. These programmes were effective in lowering covered bonds spreads and had a spillover effect on covered bond purchases, especially in reducing sovereign bond markets distress. Another important fact was that these measures aimed to reduce banks funding constrains and covered bond spreads. However, spreads diminished in all studied countries with the exception of Ireland and Portugal.
1.3 Sovereign Risk: how to measure it?
There are three important variables that have been used as a proxy for sovereign risk: (i) credit rating provided by rating agencies; (ii) credit default swaps (CDS), (iii) or government bond yields. (Longstaff, Pan, Pedersen, & Singleton, 2011) define CDS as an insurance contract that allows investors to buy protection against the event of default or a debt restructuring. They claim that the advantage of using CDS data, comparing with bond data, is that the market
is typically more liquid resulting in more accurate estimates of credit spread and returns. Regarding the use of credit ratings, (Remolona, Scatigna, & Wu, 2007) present the following main advantages: (i) rating agencies explain their criteria and rating methodologies; (ii) they regularly review and report the correspondence of their ratings with historical default rates, and (iii) rating agencies stake their business on the accuracy of their ratings. The main disadvantage is that they focus on a long-term horizon and respond only to the component of credit quality changes that are perceived to be permanent. The main question is that investors more and more care about credit quality in the short term and ratings don’t have the ability to provide precise point-in-time measures of risk. In the same line of reasoning, (Zhu, 2004) argues that comparing both bond and CDS markets, CDS moves ahead of the bond market in price adjustment, particularly for United States entities.
(Casu, Clare, Sarkisyan, & Thomas, 2013) analyzed the effect of accessing to the securitization market on bank performance. Using United States commercial bank data from 2001 to 2008, the authors found that securitizing banks tend to be more profitable institutions, with a more diversified funding structure but with higher funding costs and also with higher credit risk exposure. Additionally they tend to hold larger and less diversified loan portfolios, have less liquidity and capital, and a significant lower loan growth rate.
2.
HYPOTHESES AND SAMPLE SELECTION
2.1
Hypotheses
Having as primary objective the study of the relation between banking risk and Sovereign Risk we raised 6 hypotheses:
1. The impact of pricing factors on credit spread differs significantly between Bank Bonds, Covered Bonds and Securitization Bonds.
[(Vink & Thibeault, 2008), (Pinto & Santos, September 2015)]
2. The sovereign risk has a significant positive impact on bank risk, after controlling for other micro and macro pricing factors.
[ (Acharya, Drechsler, & Schnabl, 2014), (Alter & Schuler, 2012), (Zaghini, 2014), (Caporale, Matousek, & Stewart, 2009), (Panetta, 2011)]
3. The 2007-2008 financial crisis increased significantly the impact of sovereign risk on bank risk.
[(Gómez-Puig, Sosvilla-Rivero, & K.Singh, 2014), (Alter & Schuler, 2012) (Zaghini, 2014)]
4. Countries with Triple A rating provided a safety net on “their” banks funding conditions, during the 2007-2008 financial crisis.
(Zaghini, 2014)
5. Countries that had international finance assistance witnessed a deterioration on “their” bank’s funding conditions.
6. The first Covered Bond Purchase Programme (CBBP) eased the funding conditions during the 2007-2008 financial crisis.
[(Beirne, Dalitz, & Ejsing, 2011), ((ECBC), 2014), (Szczerbowicz, 2014)]
Regarding the first hypothesis, we will conduct a study using regression analyses and standardized coefficients regression to prove that the impact of pricing factors on credit spread differs significantly between Bank Bonds (BB), Covered Bonds (CB) and Securitization Bonds (SB). Additionally, we will use the Chow Test of structural change to check if the estimated coefficients for CB, BB and SB are the same. A descriptive analysis will also be made to support the hypotheses. As said above, we will use the calculation of the Standardized Regress Coefficients. When we run a normal regression, the output gives us coefficients that are unstandardized because we cannot compare them in the majority of the cases. For example, we cannot compare volatility and maturity independent variables because they have widely varying means and variances. Spread and these variables are usually significantly positively related. However, what is really important is to know what the trade-offs are. For example, if a bank wants to lower its cost of funding what would be the best decision: wait for the markets to stabilize or issue Bonds/Loans with lower maturities? This example may not be practical but show us the limitations that a normal regression has. To minimize this we will use the “Beta” option in the regress command in Stata.
The main purpose of the second hypothesis is to investigate the impact of sovereign risk on bank risk. In order to do that we will use regression analysis and standardized coefficients regression. We will use firstly country rating as a proxy for sovereign risk. Then we will check our results using credit default swaps and government bond yields as alternative proxies.
With the third hypothesis we intend to study the impact of the financial crisis on the relationship between sovereign and bank risk. We argue that the financial crisis increased significantly the impact of sovereign risk on the spreads for the three forms of bank funding, CB, BB and SB. Regression analysis and standardized coefficients regression will also be implemented.
With the fourth hypothesis we aim to investigate the effect of a Country with triple A Credit Rating during the financial crisis on bank’s cost of funding. In line with the analysis implemented by (Zaghini, 2014), we will examine if a country with a triple A rating in fact provides additional security in the issuance of BB or CB by “their” banks.
On the contrary, in the fifth hypothesis we intend to study exactly the opposite. We argue that countries that were financial assisted by international institutions induced a deterioration on “their” banks funding conditions. These two hypotheses are very important to understand the connection between the banks’ cost of funding and the soundness of their countries.
Another important fact was the launch of the Covered Bond Purchase Programme. Announced in May 7, 2009 this programme had the important task of minimizing the effects of the financial crisis triggered by the bankruptcy of Lehman Brothers which lead to a halt in interbank market activity. This hypothesis intends to investigate if the programme fulfilled its main monetary policy objectives easing funding conditions (Beirne, Dalitz, & Ejsing, 2011). For that we will first conduct a descriptive analysis comparing the mean and median spreads through the period of analysis. Then, a regression analysis comparing the effects of the CBPP1 announcement had on credit spreads will be implemented.
2.2
Sample Selection
Our sample includes bond offers data drawn from DCM Analytics databases for the 2000-2011 sampling period. Although the data drawn from DCM Analytics relates to several types of bonds, we include only those with a deal type code of “corporate bond-investment-grade”, “corporate bond-high yield”, “asset-backed security” (ABS), “mortgage-backed security” (MBS), and “covered bonds”. Data on macroeconomic variables, such has Risk Free Rate, slope of the Euro swap curve, Volatility, Sovereign Credit Default Swaps and Government Yields was obtained from DataStream11. Additionally, accounting
and market data for banks was drawn from Bankscope.12. Since DCM Analytics
does not provide an identification code we hand-matched banks in the Bankscope database with issuer names for Bank Bonds and Covered Bonds and issuer-parent names for Securitization Bonds in DCM Analytics database.
Since we which to study the impact of sovereign risk on banking risk, we select from our full sample those issues that have complete data on credit spread. We also require that the bank was headquartered in Western Europe and that the tranche size (in Euro millions) be available. These screens have yielded a sample of 16,860 observations, of which 10,920 were classified as covered bonds (€ 2,429.4 billion), 5,695 as bank bonds (€ 3,041.9 billion ), and 245 as securitization bonds (€ 188,7 billion).
11 DataStream is provided by Thomson Reuters
12 Bankscope is a global database of bank’s financial statements, rating and intelligence. It combines
comprehensive financial statements with a wide range of other banking intelligence including ratings, an analysis model, bank structures, news, AML documentation and banking research. It also provides information on 32,000 banks and it’s used by over 90% of the world’s top 1,000 banks. Is compiled by Bureau van Dijk Electronic Publishing
2.2.1 Description of Variables
We use credit spread as a proxy for banking risk, being the dependent variable in our regression models. The credit spread represents the credit risk of the issuer, defined as the uncertainty associated with potential loss of either principle or interest on a fixed income obligation (Jacobs, Karagozoglu, & M., 2010); i.e., corresponds to the price for the risk associated with the financing instrument at issuance. The spread is thus computed as the margin yielded (in bases points) by the security at issue above a corresponding currency treasury benchmark with a comparable maturity.
We consider the following control variables as determinants of the credit spread:
Country Rating
Country Rating is approximated by Standard & Poor’s country rating; i.e.,
the S&P's country credit rating at close. The rating is converted as follows: AAA=1, AA+=2, and so on until D=22. Thus, this variable measures from 1 for the countries with the lowest risk to 22 for the countries of highest risk. A positive coefficient is expected since countries with a lower score number (highest quality) have lower country risk. The reviewed empirical studies found that country-specific effects on bank ratings, and consequently on their funding conditions, evidences that in some countries, banks have systematically higher rating (Caporale, Matousek, & Stewart, 2009). (Arezki, Candelon, & Sy, 2011) also found that sovereign rating downgrades have statistically and economically significant spillover effects both across countries and financial markets. (Caselli, Gandolfi, & Soana, 2016) studied the impact of sovereign rating changes on domestic bank shares prices and argues that The Committee on the Global
Financial System (2011) recognizes that sovereign downgrades have direct negative repercussions on the cost of bank debt and equity funding. Regarding to our deal types, CB, BB and SB we do not find any empirical study that includes country rating as a regressor to test the impact of country credit risk on credit
spread. In short, a positive effect on the spread is expected since banks
headquartered in countries with lower risk tend to give and special protection in default (Zaghini, 2014).
Credit Rating
This variable represents the rating assigned by a credit rating agency at the time of issuance. It describes the creditworthiness of the instrument or its relative credit quality. We use a rating classification scheme based on 22 rating scales for two rating agencies. Loan and bond ratings are thus based on the S&P and Moody’s rating at the time of issuing the bond or closing the loan, and converted as follows: AAA=Aaa=1, AA+=Aa1=2, and so on until D=22 [(Sorge & Gadanecz, 2008), (Vink & Thibeault, 2008), and (Gatti, Kleimeier, Megginson, & Steffanoni, 2013)]. This means that the higher the value the lower the rating. (Gabbi & Sironi, 2005), (Zaghini, 2014) and (Zähres, 2012) have studied the relationship between credit rating and credit spread and they found that: (i) credit
rating is one of the most important determinants of credit spreads; and (ii) the
higher the credit risk, meaning a higher rating, the higher the credit spread, creating a positive relationship among this two variables..
Time to Maturity
Time to Maturity is the maturity of bonds, in years. Bonds with longer
maturities tend to be more risky than loans or bonds with shorter maturities or average lives, because predictability of future cash flows weakens with horizon.
Therefore, investors usually demand higher premium for longer term securities. Empirical results show that lenders get a higher remuneration in investment grade bonds for being exposed to risk for a longer period of time [e.g., (Jones, Mason, & Rosenfeld, 1984), (Sarig & Warga, 1989), (He, Hu, & Lang, 2000), (Duffie & Singleton, 2001), and (Sorge & Gadanecz, 2008)] However, the literature has been more controversial regarding the term structure of credit spreads for non-investment grade bonds [see, among others, (Sarig & Warga, 1989), (Fons, 1987), (Helwege & Turner, 1999), and (Sorge & Gadanecz, 2008)]. (Sorge & Gadanecz, 2008) detect that credit spreads for both investment-grade and speculative-grade bonds are a positive linear function of maturity. Regarding securitization bonds, (Vink & Thibeault, 2008)) find a significant negative relationship between spread and (i) CDOs with a maturity lower than 5 years (low maturity); and (ii) MBS with a maturity longer than 15 years (high maturity). However, the coefficients on ABS with low maturity and high maturity are insignificant. Thus, the variable expected sign cannot be determined clearly from the empirical literature.
Risk free rate
We use as a proxy for the risk-free rate the three-month German Treasury bill at the time of issuing the bonds. (Eichengreen & Mody, 1998) and (Kamin & Von Kleist, 1999) find that the general level of interest rates is an important determinant of the pricing of bonds. We expect that Risk free rate will have a significant negative impact on credit spreads since higher yields mean better economic conditions and thus lower probabilities of default[ (Collin-Dufresne, Goldstein, & Martin, 2001), (Longstaff, Pan, Pedersen, & Singleton, 2011)].
Slope of the Euro swap curve
The inclusion of the slope of the Euro swap curve (obtained as the difference between the five-year Euro swap rate and the 3-month Libor rate) as an additional control variable is motivated by the following reasons: (i) it corrects for the fact that bonds credit spread might be measured over base rates of different maturities; and (ii) it controls for varying inflation expectations, which might have different impact on pricing fixed versus floating rate debt. (Sorge & Gadanecz, 2008) find that a steeper US Treasury yield curve is associated with lower spreads. (Hu & Cantor, 2006) find that structured finance spreads are highly correlated with the slope of the swap curve. We expect that a steeper euro yield curve will reduce credit spreads since it might represents a positive expectation on economic growth, leading to better financial performances.
Volatility.
Volatility refers to the amount of uncertainty or risk associated with
changes in an asset’s value. A higher volatility means that an asset’s value can potentially be spread out over a larger range of values; i.e., the price of the financial assets can change dramatically over a short time period in either direction. On the contrary, a lower volatility means that an asset’s value does not fluctuate dramatically, but changes in value at a steady pace over a period of time. We use the Chicago Board Options Exchange Volatility Index (VIX) as a proxy for market volatility. VIX reflects a market estimate of future volatility, based on the weighted average of the implied volatilities for a wide range of strikes. We expect a positive relationship between Volatility and credit spread as borrowers will require a higher return in the presence of higher volatility.[ (Pinto J. F., 2013), (Fabozzi & Kothari, 2007), (Davidson, Wolff, & A., 2003) (Collin-Dufresne, Goldstein, & Martin, 2001)].
Number of banks
The bank involvement measured by the number of banks supporting the transaction can be used to approximate a deal’s risk; i.e., a larger number of banks involved may lower the spread if investors associate a larger number of banks with an increase in the certification of the transaction. Regarding SB transactions, (Vink & Thibeault, 2008) find that whereas credit spread and number of lead managers are significantly, negatively related for MBS, they have an insignificant relationship for ABS and CDOs. Therefore we expect Number of banks to have a negative influence on the spread [ (Sorge & Gadanecz, 2008), (Nadauld & Weisbach, 2012)].
Number of bookrunners
The bookrunner is the underwriting institution of the financial instrument; i.e., it has the responsibility of “running” all the process. The number of bookrunners is connected with the number of banks since the number of bookrunners are at least equal to the number of banks involved in the bond issuance. If there is more than one bookrunner involved they are typically called joint bookrunners. We expect that the influence of this variable on the credit spread is the same as predicted for the number of banks.
Bookrunner Participation
Is the part of the financial instrument that the bookrunners keeps to themselves. If the bond is considered of low risk, the bookrunner will have the tendency to keep the most part to him, if not we will try to “sell” as much as possible to other banks in an attentive to lower its risk. We expect that the higher the participation, the lower the risk.
Loan to Value
The Loan to value ratio represents the ratio between the tranche size and the transaction size. To calculate the ratio we divided manually the tranche size over the transaction. If the transaction only contains one tranche the value is 100%. In order to calculate the ratio we used the methodology proposed by (Vink & Thibeault, 2008). For BB and CB, we expect that credit spread and loan to value will have a significant positive relationhip, suggesting that lenders associate an increase in the loan to value ratio with a significant increase of credit risk. On the contrary, we expect that credit spread and loan to value have a significant negative relationship for SB issues; i.e., and if the loan to value is higher, we will expect a lower credit spread. In securitization transacctions several credit enhancement mechanisms are implemented to improve the credit rating of the issued securities and reduce the risks transferred to investors. One mechanism is the creation of a credit risk mitigation device by subordination of tranches with lower size; such that those lower tranches provide credit support to the most senior tranche.
Tranche size
The tranche size represents the amount of the tranche in euros. (Sorge & Gadanecz, 2008) find a negative coefficient on bond tranche size. Referring to SB, (Maris & Segal, 2002) study the determinants of credit spread on CMBS and find that tranche size influence negatively the CMBS credit spread. Similarly, (Firla-Cuchra, 2005), (Vink & Thibeault, 2008), and (Buscaino, Caselli, Corielli, & Gatti, 2012) find a negative impact of tranche size on the spread. We expect that the higher the tranche size, the lower the spread.
Number of tranches
Represents the number of tranches per transaction. SB issues are usually divided into one or more tranches. The same happens with several BB and some CB issues in our sample. For each transaction we computed manually the variable number of tranches. For BB and CB issues, it is feasible to associate risk with the number of tranches. Riskier transactions might imply a higher number of tranches since each investor is available to constitute a lower share in its portfolio and thus a positive coefficient is expected. For SB, the number of tranches allows us to analyze the impact of tranching on the credit spread. As referred by (Vink & Thibeault, 2008), “[T]ranching could allow the issuer to take advantage of market factors such as greater investor sophistication and heterogeneous screening skills related to asymmetric information.” (Firla-Cuchra & Jenkinson, 2006) find a significant and negative relationship between the number of tranches and the credit
spread (launch spread). Thus, a negative coefficient between spread and number of tranches is expected for SB.
Fixed Rate
Fixed rate is a dummy variable set equal to 1 if the bond has a fixed rate
and zero otherwise. With fixed interest rate, the interests do not fluctuate and are typically protected to avoid the risk of rising interest rates. We expect borrowers to raise funds at a higher spread through fixed priced issues than through floating priced issues. For this reason, a positive sign is expected for a fixed rate issue. Empirically, (Sorge & Gadanecz, 2008) find a significant discount in the pricing of floating rate bonds. They assert that this can reflect the insurance which fixed rate offers against future interest rate fluctuations (Vink & Thibeault, 2008).
Currency risk
Currency risk is a dummy variable set equal to one for bonds that are
denominated in a currency different from the currency of the banks’ home country and zero otherwise. We should expect issues exposed to currency risk to have higher credit spreads than issues not exposed. (Vink & Thibeault, 2008) find that SB issues exposed to currency risk have higher spreads than other issues not exposed to.
Callable
Callable is a dummy variable set equal to one if the bond has a call option
and zero otherwise. A callable bond is a bond that can be redeemed by the issuer at some point before the bond reaches its date of maturity. The call price will usually exceed the par or issue price; i.e., usually there are substantial call premiums. Thus, a positive sign is expected for a callable bond as the issuer has an option, for which it pays in the form of a higher credit spread. (Fabozzi & Kothari, 2007)
Crisis
Crisis is a dummy variable equal to one if the issue date belongs to the
crisis period and zero otherwise. We consider a pre-crisis period from January 1, 2000 through to September 14t, 2008, and a crisis period from September 15th
(Lehman Brothers' bankruptcy filing date), through to December 31st, 2011. A positive coefficient is expected since the 2007/2008 financial crisis has resulted in a number of bank bailouts and business failures, a decline in consumer wealth, and a downturn in economic activity. During this period two other dates will be examined: (i) May 7, 2009 - announcement of the first ECB Covered Bond
Purchase Programme; and (ii) May 2, 2010, which was the day of the official request of financial aid by Greece, representing for many investigators the beginning of the Sovereign Debt Crisis (Carbó-Valverde, Rosen, & Rodríguez-Fernández, 2011). For example, (Prokopczuk, B. Siewert, & Vonhoff, 2012) show that, in general, CB average yield spread increased more than 100 bps during the financial crisis.
Country CDS
Country CDS13means the sovereign CDS at the time of issuance. Sovereign
CDS contracts are insurance contracts that allow investors to buy protection against the event of default or debt restructuring (Longstaff, Pan, Pedersen, & Singleton, 2011). We use sovereign CDS spreads with a five year maturity since they are the most liquid and account for a large proportion of the sovereign CDS Market (Remolona, Scatigna, & Wu, 2007). Again, as for country rating, we expect that country CDS and credit spreads will have a significantly positively relationship for all the bond types [ (Alter & Schuler, 2012), (Acharya, Drechsler, & Schnabl, 2014)].
Yield Country
The 10yrs government yields are commonly used in empirical investigation (Gómez-Puig, Sosvilla-Rivero, & K.Singh, 2014). We expect that an increase on the yields, derived from an increase on the credit risk (Barrios, Iversen, Lewandowska, & Setzer, 2009), will result on an increase of the spreads paid by banks at issuance.
13 Credit Default Swap is a contract that provides insurance against the risk of default by a particular entity.
AAA_pre_crisis
This variable is a dummy set equal to one if the country has a triple A rating during the pre-crisis period and zero otherwise.
AAA_crisis
This variable is a dummy set equal to one if the country rating has triple A rating during the crisis period and zero otherwise. This dummy variable intends to prove that Western European countries with a triple A rating gave additional protection to their banks in the period of crisis (Zaghini, 2014).
Coun_Under_Ass Pre_Crisis
This variable is a dummy set equal to one if the if banks are headquartered in Portugal, Italy, Ireland, Greece and Spain during the pre-crisis period and zero otherwise.
Count_Under_ASSCrisis
This variable is a dummy set equal to one if banks are headquartered in Portugal, Spain, Greece or Ireland during the crisis period and zero otherwise. It intends to analyze if banks in these countries, who had international financial assistance, were more “punished” during the financial crisis.
Cash + Securities / Assets
Cash represents money available for use in the normal operations of the bank. It is the most liquid of all of the bank's assets. Securities is computed as the
sum between the following items: reverse repos and cash collateral, trading securities, derivatives, available for sale securities, held to maturity securities, at-equity investments, and other securities. We expect that an increase on the liquidity will result on a risk reduction (Agostino & Mazzuca, 2008).
Loans/Customer Deposits
This liquidity or funding ratio indicates to what extent the banks relatively illiquid loans are funded by relatively stable customer deposits14 rather than
wholesale or market funding. Ideally this ratio should be 100%. (Altunbas, Manganelli, & Marques-Ibanez, 2011) state that customer deposits provide funding stability and reduces the probability of a bank rescue[ (Agostino & Mazzuca, 2008) and (Casu et al. 2013)]. We thus expect a positive relation between this ratio and bond spreads.
Net Loans/ Total Assets
This liquidity ratio indicates what percentage of the bank’s assets is tied up in loans. The higher this ratio the less liquid the bank is. Net loans is computed as residential mortgage loans, plus other mortgage loans, plus other consumer/ retail loans, plus corporate and commercial loans, plus other loans, minus reserve against possible losses on impaired or non-performing loans. Our expectation is that a less liquid bank should have its risk increased (Casu et al. 2013). However (Alessandri, Masciantonio, & Zaghini, 2015) show that the different between safe banks and crisis banks does not display different values.
14 Current accounts, which may or may not be interest bearing, are subject to immediate and unlimited
Equity / Total Assets
As Equity is a cushion against asset malfunction, this ratio measures the amount of protection afforded to the bank by the Equity they invested in it. The higher this figure the more protection there is. With the increase of this ratio we expect that credit risk to be lower[ (Agostino & Mazzuca, 2008), (Caporale, Matousek, & Stewart, 2009), (A. Minton, Stulz, & Williamson, 2005)].
Total Regulatory Capital Ratio
This ratio is the total capital adequacy ratio under the Basel rules. It measures Tier 1 + Tier 2 capital which includes subordinated debt, hybrid capital, loan loss reserves and the valuation reserves as a percentage of risk weighted assets and off balance sheet risks. We expect the higher the value the lower the solvency risk. (Altunbas, Manganelli, & Marques-Ibanez, 2011) also claims that, in principle, the higher the value of capital reserves, the stronger the buffer to withstand losses. Additionally banks with more capital and thus less leverage, reduces risk-shifting incentives from shareholders towards excessively risky projects at the expense of debt holders (Casu et al. 2013).
Impaired Loans/Gross Loans
This ratio reflects the loan quality of the bank. Is a measure of the amount of total loans which are impaired or doubtful. We expect that the lower the ratio the higher the bank’s asset quality and thus the lower the credit spread. [(Casu et al. 2013), (A. Minton, et al 2005)]
Return on Average Assets (ROAA)
Computed as net income over the total assets, the ROAA is a profitability ratio that allows to compare the efficiency and operational performance of banks. It measures the generated returns by bank's assets. We expect that the more profitable the bank is, the lower the cost of funding. [(Casu et al. 2013), (Alessandri et al. 2015) (Caporale et al. 2009)]
Return on Average Equity(ROAE)
Computed as the net income over the equity, is also a profitability ratio. The higher the ratio the better, except when a bank is highly leveraged and hence more vulnerable to shocks. [(A. Minton, et al 2005), (Casu et al. 2013), (Alessandri et al. 2015)]
Total Assets
Total assets ratio is the sum of total current assets, long term receivables, investment in unconsolidated subsidiaries, other investments, net property plant and equipment and other assets. We expect that the higher the total assets ratio, the lower the cost of funding. [ (Zaghini, 2014), (Calomiris & Mason, 2003), (Caporale, Matousek, & Stewart, 2009)]. However, (Altunbas, Manganelli, & Marques-Ibanez, 2011) refers that institutions with higher risk exposure have larger size. Hence, the relationship between total assets and credit spread cannot be determined based on the existing literature.
Table 5.2 and Table 5.3 presents the description of variables, expected sign and findings following the existing theoretical and empirical literature.
3.
UNIVARIATE ANALYSIS
This chapter provides a statistical analysis of Bank Bonds (BB), Covered Bonds (CB), and Securitization Bonds (SB) issued by banks in Western Europe. We start by comparing credit spread and common pricing factors among the three types of bond issues. Then we present the distribution of spreads across time by country of the issuer, deal type, country rating, and considering two sub-periods: pre-crisis and crisis period.
3.1 Descriptive statistics by Bond Type
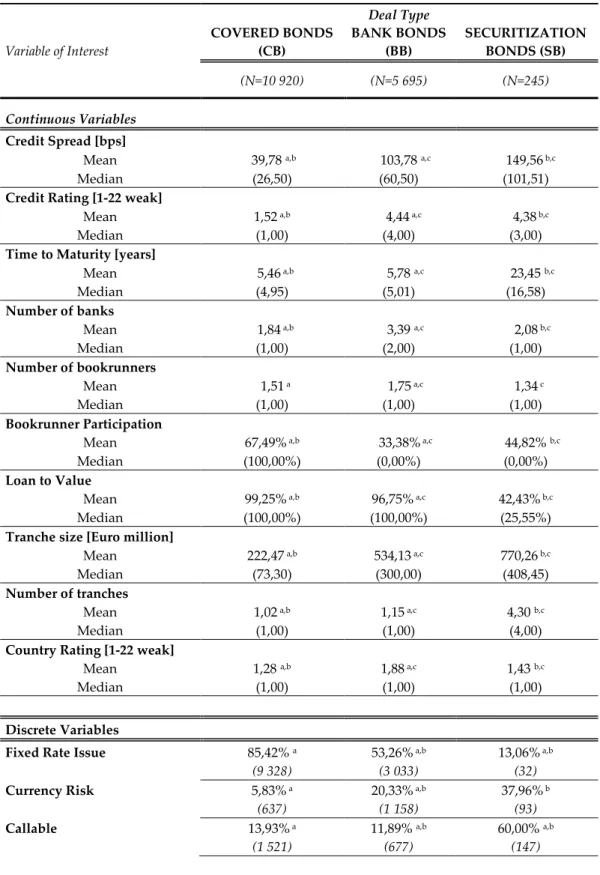
Table 3.1 presents descriptive statistics for BB, CB and SB issued by Western European banks during the 2000-2011 period. We also conducted bivariate comparisons of the credit spread and pricing characteristics between the three deal types using nonparametric tests – Wilcoxon rank-sum test for continuous variables and Fisher’s exact test for discrete variables. Regarding the credit spread, Table 3.1 shows that the average credit spreads are economically and statistically lower for CB (39.78 bps) than they are for BB (103.78 bps) and SB (149.56 bps). Additionally, the average credit spreads for SB are economically and statistically higher than the credit spreads for BB at the 5% significance level. However, this can reflect the country rating, since CB issuers are, on average, located in countries with higher credit ratings (1.28) than in the case of SB (1.43) and BB (1.88) categories. This is in line with the prediction that countries with higher credit ratings provide additional protection on bank funding costs (Zaghini, 2014). On the contrary, we find that BB issuers are, on average, located in far riskier countries than in the case of SB, which is not reflected in the cost of credit spreads. Still, these Univariate analyses do not allow us to control for other factors that are known to affect the pricing of bonds. Thus, in order to further test
Hypothesis 2 we proceed, in Chapter 4, with a regression analysis that takes micro and macro pricing factors directly into account.
Table 3.1 Descriptive statistics for BB, CB, and SB
Deal Type Variable of Interest COVERED BONDS (CB) BANK BONDS (BB) SECURITIZATION BONDS (SB) (N=10 920) (N=5 695) (N=245) Continuous Variables Credit Spread [bps]
Mean 39,78 a,b 103,78 a,c 149,56 b,c
Median (26,50) (60,50) (101,51)
Credit Rating [1-22 weak]
Mean 1,52 a,b 4,44 a,c 4,38 b,c
Median (1,00) (4,00) (3,00)
Time to Maturity [years]
Mean 5,46 a,b 5,78 a,c 23,45 b,c
Median (4,95) (5,01) (16,58)
Number of banks
Mean 1,84 a,b 3,39 a,c 2,08 b,c
Median (1,00) (2,00) (1,00)
Number of bookrunners
Mean 1,51 a 1,75 a,c 1,34 c
Median (1,00) (1,00) (1,00)
Bookrunner Participation
Mean 67,49% a,b 33,38% a,c 44,82% b,c
Median (100,00%) (0,00%) (0,00%)
Loan to Value
Mean 99,25% a,b 96,75% a,c 42,43% b,c
Median (100,00%) (100,00%) (25,55%)
Tranche size [Euro million]
Mean 222,47 a,b 534,13 a,c 770,26 b,c
Median (73,30) (300,00) (408,45)
Number of tranches
Mean 1,02 a,b 1,15 a,c 4,30 b,c
Median (1,00) (1,00) (4,00)
Country Rating [1-22 weak]
Mean 1,28 a,b 1,88 a,c 1,43 b,c
Median (1,00) (1,00) (1,00)
Discrete Variables
Fixed Rate Issue 85,42% a 53,26% a,b 13,06% a,b
(9 328) (3 033) (32)
Currency Risk 5,83% a 20,33% a,b 37,96% b
(637) (1 158) (93)
Callable 13,93% a 11,89% a,b 60,00% a,b
Notes: In each cell are mean and median (in parentheses) for continuous variables, percent and number (in parentheses) for discrete variables. The tests for similar distributions in bond characteristics across samples are the Wilcoxon rank-sum test for continuous variables and the Fisher's exact test for discrete variables. (a) indicates significant difference at the 1% level between CB sample and BB sample; (b) indicates significant difference at 1% level between CB sample and SB sample; (c) indicates significant difference at 1% level between BB sample and SB sample .
The average credit rating for CB sample (1.52) is significantly lower than the credit rating for SB (4.38) and BB (4.44) samples. This suggest that both AS and BB are consider more risky than CB and is consistent with the premise that the higher the credit rating the lower the cost of funding. A SB of average size matures over just 23.45 years, which is a long period if we compare it with the mean (median) 5.46 (4.95) and 5.78 (5.01) years for CB and BB bonds, respectively. This is a standard asset securitization characteristic, since in SB the maturity of the securities issued typically matches the maturity of the assets used as collateral, which are characterized by longer maturity levels (Vink & Thibeault, 2008).
In the SB sample, the average number of banks participating in an SB issue is 2.08, which is significantly larger than the average of 1.84 for CB but smaller than the average of 3.39 for BB, which suggest that banks wish to increase the number of institutions participating in traditional bank bond issuance in order to increase the certification of the transaction. This is the case because contrary to traditional bank bonds, where the ability of the issuer to generate sufficient cash flows to service the debt determines the risks of the bond issue, in securitization and covered bonds the repayment depends only or primarily on the assets and cash flows pledged as collateral to the issue. Similar findings were obtained for number of bookrunners.
Regarding Bookrunner participation, the three bond types are different debt instruments. In the CB sample, the average number of bookrunners 67% with the median at 100%, which is significantly higher than the average bookrunners participation for SB (45%) and BB (33%). The loan to value ratio is