Subtypes
Jean Z. Lin1,2., Douglas H. Sieglaff1., Chaoshen Yuan3
, Jing Su4, AnithaChristy S. Arumanayagam1, Sharareh Firouzbakht1, Jaime J. Cantu Pompa1,5, Frances Denoto Reynolds3, Xiabo Zhou4,
Aleksandra Cvoro1, Paul Webb1*
1Genomic Medicine, The Methodist Hospital Research Institute, Houston, Texas, United States of America,2Department of Biology and Biochemistry, Center for Nuclear Receptors and Cell Signaling, University of Houston, Houston, Texas, United States of America,3Diabetes Center, University of California Medical Center, San Francisco, California, United States of America,4Radiology Department, The Methodist Hospital Research Institute, Houston, Texas, United States of America,5Department of Research and Innovation, Tec de Monterrey School of Medicine and Health Science, Monterrey, Mexico
Abstract
There are two homologous thyroid hormone (TH) receptors (TRsa andb), which are members of the nuclear hormone receptor (NR) family. While TRs regulate different processesin vivoand other highly related NRs regulate distinct gene sets, initial studies of TR action revealed near complete overlaps in their actions at the level of individual genes. Here, we assessed the extent that TRa and TRb differ in target gene regulation by comparing effects of equal levels of stably expressed exogenous TRs+/2T3in two cell backgrounds (HepG2 and HeLa). We find that hundreds of genes respond to T3
or to unliganded TRs in both cell types, but were not able to detect verifiable examples of completely TR subtype-specific gene regulation. TR actions are, however, far from identical and we detect TR subtype-specific effects on global T3response
kinetics in HepG2 cells and many examples of TR subtype specificity at the level of individual genes, including effects on magnitude of response to TR+/2T3, TR regulation patterns and T3dose response. Cycloheximide (CHX) treatment confirms
that at least some differential effects involve verifiable direct TR target genes. TR subtype/gene-specific effects emerge in the context of widespread variation in target gene response and we suggest that gene-selective effects on mechanism of TR action highlight differences in TR subtype function that emerge in the environment of specific genes. We propose that differential TR actions could influence physiologic and pharmacologic responses to THs and selective TR modulators (STRMs).
Citation:Lin JZ, Sieglaff DH, Yuan C, Su J, Arumanayagam AS, et al. (2013) Gene Specific Actions of Thyroid Hormone Receptor Subtypes. PLoS ONE 8(1): e52407. doi:10.1371/journal.pone.0052407
Editor:Wendong Huang, Beckman Research Institute of City of Hope, United States of America
ReceivedAugust 17, 2012;AcceptedNovember 14, 2012;PublishedJanuary 3, 2013
Copyright:ß2013 Lin et al. This is an open-access article distributed under the terms of the Creative Commons Attribution License, which permits unrestricted use, distribution, and reproduction in any medium, provided the original author and source are credited.
Funding:The authors have no support or funding to report.
Competing Interests:The authors have declared that no competing interests exist.
* E-mail: [email protected]
.These authors contributed equally to this work.
Introduction
Thyroid hormone (TH) receptors (TRs a and b) are highly homologous transcription factors which transduce signals of active forms of TH (predominantly tri-iodothyronine, T3) [1,2]. Like
other nuclear receptors (NRs), TRs bind specific DNA response elements (TREs) comprised of degenerate repeats of the sequence AGGTCA, usually as heterodimers with retinoid X receptors (RXRs). From these locations, the TRs recruit coregulator complexes that influence gene expression and T3 modulates
transcription by inducing conformational changes in the receptor C-terminal ligand binding domain which, in turn, alters the complement of TR associated coregulators [3–5]. Despite similarities in structure and function, analysis of TR gene knockout mice and human patients with TRa or TRb mutations has revealed that the two TRs display unique activitiesin vivo[6–11]. TRa plays major roles in regulation of heart rate and muscle whereas TRb modulates serum cholesterol levels via actions in liver and feedback inhibition of TH production through the hypothalamic-pituitary-thyroid axis. TRs also exhibit
subtype-specific effects in regulation of basal metabolic rate, bone development and other processes.
Differential effects of TRs have commonly been attributed to variations in TR expression levels in target tissues. Liver, for example, expresses TRb and TRain a 5:2 ratio and this could explain the predominant role of TRb in cholesterol metabolism [12,13]. Indeed, comparison of T3 effects in hypothyroid wild
[16]. Second, TRaand TRbexhibit similar effects at transfected reporters with the most common form of TRE (direct repeat spaced by 4 nucleotides, DR-4), but TRbis more active at inverted palindromic (IP) TREs [17]. Third, detailed qPCR analysis of expression of liver genes in TR knockout mice has revealed apparently exclusively TRb-dependent T3 regulated genes,
including thrsp and angptl3 [18]. Fourth, TR subtypes exhibit differential effects on ABCD2 gene via indirect differential effects on expression of the transcription factor SREBP1c [19]. Fifth, a constitutively unliganded TRa mutant represses transcription of the liver C/EBPb gene more efficiently than an equivalent TRb
mutant, via differential corepressor recruitment [20]. Finally, TRb
selectively represses the thyroid stimulating hormone (TSH) gene in cultured pituitary cells even though both TRs are present and TRais functional when expression of TRbis knocked down [21]. In addition to TR subtype specificity, there is evidence that activity of both TRs is highly gene-context dependent [1,14]. T3
can either activate or repress transcription of target genes but, within this framework, there are differences in contributions of unliganded and liganded TRs. Commonly, unliganded TRs suppress T3-inducible genes and agonists induce transcription by
both reversing the inhibitory effects of unliganded TRs and eliciting further transcriptional activation. There are, however, cases in which unliganded TRs fail to suppress T3induced genes
or where T3 activates genes solely by relieving unliganded
TR-dependent basal repression [14,16]. Similar gene-specific varia-tions in the balance of unliganded and liganded TR acvaria-tions also occur at negatively regulated genes and TRs can even exhibit completely ligand-independent actions [14,16]. T3concentration
dependence also varies; euthyroid T3 levels are sufficient for
optimal induction of some genes whereas others need higher (hyperthyroid) T3levels [14,22].
Here, we set out to define the extent of TR subtype and gene-specific variations in transcriptional response by creating cells with similar levels of TRaor TRb. While our data suggests that there are no completely TR subtype specific genes, we observed TR-subtype and cell-specific effects on the kinetics and magnitude of transcriptional response, patterns of TR-dependent gene expres-sion and T3 concentration dependence that verify and extend
conclusions of previous groups. We discuss possible mechanisms of these differential effects and their impacts upon physiological responses to THs and actions of STRMs.
Materials and Methods
Reagents
Triiodothyronine (T3) suitable for cell culture was purchased
from Sigma Aldrich (T6397).
Construction of HepG2-TR Cells
HepG2 cells were grown in Dulbecco’s modified Eagle’s medium (DMEM) supplemented with 10% fetal bovine serum (FBS), 100 U/mL of penicillin, 0.1 g/L of streptomycin and 4 mmol/L glutamine, under 95% air and 5% CO2 at 37uC.
Lentiviral vector pSicoR containing GFP was a gift from the McManus laboratory (UCSF, http://mcmanuslab.ucsf.edu/). Sequences for appropriate tags were added to TR cDNAs derived from previously described eukaryotic expression vectors by standard PCR amplification and resulting hybrid cDNAs were cloned into pSicoR vector at a location C-terminal of GFP. An oligonucleotide encoding a T2A peptide that will mediate co-translational cleavage of protein was inserted between GFP and TRs coding sequences to facilitate independent expression of GFP and TRs. pSicoR vectors containing tagged TRs were transfected
into HEK 293 cells to create packaged virus particles by the Diabetes center core lab at UCSF. The virus was titrated by GFP fluorescence. HepG2 cells grown on a 6-well plate were transduced with lentivirus particles containing tagged TR sequences. After incubation with virus particles for 72 hours, cell culture media were replaced with regular growth media and GFP expression was verified by fluorescent microscopy. Cells were split upon confluence and sorted by fluorescence-activated cell sorting in UCSF core facility after two passages. Clones of GFP positive cells were collected and grown in 10 cm plates. When cells reached confluence, TR expression was analyzed with Western blots using anti-tag antibodies and transient transfection of TRE driven luciferase reporters, described below. Cells were main-tained in regular growth medium as above.
Construction of HeLa-TR cells
HeLa cells were grown in similar conditions to HepG2 cells. HeLa cells stably expressing tagged TRaand TRbwere generated using the Tet-Off gene expression system (Clontech). Stable clones were selected by hygromycin-resistance (400mg/ml) and screened for TR protein expression. HeLa cells expressing TRb and TRa
were maintained in media supplemented with doxycycline (20 ng/ ml).
Western Analysis
HepG2 or HeLa cells were lysed using Triton X-100 lysis buffer. Cell extracts (10mg of total protein) were separated by
SDS-PAGE and transfer onto a PVDF membrane. Transfer membranes were then incubated with anti-flag M2 antibody (Sigma-Aldrich) or c-Myc antibody (Clontech) at a 1:1000 dilution at 4uC for 16 h followed by goat anti-mouse IgG-horseradish peroxidase antibody (Santa Cruz Biotechnology sc-2004) at a 1:10000 dilution for 45 min at room temperature. Blots were visualized by applying ECL Plus (GE Healthcare).
Hormone Binding
Hormone binding assays were carried out as described in [23]. The Kd values were calculated using the Graph-Pad Prism
computer program (Graph-Pad Software Inc).
Transfection
Cells were co-transfected with a DR-4 or IP-6 TRE-driven luciferase reporter and constitutive renilla luciferase reporter (Promega) using Transfectin Reagent (BioRad) and plated in 12-well plates in growth medium (DMEM with 10% hormone-depleted FBS) [23]. After 16 h of incubation, T3 (100 nM) or
vehicle (DMSO) was added in triplicate. After an additional 24 h of incubation, cells were harvested and assayed for luciferase activity using the Promega Dual Luciferase Reporter Assay (Promega). Data were normalized to therenillaluciferase activity.
mRNA and cDNA Preparation
For HepG2, total RNA was prepared using the Aurum Total RNA kit (Bio-Rad). Reverse transcription reactions in these samples were performed using 1mg of total RNA with an iScript
cDNA Synthesis kit (Bio-Rad). Total RNA concentrations were measured using NanoDrop ND-1000 spectrophometer. For HeLa, total RNA was extracted from cells with Qiazol Lysis Reagent (Invitrogen) and purified with RNeasyH Mini kit (Qiagen) following manufacturer’s instructions. mRNA was reverse tran-scribed into cDNA with a mixture Oligo(dT)20 and Random
Figure 1. Cells that express TRs. A. Equal expression of exogenously expressed TRs. Upper panel, western blot of extracts of HepG2 parental cells (1), HepG2 cells infected with control lentivirus (2) or cells infected with lentivirus expressing TRa(3) or TRb(4) and blotted with anti-flag antibody. Inset beneath shows the same extracts blotted with ab-actin antibody as a loading control. Lower panel; western blot of HeLa-TR extracts after+/2
doxycycline withdrawal to induce TRs and blotted with anti-myc.B. Results of T3binding assays performed on extracts of HeLa-TR cells after 24 hrs doxycycline withdrawal; figures in panels represent deduced affinities of expressed TRs for T3.C. Results of luciferase assays performed upon HeLa-TR cells transfected with standard TRE-driven reporters, DR-4 Luc and IP-6 (F2)-Luc after doxyclycline withdrawal to induce TR expression.D. Western blot of HepG2-TR extracts at various times after initial T3treatment.
doi:10.1371/journal.pone.0052407.g001
Figure 2. T3Response in HepG2 cells. A–D. Numbers of genes that meet cut-offs for fold induction and statistical significance in parental HepG2, HepG2-TRaor HepG2-TRbat each time point,A, 3 hr,B, 6 hr,C, 24 hr,D, all three time points combined. T3induced genes are represented in upper panels (red) and T3repressed genes in lower panels (blue), note the difference in scale which means that many more genes are positively regulated than negatively regulated.E–H. Plots of fold induction/repression by T3in the presence of TRb(y-axis) versus TRa(x-axis).E, 3 hr blue,F, 6 hr green,
Microarray hybridization
Human whole genome expression arrays were purchased from Illumina (Human WG-6v2 and Human WG-6v3). cRNA synthesis and labeling were performed using IlluminaH TotalPrepTM-96 RNA Amplification Kit (Ambion). Labeling in vitrotranscription reaction was performed at 37uC for 14 h. Biotinylated cRNA samples were hybridized to arrays at 58uC for 18 h according to manufacturer’s protocol. Arrays were scanned using BeadArray Reader.
Statistical analysis
Unmodified microarray data obtained from GenomeStudio was background-subtracted and quantile-normalized using the lumi package [24] and analyzed with the limma package [25] within R [26]. To determine the effect of TRaand TRbover-expression in the absence of ligand (‘‘unliganded-effect’’), cell lines were analyzed separately by LIMMA (‘‘parental’’, with no exogenous TRs, TRa, and TRb), followed by contrast analysis. To better determine TR isoform effects, factorial LIMMA analysis was conducted comparing ligand (T3) with over-expression of the TRa
or TRb (‘‘TR over-expression with ligand effect’’; interaction between T3 and over-expression of TRa or TRb), followed by
contrast analysis. All analysis was corrected for multiple hypothesis testing [27], and effects determined to be significant when$2-fold with an adjusted p-value # 0.05 when compared to their respective parental cell line. To facilitate comparisons among the various datasets, all data was uploaded into a SQLite3 database [28]. Heatmaps were produced and clustered using multiarray viewer [29].
qPCR
Real-time qPCR in HepG2 samples was performed with the Roche LightCycler 480 RT PCR Instrument using SYBR Green Mastermix (Roche). The sequences of the primers are listed in Table S1. The data were collected and analyzed using the comparative threshold cycle method. Experiments were performed at least three times, and the mean6SE was calculated using the Prism curve-fitting program (GraphPad Software, version 3.03; GraphPad). For HeLa, qPCR was performed using SYBR Green PCR Master Mix (Applied Biosystems) on ABI 7900HT RT-PCR system (Applied Biosystems) with default two-step QRT-PCR program. Amplification curves were evaluated by the comparative Ctanalyses.
Calculation for categorizations of expression patterns
Custom Python scripts were used to organize the expression patterns into induced and repressed effects, through the calcula-tion of minimal Euclidean distances between nine hypothetical patterns (2-by-3; unliganded and liganded effect expressed as induced (e.g., 2-fold), repressed (e.g., 0.5-fold) or no effect (e.g., 1)) and that experimentally derived. The hypothetical patterns (unliganded, ligand) were: pattern RR = 0.5, 0.5; pattern RO = 0.5, 1; pattern RI = 0.5, 2; pattern OR = 1, 0.5; pattern OO = 1, 1; pattern OI = 1, 2; pattern IR = 2, 0.5; pattern IO; 2, 1; pattern II = 2, 2. Note, hypothetical pattern OO translates to no substantial effect with TR over-expression (unliganded effect) or T3-treatment (ligand effect) and was not included in the final table.
All probes with a BH adjusted p-value,= 0.05 within the 3 hr HepG2 and 24 hr Hela treatments were analyzed. To lessen the effect of extremes, fold-change values were first transformed to 2 or 0.5 if their fold-change values were.2 or,0.5, respectively. Euclidean distances were then calculated, and the probe/gene transcript grouped into the hypothetical pattern that delivered the
minimal Euclidean distance between the experimental and/or the transformed vector and the hypothetical pattern vector. The genes were subsequently translated from Probe_ID to official gene name using an SQLite database.
Results
Cells that Express Comparable Levels of TRa1 or TRb1
We created two sets of TR-expressing cells to compare actions of major TR subtypes at endogenous genes. For HepG2 liver cells, we used a retroviral infection to express epitope-tagged (Flag) TRa1 or TRb1. For HeLa, we used stable transfection to express epitope-tagged (myc) TRs under tetracycline control (tet-off system, Fig. S1). We screened multiple clones of both cell types by western, using antibodies against respective epitope tags to facilitate direct comparisons of protein levels, and identified pairs of cell lines with comparable TRaand TRbexpression (Fig. 1A).
Figure 3. Heatmap to Illustrate Patterns of T3 Response in
HepG2. A. Representation of changes in all T3-dependent genes that meet cutoffs for fold induction/statistical significance in HepG2 parental cells and HepG2-TRa or HepG2-TRb cells at each time point. Red, upregulated, green, downregulated, black, no change. Genes were clustered according to similarities in response patterns as described in Methods.B. As for Fig. 3A, with a section of the heatmap expanded to reveal one of the clusters of late emerging TRb-preferential T3 responses.
We confirmed that exogenous TRs were recognized by antibodies against TR primary sequences, that these TRs were expressed at higher levels than endogenous TRs, which were either present at very low levels (TRb in HepG2 [22]) or undetectable (TRa in HepG2 and both TRs in HeLa) and that expressed TRs were of correct molecular weight (Fig. S2 and not shown). We also verified that TR expression was stable over several passages (not shown).
Exogenously expressed TRs are functional. We verified that the presence of the tag did not affect TR function in transient transfections, in which we compared native and tagged TRs (Fig. S3 and not shown). We were also unable to detect any major differences between the function of exogenously expressed TRs versus previous assessments of endogenous TR function. Hormone binding analysis confirmed that TRs exhibit affinities for T3that
are consistent with previously reported values (Fig. 1B and not shown). This data also allowed us to estimate numbers of T3
binding sites per cell (i.e. TRs), which were between 7-10,000 in transfected cells versus essentially undetectable in parental cells
[22] and within physiological range (,10,000 receptors per cell) [30]. Exogenous TRs conferred T3responses on standard
TRE-dependent reporters in both cell types (Fig. 1C and not shown). Further, T3elicited similar levels of activation with TRaand TRb
at a DR-4 reporter but larger levels of activation with TRbat an IP-6 reporter, in accordance with previous results [17]. Finally, TR steady state levels were diminished after T3 treatment
(Fig. 1D); this phenomenon is common to many NRs and a consequence of ubiquitin-dependent turnover of activated recep-tors [31]. Interestingly, however, TRalevels were rapidly reduced (within 1 hour of T3addition) whereas TRblevels only obviously
became diminished after extended ligand treatments.
TRaand TRbRegulate Similar Gene Sets in HepG2 with Different Kinetics
We performed transcriptome wide analysis of TR target genes in our HepG2-TR cells and parental HepG2 controls after 3, 6 and 24 hr induction with saturating (100 nM) T3. Since HepG2
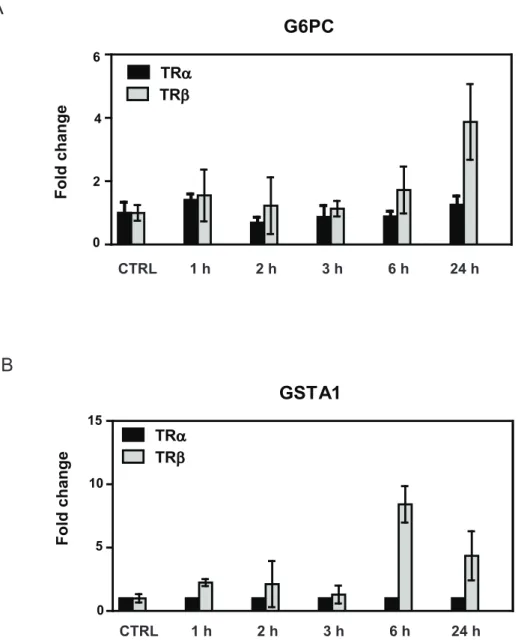
Figure 4. Verification of TRbpreference of late responding genes.qPCR analysis of T3induction of two genes (A, G6Pc andB, GSTA1) identified as preferential late TRbresponders. Note that TRa-responses are weak and that TRbpreference persists across all timepoints.
expresses low levels of endogenous TRb1, we examined interac-tion between treatment and cell line (i.e. T3+TR over-expression)
to determine TR-specific effects.
Most T3responses required exogenous TRs (Fig. 2A–D, Fig. 3).
As we previously reported [22], a few genes responded to T3in
parental HepG2 cells, with around 17 meeting cut-offs (.2.0 fold, BH-adjusted P value 0.05) at 24 hrs. This is due to vanishingly low levels of functional TRb present in HepG2 [22]. By contrast, hundreds of genes responded to T3in cells that express either of
the two TRs (Fig. 2A–D). Of these, the majority (more than 70%) were induced by T3 with the remainder repressed. Additionally,
most genes that exhibited T3responses in parental HepG2 cells
exhibited amplified responses in the presence of exogenous TRs. The sole exception was that we discovered expression of the highly T3responsive ANGPTL4 gene, a verified direct TRb target in
parental HepG2 cells [22], was silenced by exogenous TRs when we performed qPCR analysis (Fig. S4). We confirmed that enhanced T3 responses seen in the presence of transfected TRs
in HepG2 were dependent upon exogenous TR expression using an siRNA specific to the 59 portion of the dual EGFP/TR transcript to inhibit exogenous TR expression (Fig. S5).
Unexpectedly, different numbers of genes met cutoffs for fold induction and statistical significance with TRaand TRbat each of the three times (Fig. 2A–C). More T3responsive genes appeared
with TRa at 3 and 6 hrs (Fig. 2A, B), whereas TRb responses predominated at 24 hrs (Fig. 2C). Overall, similar numbers of genes exhibited T3 -responses when all three times were
considered together (Fig. 2D). Closer analysis revealed no completely TR subtype-specific genes within the datasets, there was a high degree of overlap between TRaand TRbresponsive genes and nearly all genes that responded to T3with either TRa
or TRb at any of the three time points exhibited qualitatively similar responses with the other TR in at least one time point (Fig. 3A and not shown).
To better understand differential kinetics of T3 response in
HepG2-TRa1 cells and HepG2-TRb1 cells, we compared fold T3
induction/repression of each gene (Probe_ID) in the presence of the two TRs (Fig. 2E–H). Although there were more TRaselective genes at 3 and 6 hrs, there was a strong apparent correlation between fold induction/repression when the two TRs are compared (Fig. 2E, F). Visual inspection (Fig. 3A, not shown) and statistical correlation analysis suggested that many of the apparently TRa-selective genes responded in a similar fashion to TRb, but that T3response sometimes failed to meet cutoffs for fold
induction and/or statistical significance resulting in the discrep-ancies between numbers of regulated genes. While there was also apparent correlation between overall TRaand TRbresponses at 24 hrs (Figs. 2G, H; Fig. 3A, B), we observed a shift in slope that
Figure 5. T3Induced Genes are Direct TR Targets. A. Bar graph representing numbers of T3induced (upper panels) and repressed (lower panels) genes at 3 hrs in HepG2-TRaand HepG2-TRbcells that persist with CHX pre-treatment (upper panel, red, lower panel, blue).B. Heat map representing gene expression changes at 3 hrs timepoint in HepG2-TRaand HepG2-TRbcells with T3, CHX and T3+CHX. Note that most target genes retain their T3responses with CHX. Examples of genes with unusual responses are marked by lower case letters: a = stronger T3responses with TRa, b = amplification of weak T3responses in the presence of TRbwith CHX, c = selective CHX-dependent gene induction in the presence of TRa, d = selective CHX-dependent gene induction in the presence of TRb.
reflected an increase in the number of genes (probes) responding to T3in the presence of TRb versus TRa, resulting in a deviation
from the straight line relationship at the earlier time points. The latter phenomenon reflected emergence of a subset of genes with preferential TRb responses, although all members of this gene class exhibited qualitatively similar regulation by TRa in at least one earlier time point (see Fig. 3B). We used qRT-PCR analysis to confirm that members of this strongly TRb-dependent late responding gene set (G6Pc, GSTA1) retained preferential TRb
responses that persisted over multiple T3incubation times (Fig. 4).
Together, our data suggests that TRs regulate similar gene sets but with different kinetics in HepG2; T3responses emerge earlier
with TRaversus TRb. Further, a strongly TRb-dependent subset appears after prolonged T3treatment.
T3-induced Genes are Direct TR Targets
We determined the proportion of T3responsive genes that were
direct TR targets (Fig. 5). To do this, we examined effects of pretreatment with the protein synthesis inhibitor cycloheximide (CHX) upon T3 response at 3 h and defined direct targets by
persistence (at least 100%) of gene expression obtained with T3
after CHX treatment relative to levels obtained with T3 alone.
Most (.80%) of the genes that are positively regulated by T3are
scored as direct targets by these criteria (Fig. 5A upper panel). Investigation of remaining positively regulated genes revealed that some T3activation persisted in the presence of CHX for many of
the remaining 20% of genes, suggesting that representation of direct TR targets within this dataset may be even larger than this analysis suggests (Fig. 5B, not shown). Interestingly, a much smaller proportion of negative T3responses persisted after CHX
treatment versus positive responses (Fig. 5A, lower panel). This suggests that novel protein synthesis is needed for T3repression in
this cellular context. In total, CHX treatment only completely abolished T3 response of a small subset of genes (Fig. S6);
responses of<11% of all genes that displayed 2- or greater fold
responses to T3at 3 hrs were completely inhibited by CHX. These
are likely to represent secondary responses to T3-dependent
changes in protein levels.
As seen with the complete dataset, we observed little TR subtype selectivity among direct TR targets (Fig. 5B). Some T3
responsive genes display stronger TRaresponses and qualitatively similar but weaker responses with TRb; this is evident from comparison of columns 1 and 4 in the heat map (some examples of this set of genes marked ‘‘a’’). However, T3 responses mostly
persisted with CHX in the presence of both TRs and we even detected cases of amplification of weak T3response with TRbin
the presence of CHX (examples of this set of genes marked ‘‘b’’). There were also gene-specific interactions of TRs and CHX; some genes were selectively de-repressed by CHX treatment alone in the presence of one of the two TRs (TRa selective de-repression is marked ‘‘c’’ and TRb selective de-repression marked ‘‘d’’). In general, however, most direct target genes appear similarly regulated by both TRs.
TR/Gene-Selectivity in T3-response
Within broad TR response patterns outlined above, there was gene-specific variability of T3regulation patterns and we verified
some of these observations using RT- qPCR (Fig. 6). Many genes displayed similar time courses of T3 induction with both TRs
(PCK1, Fig. 6A), but others exhibited differential responses to the at individual time points (SLC16A6, Fig. 6B) and yet others displayed sustained preferential responses to TRb(HIF2A; Fig. 6C) or to TRa(MYH6 Fig. 6D). Thus, differences in magnitude and kinetics of T3response with the two TRs are reflected at the level
Figure 6. Verification of different T3response patterns in HepG2 cells.Results of qPCR analysis of representative gene expression changes at various times after T3induction in HepG2-TRaand HepG2-TRbcells.A, PCK1, similar with both TRs,B, SLCA16A, similar with both TRs at most times,C, HIF2A, TRbpreference at both early and late times,D, Myh6, TRapreference at early and late times.
of the global T3-dependent gene expression program (Figs. 2 and
3) and at individual gene-specific responses (Fig. 6).
Similar TRaand TRb Responses in HeLa cells
To extend comparative analysis of TR subtype effects, we examined T3responses in HeLa cells that express exogenous TRs.
Here, TR expression was induced by doxycyclin withdrawal for 24 hrs; this regimen elicited optimal TR mRNA induction (Fig. S7). We then treated cells +/2 saturating T3 (100 nM) for a
further 24 hrs.
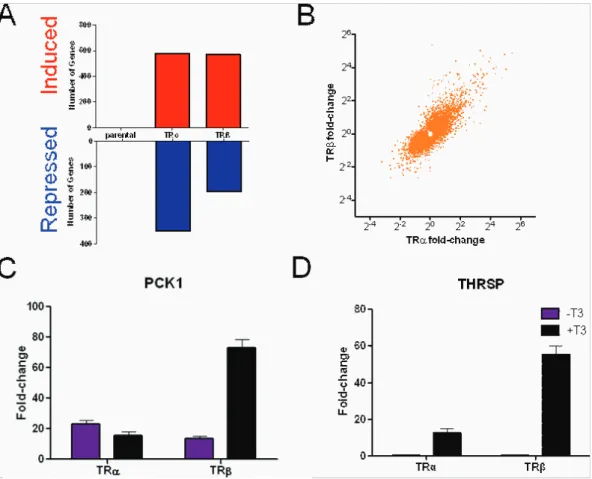
More genes responded to T3in the presence of TRs in HeLa
cells than HepG2 cells (Fig. 7A). All responses were dependent on exogenous TRs; unlike HepG2 cells, our HeLa cells lack detectable TR protein and transcripts (not shown). Like HepG2 cells, however, the majority of genes were induced by T3and there
was near complete overlap between TRaand TRbtarget genes; plots of T3 responses with TRb versus TRa again revealed
apparent correlation between induction/repression for most genes (Fig. 7B). This extends our conclusion that TRa and TRb
responses are broadly similar and also implies that late TRb -specific effects observed in HepG2 are a feature of the latter cell type.
Also as seen in HepG2, we detected genes which exhibit preferential responses to TRaor TRband verified some effects with qRT-PCR. PCK1 was strongly induced by T3with TRbbut
not TRa, although both TR subtypes enhanced transcript abundance without ligand (Fig. 7C). PCK1 was strongly T3
-dependent in HepG2-TRa and HepG2-TRb cells (see Fig. 4B) implying that this is a cell-specific effect. More commonly, and similar to HepG2, we observed TR subtype specificity in magnitude of T3response; for example, theTHRSPgene displayed
stronger T3induction with TRbversus TRa(Fig. 7D).
Figure 7. T3Responses in HeLa cells. A. Numbers of genes that meet cutoffs for fold T3activation (upper panel, blue) or repression (lower panel, red) in HeLa-TRaand Hela-TRbcells at 24 hrs treatment, as in Fig. 2.B. Plots of fold induction/repression by T3in the presence of TRb(y-axis) versus TRa(x-axis) in HeLa cells.C–D. Representative qPCR analysis showing examples of different gene regulation patterns with the two TRs.C, pck1,D, thrsp.
doi:10.1371/journal.pone.0052407.g007
Figure 8. Partial overlap of T3regulated genes in HepG2 and
HeLa.Venn diagrams of numbers of T3induced and repressed genes identified in each cell type with TRaand TRband overlaps.
Finally, there was only limited overlap between T3-regulated
gene sets in HepG2 and HeLa (Fig. 8). These differences were not explained by failure to meet cut-offs for fold induction and TRs did regulate different gene sets in the two cell types. This means that strong overlap between TRa and TRb target genes occurs with two largely distinct gene sets of T3regulated genes in two cell
types.
Unliganded TRaand TRb Regulate Similar Gene Sets
Since TRs are transcriptionally active without hormone [3,4], we compared effects of unliganded TRa and TRb in both cell types (Fig. 9A–D). To do this, we assessed differences in gene expression in HepG2-TR cells versus HepG2 parental cells and parental HeLa cells versus HeLa-TR cells after 24 hrs doxycyclin withdrawal.
Unliganded TRs influenced many genes in both experimental systems (Fig. 9A, B). Expression of more than two thousand genes was altered by the presence of unliganded TRs relative to parental controls in HepG2 cells; with similar numbers up- and down-regulated. Large numbers of genes (<1000) also responded to
short term TR induction in HeLa cells and, again, similar numbers of genes were up and down-regulated. More TR-dependent genes met fold cutoff and statistical significance with
unliganded TRaversus TRbin both cell types. As seen with T3
regulation, however, these differences were generally qualitative and not absolute and we observed an essentially linear relationship between induction/repression with unliganded TRaand TRbin both cell types even though some probe sets suggested preferential response to one of the two TR subtypes (Fig. 9C, D).
Gene-Specific Variations in Pattern of Response to TRs+/2T3
Next, we examined specific patterns of target gene regulation by TRs [14]. To do this, we grouped genes with statistically significant responses to unliganded TR or T3 into categories
according to whether they are repressed (R), unaffected (O) or induced (I) relative to basal gene expression levels in parental cells (Methods and Fig. 10/Table 1/Table S2). In this way, TR and T3
-dependent genes could be placed into one of eight response patterns shown in the heat map at left. Another category, ‘‘OO’’, included genes that displayed small changes in response to TR or T3 that reached statistical significance, but was assigned to the
non-responsive pattern and are not shown (see Methods). We detected examples of all classes of predicted responses to TR
+/2 T3 (Fig. 10/Table 1/Table S2). As seen in previous study
[16], a small percentage of genes were constitutively repressed or
Figure 9. Gene expression changes with unliganded TRs. A. Numbers of genes that meet fold cutoffs for activation/repression and statistical significance in response to unliganded TR expression in HepG2 cells, TRaand TRbexpressing cells were compared to parental.B. HeLa cells, TRaand TRbexpressing cells after doxycycline withdrawal to induce TRs versus doxycyclin treated cells. Similar results were obtained in comparisons with parental HeLa cells (not shown).C. Plots of fold induction/repression by TRb(y-axis) versus TRa(x-axis) in HepG2 cells.D. Plots of fold induction/ repression by TRb(y-axis) versus TRa(x-axis) in HeLa cells.
induced by TRs (patterns RR and II), and we verified some observations with qRT-PCR (Fig. 11, MST1, hel308 and also see Fig. S4). Other genes were activated or repressed by T3, with a
majority displaying one of several possible patterns of positive T3
response (R0, RI, 0I) and a large minority exhibiting one of several patterns of negative regulation in response to T3 (0R,0I, IR).
Distributions of genes between different categories of positive and negative response varied with cell type. In HepG2, large majorities of positively and negatively regulated genes grouped into pattern R0 and pattern I0, respectively. Interestingly, these response patterns were mirror images of each other, with unliganded TR repressing positively regulated genes or activating negatively
regulated genes and T3 reversing these effects. By contrast, the
response patterns were more evenly distributed in HeLa. Although TRs regulated similar numbers of genes in the same way, there was only limited overlap between genes that grouped into the same pattern with TRaand TRb(Fig. 10). This suggests that relatively subtle differences in magnitude of response to TRs
+/2 T3 can translate into different response patterns. We
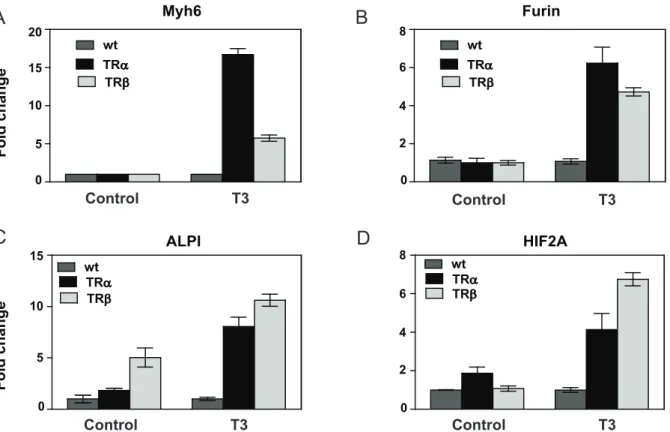
confirmed this impression at a limited set of target genes with qRT-PCR (Fig. 12A–D). For example, Myh6, Furin, ALPI and HIF2A are all induced by T3but Myh6 and furin exhibit the same
basic regulation pattern (Fig. 12A, B, pattern 0I), but ALPI is induced by unliganded TRb(pattern II) and not TRa(pattern 0I) whereas HIF2A is induced by unliganded TRa(Fig. 12C, pattern II)) and not TRb(Fig. 12D, pattern 0I).
TR Subtype and Gene Selectivity in T3Dose Response
Finally, we performed a limited survey of relationships between T3dose response, TR subtype and gene (Table 2 and Fig. S8). To
do this, we examined effects of varying doses of T3upon selected
TR targets in HepG2 cells. Most genes exhibited EC50values in
the low nM range (<1 nM), but TRaexhibited some gene-specific requirements for lower T3 concentrations (klf9, pck1) whereas
TRb exhibited gene-specific requirements for higher T3 levels
(furin, alpi, myh6, hr). The combination of these effects means that many genes exhibit similar T3 concentration-dependence in the
presence of both TRs whereas others exhibited differential responses to T3 with TRa and TRb, with EC50 values varying
up to 30-fold when different genes and response to TR subtype are considered. It was noteworthy that higher levels of T3were needed
for optimal induction with TRb in most cases of differential concentration dependence.
Discussion
In this study, we compared effects of equal levels of exogenous TRs upon endogenous genes, +/2 T3, in different cell
backgrounds (HepG2 and HeLa) to determine the prevalence of TR subtype specific genes. While hundreds of genes respond to T3
or to unliganded TRs in both cell types, and there are differences in degree of response+/2T3, we were unable to identify truly TR
subtype-specific genes in either cell background; i.e. genes which respond only to one TR subtype and not the other. We conclude that TRaand TRbregulate the same genes, different from some homologous NR pairs such as the ERs and classic steroid receptors. Our results agree with previous studies of other groups who found that TRs regulate the same genes in mouse liver [14] and in a prior study conducted in HepG2 cells [16].
While TRaand TRbmay regulate the same genes, their actions are far from identical. Part of our analysis overlaps a previous study of similar design by Chan and Privalsky [16], who also stably expressed exogenous TRs in HepG2 cells and found strongly overlapping responses to TRaand TRbafter 6 hrs T3induction
but with gene-specific differences in magnitude of response to the two TR subtypes. While our results do not precisely reproduce previous findings, we regard differences as minor and emphasize that there is remarkable concordance between the key points of the two studies. Chan and Privalsky observed fewer genes that responded to T3 (<40 versus 150–300) or unliganded TRs
(<100 versus 1500–2000) and detected a stronger bias towards
TRa versus TRb responses. Both discrepancies are probably explained by differences in TR expression levels. Our comparisons of levels of TR transcripts relative to parental cells in both datasets (not shown) suggest that our cells express more TRs, explaining detection of more TR target genes in our stably transfected
Figure 10. Hypothetical patterns of TR regulation.Genes with statistically significant responses to T3or unliganded TRs were assigned into categories according to net repression (R), induction (I) or no change (O) represented in the schematic heat map. Numbers of genes in each category and overlaps between genes that respond to TRaor TRbin this manner are shown in Table 1.
doi:10.1371/journal.pone.0052407.g010
Table 1.Patterns of TR regulation.
HepG2 HeLa
Pattern TRa TRb Overlap TRa TRb Overlap
RR 67 38 7 189 105 37
RO 1587 1737 1071 1129 607 280
RI 202 103 71 462 388 187
OR 124 46 25 1311 1147 598
OI 153 71 49 726 634 303
IR 156 103 44 452 317 124
IO 1011 1305 762 506 323 108
II 36 21 12 112 63 18
HepG2 cells. Moreover, evidence described in the Chan and Privalsky study suggests that their cells may express more TRa
than TRb, explaining observed TRa bias. More importantly, however, both groups conclude that TRs regulate the same genes, all genes flagged as T3regulated in the Chan study appear in our
dataset at the 6 hr time point and regulation patterns appear very similar in both analyses (not shown). Our analysis therefore confirms conclusions of this study and, because it also includes extra time points and two cell types, confirms and extends the conclusion that TRs regulate the same genes with differences in precise magnitude of response. Additionally, the fact that we have confirmed that many early responding genes are direct TR targets with CHX treatment indicates that many differential effects must be related to primary differences in direct TR actions.
Our study has also uncovered other ways that TRa and TRb
differ. First, most T3responses tend to be stronger with TRa at
earlier times and with TRb at 24 hrs, although there are numerous counter-examples of individual genes which deviate from this pattern. Second, a large set of late responding highly TRb-specific genes appears in HepG2 cells. Third, we find that TR subtype preferences in magnitude of T3response may appear
at selected time points or persist across several time points. Fourth, differences in magnitude of response+/2T3means that the two
TR subtypes exhibit different regulation patterns at individual genes. Finally, we detect variations in T3dose response in a limited
survey of target genes and this effect displays a TR subtype-selective component.
Our experiments do not address mechanisms of differential effects, but do permit speculation about possible causes:
1. We suspect that there are fundamental differences in kinetics of T3activation processes in the HepG2 experimental system. We
note that: i) faster transcriptional responses to TRa are
Figure 11. Unusual ligand-independent TR gene-regulation patterns. qPCR verification of genes that display hormone-independent repression by both TRs in HepG2.A, mst1,B, hel308.
paralleled by faster T3-dependent reductions in steady state
TRalevels versus TRb; this often reflects ubiquitin-dependent turnover of transcriptionally active complexes [31] and ii) some verified early direct TRatargets display similar but slower T3
responses with TRb(see heat map in Figure 5).
2. Early T3-dependent changes in gene expression seem to foster
an intracellular environment that enhances TRb actions at some genes; the late HepG2 TRb-dependent gene set also responds weakly to TRa suggesting that prolonged T3
treatment selectively augments TRb action in these contexts. One possible explanation for this effect is that TRs may induce differential expression or activity of transcription factors that regulate downstream genes and possibly cooperate with TRs in some contexts.
3. We note that TRa and TRb subtype- and gene-selective actions emerge within the context of wide gene-specific variations in TR action that have also been observed by other groups [14,16]. We observed that: a) some genes respond to low levels of endogenous TRs in HepG2 parental cells whereas others require exogenous TR expression to mount a detectable response and one gene (ANGPTL4) that is a verified direct TRb target in parental HepG2 cells [22] is even silenced by TR overexpression, b) magnitude and direction of response to T3and unliganded TRs varies widely, c) there are gene-specific
interactions between CHX and T3, see Figure 5 d) there are
variations in response patterns of both activated and repressed genes+/2T3and this effect displays a cell-specific component
and e) T3dose response is gene-specific. We suggest that these
gene-specific variations in response reflect gene-context specific
variations in mechanisms of TR action and that some of these, in turn, highlight differences in TRa and TRb function that are not always apparent from standard reporter assays alone. Elucidation of mechanisms of these effects will require better understanding of gene architecture and TR influences upon transcription factor and cofactor recruitment and we propose that systems described within this paper will help us to dissect influences of gene context upon precise mechanisms of TR action.
Figure 12. Verification of TR subtype preferences in gene regulation pattern. A, Myh6B, furin. Both genes display the same pattern of response to unliganded TRs and T3, despite preferential T3induction of Myh6 with TRa.C, ALPI, display exclusively ligand-dependent induction with TRaand ligand-dependent induction with TRbcoupled to a strong ligand-independent component.D, HIF2A, displays the opposite profile to ALPI in Fig. 12C.
doi:10.1371/journal.pone.0052407.g012
Table 2.T3concentration dependence of gene induction.
Gene EC50TRa(nM) EC50TRb(nM)
HIF2A 1.661 1.651
HIF1A 3.104 1.158
SLC16A6 0.676 1.408
FURIN 1.004 2.795
ALPI 1.152 4.723
KLF9 0.165 0.846
MYH6 1.220 11.50
PCK1 0.1121 2.037
HR 0.9951 32.20
Table summarizing deduced EC50values for induction of different genes after 24 hrs T3treatment in HepG2-TRaand HepG2-TRb.
Finally, it is important to consider whether gene-specific differential actions of TRa and TRb also occur in vivo and possible physiologic impacts of such effects. We know from previously published studies of wild type and TR gene knockout mice that some gene-specific TR behaviors that we have been able to document in culture have direct parallelsin vivo; these include variations in patterns of TR regulation +/2 T3 and in T3
concentration dependence [14]. This implies that at least some of the gene-specific differential effects seen in our study will also be observed in vivo. Indeed, our initial survey of effects of TRb
knockout upon endogenous liver genes in mice revealed that T3
response of all genes is diminished but that there are more severe effects at some genes than others (not shown), implying different contributions of TRaand TRbto T3response.
We can imagine two situations in which gene-specific differen-tial TR actions would be physiologically important. First, TRa
and TRbexpression is highly influenced by diurnal rhythm [32]. Thus, variations in TR protein levels could affect the TR target repertoire based upon whether a particular target gene responds preferentially to TRaor TRb; such differential effects would be observed even without changes in T3 levels. Second, TRb and
liver selective thyromimetics (STRMs) such as GC-1 (sobetirome) and KB2115 (eproterome) have been developed to selectively lower serum cholesterol without deleterious effects on heart and combat other aspects of metabolic disease [12]. Some natural TR ligands such as TRIAC are also TRbselective [23]. Doses of such ligands that activate TRbbut not TRawould be expected to alter gene expression in a TRbbiased manner that would differ from T3, which binds the two TRs with similar affinity. It will be
interesting to determine whether any such TR subtype and gene-specific effects occur in vivo and whether their impact is physiologically or pharmacologically important.
Supporting Information
Figure S1 TR induction by doxycyclin withdrawal. Western blot showing TRb expression levels (anti-myc, as in Fig. 1A) after 24 hrs treatment with increasing doxycyclin concentrations up to 20 ng/ml.
(PPTX)
Figure S2 Exogenous TRs are recognized by antibodies against TR primary sequences. We compared TRb and TRa levels in HepG2-TR cells versus HepG2 cells+/21 hr T3treatment. The
panel shows representative western blots of HepG2-TR and HepG2 cell extracts probed with TR antibodies. Antibodies were TRb(TRb72–93; BabCO, Berkeley Antibody Co., now Covance, Richmond, CA, see reference [22]) and TRa(abcam: ab53729). Secondary antibody was goat anti-mouse IgG-HRP conjugate from Santa Cruz Antibodies.
(PPTX)
Figure S3 The TR expression tag does not affect T3response in
transient transfection assays. The panel shows luciferase activities at a standard DR-4 reporter with equivalent (optimal) levels of transfected wild type TRbexpression vector or similar flag-TRb
vector. (PPTX)
Figure S4 Silencing of ANGPTL4 expression by TR overex-pression. Results of qPCR analysis to show ANGPTL4 expression levels +/_ T3 in parental HepG2 cells versus HepG2-TR cells.
Note the silencing of T3response and strong suppression of basal
expression levels by unliganded TRs. (PPTX)
Figure S5 SiRNA directed against the upstream EGFP coding sequences selectively inhibits responses to exogenous TRs. HepG2-TRb cells were transfected with 5 nM Qiagen negative control siRNA (siRNA_Qiagen-NC) ‘‘UUCUCCGAACGUGU-CACGU’’ or and siRNA-EGFP ‘‘GCCACAACGUCUAUAU-CAUGG’’, treated with DMSO (vehicle) or 100 nM T3 24 hr later post siRNA transfection, and RNA was isolated 24 hr later. The left panel shows relative expression of TRb +/2 T3 in the presence of control or EGFP siRNA confirming efficient knockdown of TRb transcripts in HepG2-TRb cells (similar knockdown was observed for EGFP). The right panel shows inhibition of T3 response at the highly induced C10orf10 gene
with the EGFP siRNA treatment and not Qiagen negative control (QNC) siRNA. Similar results were obtained with other T3
induced genes in the HepG2-TRb cells, including anxa1, pck1, slc16a6, and scnn1a. Data presented represents 3 biological replicates, and bars with the same letters are not statistically different (adjusted p-value.0.05; ANOVA, Tukey-HSD on (C10orf10_Cp) - (RPS27A_Cp)).
(PPTX)
Figure S6 Heatmap showing a subset of ‘‘indirect’’ T3 target
genes, implied by a disruption of the T3-response in the presence
of CHX. Seventeen probes (genes) of the 158 probes (156 genes) that displayed a$2-fold fold-change and Benjamini-Hochberg adjusted p-value,= 0.1 (i.e., T3 vs. Ctrl treatment) in either
HepG2-TRaor HepG2-TRbcells were determined to be indirect targets based on the compromise of the T3-response within the
presence of CHX. (PPTX)
Figure S7 Time course of TR induction in HeLa cells. A. Results of qPCR analysis showing optimal induction of TRb
transcripts after 24 hrs DOX withdrawal. B. Induced TR is functional as observed in the known TR gene targetthrsp. Note that expression of this gene is strongly suppressed in response to TR induction within the 24 hr time period of DOX withdrawal. (PPTX)
Figure S8 Representative concentration dependence curves. qPCR analysis of T3 response. 24 hrs treatment with varying
amounts of T3shown on the x-axis. Note differences in response
curve for KLF9 in the presence of TRaand TRb. (PPTX)
Table S1 PCR primer information. (XLSX)
Table S2 TR regulated gene pattern information. (XLSX)
Acknowledgments
We wish to honor the memory of John D. Baxter (deceased) whose insights into thyroid hormone action inspired this study.
Author Contributions
References
1. Yen PM (2001) Physiological and molecular basis of thyroid hormone action. Physiol Rev. 81: 1097–142.
2. Cheng SY, Leonard JL, Davis PJ (2010) Molecular aspects of thyroid hormone actions. Endocr Rev. 31: 139–70.
3. Glass CK, Rosenfeld MG (2000) The coregulator exchange in transcriptional functions of nuclear receptors. Genes Dev. 14: 121–41.
4. Astapova I, Hollenberg AN (2012) The in vivo role of nuclear receptor corepressors in thyroid hormone action. Biochim Biophys Acta.
5. Fondell JD (2012) The Mediator complex in thyroid hormone receptor action. Biochim Biophys Acta.
6. Forrest D, Vennstrom B (2000) Functions of thyroid hormone receptors in mice. Thyroid. 10: 41–52.
7. O’Shea PJ, Williams GR (2002) Insight into the physiological actions of thyroid hormone receptors from genetically modified mice. J Endocrinol. 175: 553–70. 8. Flamant F, Gauthier K (2012), Thyroid hormone receptors: The challenge of elucidating isotype-specific functions and cell-specific response. Biochim Biophys Acta.
9. Bassett JH, Williams GR (2009) The skeletal phenotypes of TRalpha and TRbeta mutant mice. J Mol Endocrinol. 42: 269–82.
10. Weiss RE, Refetoff S (2000) Resistance to thyroid hormone. Rev Endocr Metab Disord. 1: 97–108.
11. Bochukova E, Schoenmakers N, Agostini M, Schoenmakers E, Rajanayagam O, et al. (2012) A mutation in the thyroid hormone receptor alpha gene. N Engl J Med. 366: 243–9.
12. Baxter JD, Webb P (2009) Thyroid hormone mimetics: potential applications in atherosclerosis, obesity and type 2 diabetes. Nat Rev Drug Discov. 8: 308–20. 13. Feng X, Jiang Y, Meltzer P, Yen PM (2000) Thyroid hormone regulation of
hepatic genes in vivo detected by complementary DNA microarray. Mol Endocrinol. 14: 947–55.
14. Yen PM, Feng X, Flamant F, Chen Y, Walker RL, et al. (2003) Effects of ligand and thyroid hormone receptor isoforms on hepatic gene expression profiles of thyroid hormone receptor knockout mice. EMBO Rep. 4: 581–7.
15. Thomas C, Gustafsson JA (2011) The different roles of ER subtypes in cancer biology and therapy. Nat Rev Cancer. 11: 597–608.
16. Chan IH, Privalsky ML (2009) Isoform-specific transcriptional activity of overlapping target genes that respond to thyroid hormone receptors alpha1 and beta1. Mol Endocrinol. 23: 1758–75.
17. Velasco LF, Togashi M, Walfish PG, Pessanha RP, Barra GB, et al. (2207) Thyroid hormone response element organization dictates the composition of active receptor. J Biol Chem. 282: 12458–66.
18. Fugier C, Tousaint JJ, Prieur X, Plateroni M, Samarut J, et al. (2006) The lipoprotein lipase inhibitor ANGPTL3 is negatively regulated by thyroid hormone. J Biol Chem. 281: 11553–9.
19. Weinhofer I, Kunze M, Rampler H, Forss-Petter S, Samarut J, et al. (2008) Distinct modulatory roles for thyroid hormone receptors TRalpha and TRbeta in SREBP1-activated ABCD2 expression. Eur J Cell Biol. 87: 933–45. 20. Fozzatti L, Lu C, Kim DW, Cheng SY (2011) Differential recruitment of nuclear
coregulators directs the isoform-dependent action of mutant thyroid hormone receptors. Mol Endocrinol. 25: 908–21.
21. Chiamolera MI, Sidhave AR, Matsumoto S, He Q, Hashimoto K, et al. (2012) Fundamentally distinct roles of thyroid hormone receptor isoforms in a thyrotroph cell line are due to differential DNA binding. Mol Endocrinol. 26: 926–39.
22. Yuan C, Lin JZ, Sieglaff DH, Ayers SD, Denoto Reynolds, et al. (2012) Identical gene regulation patterns of T3 and selective thyroid hormone receptor modulator GC-1. Endocrinology. 153: 501–11.
23. Martinez L, Nascimento AS, Nunes FM, Philips K, Aparacio R, et al. (2009)
Gaining ligand selectivity in thyroid hormone receptors via entropy.Proc Natl Acad Sci U S A. 106: 20717–22.
24. Du P, Kibbe WA, Lin SM (2008) lumi: a pipeline for processing Illumina microarray. Bioinformatics 24: 1547–8.
25. Smyth GK (2004) Linear models and empirical Bayes methods for assessing differential expression in microarray experiments. Statistical Applications in Genetics and Molecular Biology: 3(1).
26. Team RDC (2009) R: A language and environment for statistical computing.
R Foundation for Statistical Computing: Vienna.
27. Benjamini Y, Hochberg Y (1995) Controlling the false discovery rate: a practical and powerful approach to multiple testing. Journal of the Royal Statistical Society. Series B (Methodological). 57: 289–300.
28. Hipp DR, SQLite.
29. Saeed AI, Sharov V, White J, Li J, Liang W, et al. (2003) TM4: a free, open-source system for microarray data management and analysis. Biotechniques. 34: 374–8.
30. Baxter JD, Eberhardt NL, Apriletti JW, Johnson LK, Ivarie RD, et al. (1979) Thyroid hormone receptors and responses. Recent Prog Horm Res. 35: 97–153. 31. Lonard DM, O’Malley BW (2009) Emerging roles of the ubiquitin proteasome system in nuclear hormone receptor signaling. Prog Mol Biol Transl Sci. 87: 117–35.