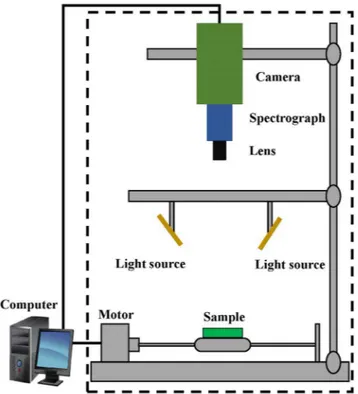
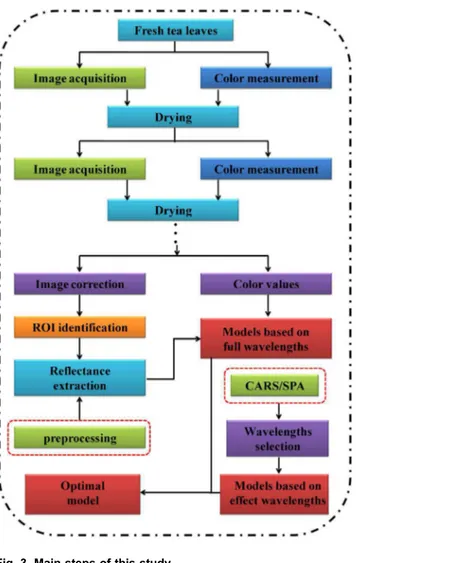
Color measurement of tea leaves at different drying periods using hyperspectral imaging technique.
Texto
Imagem


Documentos relacionados
From the 12 studies included (13 entries) in this meta-analysis, they all started from the same research assumption, in which the elderly with classifications according to the
A nossa estada no Rio de Janeiro durou vinte e três anos, esse período foi marcado pelo excelente convívio que tive com meus pais, principalmente com minha mãe e minha tia
composição química varia substancialmente dependendo da variedade de queijo ou caseína produzidos, do tipo de leite (bovino, caprino ou ovino), período do ano,
Again, notice that since the boundary data is in fact given by a pair of functions the jump condition can be expressed either in terms of the values on the 1- and 21-layer of
Outro dos recursos típicos do melodrama, o mistério, também é recorrente na obra de José Fortuna, como, por exemplo, em Lenda da valsa dos noivos, na qual a
No segundo capítulo é apresentada uma revisão bibliográfica sobre temas diretamente relacionados a esse trabalho, procurando destacar os principais conceitos sobre possíveis
essa iniciativa conjunta do poder público e da iniciativa privada, recebendo financiamento de ambos os setores, constituía um modelo para a futura expansão da educação
Com base em coletas de armadilha luminosa, realizadas de 1981 a 1993, na Mata do Paraíso (20°46’-20°48’S; 45°50’-45°52’W), reserva de Mata Atlântica situada no município
