CORRECTION
Correction: Estimated Dietary Intake of
Radionuclides and Health Risks for the
Citizens of Fukushima City, Tokyo, and Osaka
after the 2011 Nuclear Accident
Michio Murakami, Taikan Oki
There are errors in the values for LARS for thyroid cancer throughout the paper. Please see below for a description of the errors and their corrections.
There are errors in the last two sentences of the Abstract. The correct sentences are: Lifetime attributable risks (LARs) of thyroid cancers due to ingestion were 1.7–37×10−6(Case 1) and
5.6–79×10−6(Case 2) in Fukushima City, 0.73–13×10−6in Tokyo, and 0.04–0.49×10⁻⁶in
Osaka. The contributions of LARs of thyroid cancers due to ingestion were 5.4%–11% of all exposure (Case 1) and 11%–25% (Case 2) in Fukushima City.
There are errors in the seventh sentence of the“Lars of cancer incidence”section of the Results and Discussion. The correct sentence is: The LARs of thyroid cancers were 1.7– 37×10−6in Fukushima City (Case 1), 5.6
–79×10−6in Fukushima City (Case 2), 0.73
–13×10−6
in Tokyo, and 0.04–0.49×10⁻⁶in Osaka, and the maximum LAR in Fukushima City (Case 1)
was found in females<1 y old.
There are errors in the eleventh sentence of the“Lars of cancer incidence”section of the Results and Discussion. The correct sentence is: The contributions of131I to the lifetime-expo-sure thyroid doses were 88%-95% in Fukushima City (Case 1), 80%-91% in Fukushima City (Case 2), 89%–95% in Tokyo, and 42%–67% in Osaka.
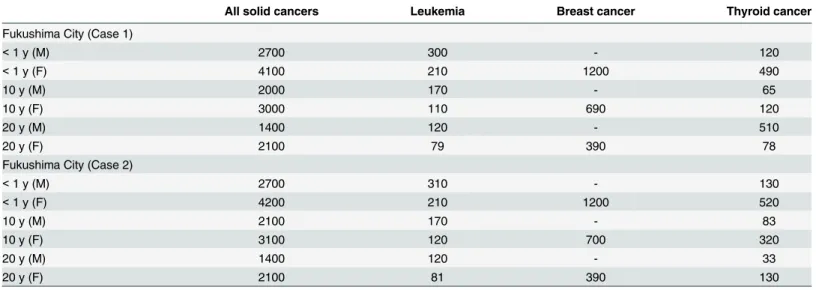
There are errors in the second and third sentences of the secondparagraph of the“Lars of cancer incidence”section ofthe Results and Discussion. The correct sentences are: The LARs of all solid cancers due to the three pathways were 1400–4100×10−6in Fukushima City (Case 1)
and 1400–4200×10−6in Fukushima City (Case 2); those of thyroid cancer were 29
–490×10−6in
Fukushima City (Case 1) and 33–510×10−6in Fukushima City (Case 2) (Table 4). The
contri-butions of LARs of all solid cancer due to ingestion were 0.3%–0.5% (Case 1) and 1.6%–3.1% (Case 2); those of thyroid cancer were 5.4%–11% (Case 1) and 11%–25% (Case 2).
There are errors in the first sentence of the last paragraph of the“Lars of cancer incidence” section of the Results and Discussion. The correct sentence is: As described above, the contri-butions of131I to the lifetime-exposure thyroid doses were>80% for Fukushima City, and the contributions of LARs from foods in the second and subsequent years were negligible.
There are errors in Tables3and4. Please see the corrected Tables3and4here.
PLOS ONE | DOI:10.1371/journal.pone.0136223 August 14, 2015 1 / 3
OPEN ACCESS
Citation:Murakami M, Oki T (2015) Correction: Estimated Dietary Intake of Radionuclides and Health Risks for the Citizens of Fukushima City, Tokyo, and Osaka after the 2011 Nuclear Accident. PLoS ONE 10(8): e0136223. doi:10.1371/journal.pone.0136223
Published:August 14, 2015
Copyright:© 2015 Murakami, Oki. This is an open access article distributed under the terms of the
Table 3. LARs for all solid cancers, leukemia, breast cancer, and thyroid cancer (×10−6) due to ingestion.
All solid cancers Leukemia Breast cancer Thyroid cancer
Fukushima City (Case 1)
<1 y (M) 8.6 0.57 - 9.0
<1 y (F) 12 0.36 1.5 37
10 y (M) 8.4 0.59 - 6.9
10 y (F) 11 0.36 1.5 27
20 y (M) 7.4 0.56 - 1.7
20 y (F) 9.8 0.34 1.1 6.4
Fukushima City (Case 2)
<1 y (M) 47 3.1 - 14
<1 y (F) 66 2.0 8.4 55
10 y (M) 51 3.5 - 20
10 y (F) 71 2.2 9.3 79
20 y (M) 45 3.4 - 5.6
20 y (F) 61 2.1 7.1 21
Tokyo
<1 y (M) 3.6 0.24 - 3.2
<1 y (F) 5.0 0.15 0.63 13
10 y (M) 3.6 0.25 - 2.9
10 y (F) 4.7 0.15 0.61 11
20 y (M) 3.0 0.23 - 0.73
20 y (F) 3.9 0.14 0.44 2.8
Osaka
<1 y (M) 1.4 0.09 - 0.08
<1 y (F) 2.0 0.06 0.25 0.32
10 y (M) 1.3 0.09 - 0.12
10 y (F) 1.8 0.06 0.23 0.49
20 y (M) 1.1 0.08 - 0.04
20 y (F) 1.4 0.05 0.16 0.16
Ages represent ones in thefirst year. Case 1, citizens consumed vegetables bought from markets. Case 2, citizens consumed vegetables grown locally.
doi:10.1371/journal.pone.0136223.t001
Table 4. LARs for all solid cancers, leukemia, breast cancer, and thyroid cancer (×10−6) due to external exposure, inhalation, and ingestion.
All solid cancers Leukemia Breast cancer Thyroid cancer
Fukushima City (Case 1)
<1 y (M) 2700 300 - 120
<1 y (F) 4100 210 1200 490
10 y (M) 2000 170 - 65
10 y (F) 3000 110 690 120
20 y (M) 1400 120 - 510
20 y (F) 2100 79 390 78
Fukushima City (Case 2)
<1 y (M) 2700 310 - 130
<1 y (F) 4200 210 1200 520
10 y (M) 2100 170 - 83
10 y (F) 3100 120 700 320
20 y (M) 1400 120 - 33
20 y (F) 2100 81 390 130
Ages are those in thefirst year. Case 1, citizens consumed vegetables bought from markets. Case 2, citizens consumed vegetables grown locally.
doi:10.1371/journal.pone.0136223.t002
Reference
1. Murakami M, Oki T (2014) Estimated Dietary Intake of Radionuclides and Health Risks for the Citizens of Fukushima City, Tokyo, and Osaka after the 2011 Nuclear Accident. PLoS ONE 9(11): e112791. doi:10.1371/journal.pone.0112791PMID:25390339