BGD
8, 1463–1481, 2011Forest aboveground NPP in Japan
Y. Wang et al.
Title Page
Abstract Introduction
Conclusions References
Tables Figures
◭ ◮
◭ ◮
Back Close
Full Screen / Esc
Printer-friendly Version
Interactive Discussion
Discussion
P
a
per
|
Dis
cussion
P
a
per
|
Discussion
P
a
per
|
Discussio
n
P
a
per
|
Biogeosciences Discuss., 8, 1463–1481, 2011 www.biogeosciences-discuss.net/8/1463/2011/ doi:10.5194/bgd-8-1463-2011
© Author(s) 2011. CC Attribution 3.0 License.
Biogeosciences Discussions
This discussion paper is/has been under review for the journal Biogeosciences (BG). Please refer to the corresponding final paper in BG if available.
Inventory-based estimation of
aboveground net primary production in
Japan’s forests from 1980 to 2005
Y. Wang1,*, J. Y. Fang1, T. Kato2, Z. D. Guo1, B. Zhu1,**, W. H. Mo3, and Y. H. Tang4
1
Department of Ecology, College of Urban and Environmental Sciences, and Key Laboratory for Earth Surface Processes of the Ministry of Education, Peking University, Beijing 100871, China
2
Research Institute for Global Change, Japan Agency for Marine-Earth Science and Technology, Yokohama, Kanagawa 236-0001, Japan
3
National Institute for Agro-Environmental Sciences, Tsukuba, Ibaraki 305-8604, Japan
4
National Inst. for Environmental Studies, Onogawa 16-2, Tsukuba Ibaraki 305-8506, Japan
*
now at: Department of Biological Sciences, Graduate School of Science, The University of Tokyo, Tokyo 113-0033, Japan
**
now at: Dept. of Environ. Studies, Univ. of California, Santa Cruz, California 95064, USA
Received: 25 November 2010 – Accepted: 17 December 2010 – Published: 17 February 2011
Correspondence to: J. Y. Fang ([email protected])
BGD
8, 1463–1481, 2011Forest aboveground NPP in Japan
Y. Wang et al.
Title Page
Abstract Introduction
Conclusions References
Tables Figures
◭ ◮
◭ ◮
Back Close
Full Screen / Esc
Printer-friendly Version
Interactive Discussion
Discussion
P
a
per
|
Dis
cussion
P
a
per
|
Discussion
P
a
per
|
Discussio
n
P
a
per
|
Abstract
Recent studies based on remote sensing and carbon process models have revealed that terrestrial net primary production (NPP) in the middle and high latitudes of the Northern Hemisphere has increased significantly; this is crucial for explaining the in-creased terrestrial carbon sink in the past several decades. Regional NPP estimation
5
based on significant field data, however, has been rare. In this study, we estimated the long-term changes in aboveground NPP (ANPP) for Japan’s forests from 1980 to 2005, using forest inventory data, direct field measurements, and an allometric method. The overall ANPP for all forest types averaged 10.5 Mg ha−1yr−1, with a range of 9.6 to
11.5 Mg ha−1yr−1, and ANPP for the whole country totaled 249.1 Tg yr−1(range: 230.0
10
to 271.4 Tg yr−1) during the study period. Over the 25 years, the net e
ffect of increased ANPP in needle-leaf forests and decreased ANPP in broadleaf forests has led to an increase of 1.9 Mg ha−1yr−1(i.e., 0.79% yr−1). This increase may be mainly due to the
establishment of plantations and the rapid early growth of these planted forests.
1 Introduction
15
Net primary production (NPP) is defined as the rate of accumulation of organic matter by vegetation and equals the difference between carbon assimilated by plants through photosynthesis and the carbon consumed by plant autotrophic respiration (Chapin et al., 2002). NPP therefore represents the efficiency of CO2 fixation by plants, deter-mines the amount of materials and energy available for heterotrophic organisms, and
20
represents the activity of vegetation in the global carbon cycle (Jenkins et al., 2001). Recent results from satellite remote sensing and carbon process models have sug-gested that NPP has increased in the middle and high northern latitudes since the 1980s (Myneni et al., 1997, 2001; Hicke et al., 2002; Fang et al., 2003; Nemani et al., 2003; Piao et al., 2005) and that this increase has been crucial for explaining the
in-25
BGD
8, 1463–1481, 2011Forest aboveground NPP in Japan
Y. Wang et al.
Title Page
Abstract Introduction
Conclusions References
Tables Figures
◭ ◮
◭ ◮
Back Close
Full Screen / Esc
Printer-friendly Version
Interactive Discussion
Discussion
P
a
per
|
Dis
cussion
P
a
per
|
Discussion
P
a
per
|
Discussio
n
P
a
per
|
1996; Brown and Schroeder, 1999; Kurz and Apps, 1999; Jenkins et al., 2001; Brown, 2002).
Biomass-based NPP estimation has been considered an effective method to assess NPP variations on a national scale (Whittaker and Marks, 1975; Fang et al., 1996; Jenkins et al., 2001; Brown, 2002). Whittaker and Marks (1975) detected a linear
rela-5
tionship between biomass and NPP for the first time, and Fang et al. (1996) developed this method by establishing several allometric biomass–NPP relationships for major forest types and using the allometries to estimate NPP for China’s forests. Jenkins et al. (2001), using plot-level forest inventory data, also reported a linear relationship between biomass and NPP for the mid-Atlantic region of the United States. A positive
10
biomass–NPP relationship is useful for estimating NPP because biomass can be eas-ily obtained from forest inventory data, which have become increasingly complete and available for many countries and regions in recent decades.
Japan has a typical marine climate with abundant rainfall, and two-thirds of its land area is covered with forest (Kira, 1991). Since the International Biological Program
15
(IBP, 1965 to 1974), biomass and NPP have been measured extensively for the main forest types in Japan (Fang et al., 2005). In addition, a systematic forest inventory has been conducted in Japan at about 5-yr intervals since 1947, and the surveys have intensified since the 1980s (Fang et al., 2005). These direct field measurements and systematic forest inventories make it possible to investigate the historical changes in
20
NPP for Japan’s forests.
In order to estimate changes in biomass in Japan’s forests over time, we reviewed the research literature on Japan’s forests and compiled a database for Japan’s forest biomass (Fang et al., 2005). Based on this database and forest inventory data, we investigated changes in the biomass of Japan’s forests from 1947 to 1995 in the
pre-25
BGD
8, 1463–1481, 2011Forest aboveground NPP in Japan
Y. Wang et al.
Title Page
Abstract Introduction
Conclusions References
Tables Figures
◭ ◮
◭ ◮
Back Close
Full Screen / Esc
Printer-friendly Version
Interactive Discussion
Discussion
P
a
per
|
Dis
cussion
P
a
per
|
Discussion
P
a
per
|
Discussio
n
P
a
per
|
2 Data and methods
We estimated the ANPP of Japan’s forests based on biomass–NPP relationships and data from forest inventories. Therefore, we used two datasets in this study: direct field measurements, including both biomass and NPP, and data from forest inventories.
2.1 Field measurement data
5
Since the IBP, studies of biomass and NPP have been conducted for Japan’s major forest types. Cannell (1982) compiled a global database of forest biomass and NPP, including some data from Japan. Fang et al. (2005) developed a database of Japan’s forest biomass that included 945 sets of data. We started with this database, then col-lected additional NPP data for Japan’s forests from all the available literature to
estab-10
lish a new database. This new database contains the forest type, stand age, stand den-sity, total basal area, stand volume, stem biomass, AB, belowground biomass, biomass of forest-floor vegetation, and 572 sets of NPP data. The NPP data generally included stem NPP (NPPS), branch NPP (NPPB), and leaf NPP (NPPL), and some of them also include root NPP (belowground NPP, BNPP), or total NPP (TNPP=ANPP+BNPP).
Un-15
fortunately, there was insufficient longer-term BNPP data for us to reconstruct BNPP changes during the study period. We defined ANPP as the sum of NPPS, NPPB, and NPPL. All the NPP data were estimated by means of destructive sampling and were defined as the difference in biomass and litterfall between two survey years divided by the number of years between measurements, thereby providing the net biomass
20
and litterfall change per year. In this study, we defined “biomass” as the standing crop (Mg ha−1).
2.2 Calculation of ANPP from other NPP components
Since some of the original sets did not provide ANPP data, and instead presented only data on NPPS, NPPL, or TNPP, we estimated the ANPP for each dataset using
allo-25
BGD
8, 1463–1481, 2011Forest aboveground NPP in Japan
Y. Wang et al.
Title Page
Abstract Introduction
Conclusions References
Tables Figures
◭ ◮
◭ ◮
Back Close
Full Screen / Esc
Printer-friendly Version
Interactive Discussion
Discussion
P
a
per
|
Dis
cussion
P
a
per
|
Discussion
P
a
per
|
Discussio
n
P
a
per
|
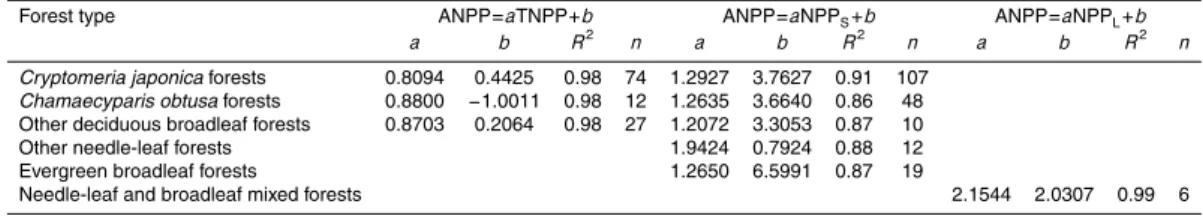
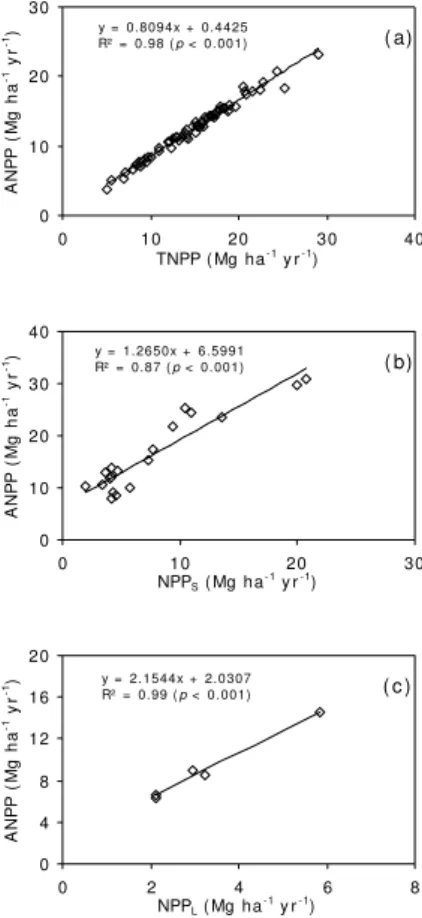
three allometric relationships to perform this analysis: (1) the TNPP–ANPP relation-ship, (2) the NPPS–ANPP relationship, and (3) the NPPL–ANPP relationship. Figure 1 shows typical examples of these relationships, and Table 1 lists the regression results for the sets of data that required this allometric approach. As shown in Table 1 and Fig. 1, strong and significant linear correlations were found between the NPP
compo-5
nents (TNPP, NPPS, or NPPL) and ANPP, suggesting that our approach is an accept-able way to obtain ANPP data from studies that presented only NPP components.
2.3 Relationship between biomass and ANPP
Biomass is generally considered to represent the accumulation of plant organic matter during a plant’s life cycle. During a forest’s growth stages, ANPP tends to increase
10
with increasing AB (Whittaker and Marks, 1975; Fang et al., 1996; Jenkins et al., 2001; Brown, 2002). Therefore, previous studies established the biomass–NPP relationship based on field measurements and used biomass to estimate the changes in NPP (Whit-taker and Marks, 1975; Fang et al., 1996; Jenkins et al., 2001). In the present study, we used our new database to establish a series of relationships between AB and ANPP
15
for Japan’s main forest types. To document the contribution of various forest types to Japan’s total ANPP, we classified the country’s forests into 10 major types:
Cryp-tomeria japonicaforests,Chamaecyparis obtusaforests,Pinusforests,Larix leptolepis
forests,Abiesand Piceaforests, other needle-leaf forests,Quercus forests, other de-ciduous broadleaf forests, evergreen broadleaf forests, and needle-leaf and broadleaf
20
mixed forests (For the details of the dominant species in each of the forest types, see Table S1). Figure 2 presents typical examples of the relationships between AB and ANPP, and Table 2 presents the regression results for all of these forest types. Table 2 and Fig. 2 both show strong and significant (p<0.05) relationships between AB and ANPP for most forest types, with the exception of evergreen broadleaf forests, other
25
BGD
8, 1463–1481, 2011Forest aboveground NPP in Japan
Y. Wang et al.
Title Page
Abstract Introduction
Conclusions References
Tables Figures
◭ ◮
◭ ◮
Back Close
Full Screen / Esc
Printer-friendly Version
Interactive Discussion
Discussion
P
a
per
|
Dis
cussion
P
a
per
|
Discussion
P
a
per
|
Discussio
n
P
a
per
|
2.4 Forest inventory dataset
Although Japan’s Forest Resources Statistics are available from 1947 to 2005, only those since 1980 are complete and report both the forest area and total timber vol-ume for each age class and each major forest type by prefecture (for the 47 prefec-tures in Japan). The data were compiled from 10 000 statistically representative,
ade-5
quately replicated, permanent sample plots across the country. The area of each plot is 1000 m2. In the present study, forest was defined as land with 20% or more crown cover of government-owned forests and more than 30% crown cover of community and privately owned forests. The data recorded included the forest group (planted and nat-ural forests), owner, dominant tree species, age class, diameter at breast height, tree
10
height, and stem volume. Biomass was estimated for each kind of forest from the tim-ber volume. For a detailed description of forest inventories in Japan and the methods of biomass estimation, see Fang et al. (2005).
3 Results
Because of limitations in the earlier data from Japan’s Forest Resources Statistics,
15
we have focused on the changes in ANPP of Japan’s forests only from 1980 to 2005. Table 3 summarizes the mean and total ANPP of Japan’s forests for this period. The mean ANPP for all forest types combined averaged 10.5 Mg ha−1yr−1during the 25 yr,
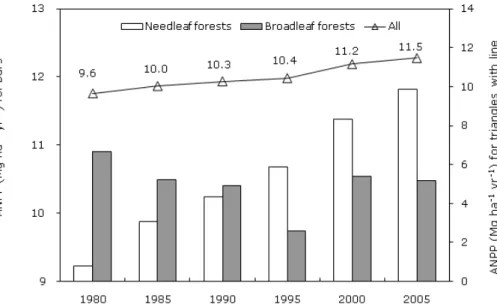
and ranged from 9.6 to 11.5 Mg ha−1yr−1 (Table 3, Fig. 3). From 1980 to 2005, the
mean ANPP increased markedly, by 1.9 Mg ha−1yr−1, with a mean annual increment
20
of 0.076 Mg ha−1yr−1(0.79%).
The mean ANPP of needle-leaf forests increased steadily throughout the study pe-riod (Fig. 3), with a mean annual increment of 0.10 Mg ha−1yr−1(1.12%), giving a total
increment increase of 2.6 Mg ha−1yr−1(Table 3). In addition, the mean ANPP of most
types of needle-leaf forest increased. The largest increase was forC. japonicaforests,
25
BGD
8, 1463–1481, 2011Forest aboveground NPP in Japan
Y. Wang et al.
Title Page
Abstract Introduction
Conclusions References
Tables Figures
◭ ◮
◭ ◮
Back Close
Full Screen / Esc
Printer-friendly Version
Interactive Discussion
Discussion
P
a
per
|
Dis
cussion
P
a
per
|
Discussion
P
a
per
|
Discussio
n
P
a
per
|
leptolepis forests, Abies and Picea forests, and C. obtusa forests, with increases of
3.3, 2.5, 1.5, and 0.8 Mg ha−1yr−1, respectively (Table 3). Because the AB–ANPP
re-lationship for other needle-leaf forests was not significant (Table 2), we used the mean value of the field data in Table 3. Therefore, it is difficult to determine the changes in mean ANPP of this forest type during the study period.
5
In contrast, the mean ANPP of broadleaf forests showed a more complex pattern of changes. ANPP declined from 10.9 Mg ha−1yr−1 in 1980 to 9.7 Mg ha−1yr−1 in
1995, then recovered to 10.5 Mg ha−1 yr−1 in 2000 and remained at this level
un-til 2005 (Table 3, Fig. 3). Overall, the mean ANPP of broadleaf forests decreased slightly (by 0.4 Mg ha−1yr−1) during the study period, with a mean annual decrement of
10
0.02 Mg ha−1yr−1(0.15%). Because the data for other broadleaf forests in Table 3
rep-resent the mean values for other deciduous broadleaf forests and evergreen broadleaf forests (Table 2), the changes in this forest type were not visible during the study pe-riod. Therefore, the majority of the change of mean ANPP of broadleaf forests resulted from changes in the mean ANPP ofQuercusforests.
15
The total ANPP of Japan’s forests (all types combined) averaged 249.1 Tg yr−1
dur-ing the study period, and ranged from 230.0 to 271.4 Tg yr−1 (Table 3).
Simultane-ously with the increase of mean ANPP, the total ANPP of Japan’s forests increased by 41.4 Tg yr−1 over the 25 yr, representing a mean annual increase of 1.66 Tg yr−1
(0.72%). However, in contrast with the trends for mean ANPP, the total ANPP of
needle-20
leaf forests decreased by 2.2 Tg yr−1from 1980 to 2005 (a mean annual rate of 0.06%),
whereas the total ANPP of broadleaf forests increased by 33.7 Tg yr−1(a mean annual
rate of 1.62%) during the same period (Table 3). For specific forest types, the total ANPP increased most for theC. japonica forests, followed by other broadleaf forests,
Quercusforests,C. obtusaforests, andL. leptolepisforests, which increased by 34.2,
25
21.0, 14.8, 7.2, and 1.5 Tg yr−1 over the 25 yr, respectively (Table 3). The reductions
in total ANPP were greatest forPinusforests, followed byAbiesandPiceaforests and by other needle-leaf forests, with decreases of 9.9, 8.2, and 3.4 Tg yr−1over the 25 yr,
BGD
8, 1463–1481, 2011Forest aboveground NPP in Japan
Y. Wang et al.
Title Page
Abstract Introduction
Conclusions References
Tables Figures
◭ ◮
◭ ◮
Back Close
Full Screen / Esc
Printer-friendly Version
Interactive Discussion
Discussion
P
a
per
|
Dis
cussion
P
a
per
|
Discussion
P
a
per
|
Discussio
n
P
a
per
|
4 Discussion
Our analysis revealed different patterns of change in the mean ANPP between needle-leaf and broadneedle-leaf forests (Fig. 3). This can be attributed to differences in the ratio of planted and natural forests for needle-leaf and broadleaf forests. In Japan, most of the planted forests are needle-leaf forests. Moreover, due to the economic benefits and the
5
pinewood nematode, a large area of natural needle-leaf deforeststion has developed in recent decades, increasing the ratio of planted to natural forests from 1.5:1 to 4.1:1 (Table S2). Compared to natural forests, the well-managed plantations exhibited rapid early growth, resulting in a significant ANPP increment in needle-leaf forests from 1980 to 2005. Conversely, more than 97% of the broadleaf forests were natural forests
10
(Table S2). The area of old natural forests with high biomass density has decreased rapidly, accompanied by a rapid increase in the area of young secondary forests with low biomass density, thereby decreasing the mean ANPP of broadleaf forests.
Interestingly, the directions of mean ANPP change for needle-leaf and broadleaf forests were the opposite of the directions for total ANPP. Because total ANPP was
15
estimated by combining mean ANPP with total forest area, the forest area likely played an important role in this difference. During the study period, the area of needle-leaf forests declined by 3.716×10⁶ ha (22.9%), whereas that of broadleaf forests increased by 3.516×10⁶ ha (46.0%) (Table 3).
To compare mean forest ANPP in Japan with values from elsewhere, we
sum-20
marized the mean forest ANPP for several key northern countries or regions in the Northern Hemisphere (Table 4). The overall mean ANPP of Japan’s forests averaged 10.5 Mg ha−1yr−1from 1980 to 2005, and those of broadleaf forest and needle-leaf
for-est were 10.4 and 10.5 Mg ha−1yr−1, respectively. The mean ANPP of Japan’s forests
was more than two times the mean TNPP of China’s forests (4.4 Mg ha−1yr−1; Fang et
25
BGD
8, 1463–1481, 2011Forest aboveground NPP in Japan
Y. Wang et al.
Title Page
Abstract Introduction
Conclusions References
Tables Figures
◭ ◮
◭ ◮
Back Close
Full Screen / Esc
Printer-friendly Version
Interactive Discussion
Discussion
P
a
per
|
Dis
cussion
P
a
per
|
Discussion
P
a
per
|
Discussio
n
P
a
per
|
8.7 to 9.7 Mg ha−1yr−1; Brown and Schroeder, 1999) and the mid-Atlantic region of the
United States (8.5 Mg ha−1yr−1; Jenkins et al., 2001). Europe had the lowest ANPP,
with a mean of only 3.2 Mg ha−1yr−1(ranging from 1.2 to 8.0 Mg ha−1yr−1; Karjalainen
et al., 2003). These results were consistent with those for the forest biomass carbon density of northern countries and regions reported by Fang et al. (2005). In their study,
5
Japan’s carbon sink was higher than that of other countries or regions, and this large carbon sink was mainly due to the rapid regrowth of plantations.
It is noteworthy that different to other countries or regions, in Japan the mean ANPP of needle-leaf forests was comparable with that of broadleaf forests. Compared to other countries or regions, the selection of fast-growing types of needle-leaf forests (such as
10
C. japonica) and the intensive forest management practiced in Japan are probably
responsible for the higher ANPP of the needle-leaf forests.
All the equations of NPP and biomass in this present study were established based on a review and analysis of field data on forest biomass and NPP (945 sets of biomass data and 572 sets of NPP data) from the five decades before 1995. All the NPP data
15
were estimated by means of destructive sampling, so the results can be expected to be accurate.
Kira (1976) calculated NPP using the following equation:
∆Pn= ∆Y+ ∆L+ ∆G , (1)
where∆Pnis NPP,∆Y is the net change in standing biomass per unit time (year), which
20
represents the amount of growth, ∆L is the loss due to tree mortality, and ∆G is the biomass loss due to herbivory. Because the herbivory loss is difficult to estimate, it was not included in our sets of NPP data. Based on the results of Kira (1976) and Clark et al. (2001), the loss of biomass due to the herbivory makes the underestimation the NPP of canopy trees by about 7%. Thus, the value of NPP based on the field data
25
used in our study was slightly underestimated.
BGD
8, 1463–1481, 2011Forest aboveground NPP in Japan
Y. Wang et al.
Title Page
Abstract Introduction
Conclusions References
Tables Figures
◭ ◮
◭ ◮
Back Close
Full Screen / Esc
Printer-friendly Version
Interactive Discussion
Discussion
P
a
per
|
Dis
cussion
P
a
per
|
Discussion
P
a
per
|
Discussio
n
P
a
per
|
the stand age and stand density (crown cover) varied greatly among the field data, the simulation results are not very satisfactory, even though the relationships between AB and ANPP were generally strong and statistically significant. For the other broadleaf forests and evergreen broadleaf forests, which included many species, we could not develop a single statistically significant equation for the relationship between AB and
5
ANPP, but instead had to use the mean values from the field data to estimate ANPP for these forest types. Given the above limitations, it should be possible to improve the precision of our estimates by (1) collecting more field data in these forests to increase the sample size, (2) using more suitable statistical equations that account for variations in stand age and density, and (3) dividing these forests into specific subtypes based on
10
their species composition or other factors when developing future AB–NPP equations. In summary, we used direct field measurements and forest inventory data to establish a new database of forest biomass and NPP in Japan, and we established allometric relationships between AB and NPP for Japan’s major forest types. Based on these allometric relationships and forest inventory data, we assessed the long-term changes
15
in ANPP for Japan’s forests from 1980 to 2005. The results indicate that the mean and total ANPP of Japan’s forests have increased markedly over the past 25 yr. Moreover, as was the case for Japan’s carbon sink size in previous research, the ANPP of Japan’s forests was higher than that of other countries or regions in the Northern Hemisphere. Afforestation based on planting of fast-growing trees and intensive forest management
20
were the major factors responsible for Japan’s higher ANPP.
Supplementary material related to this article is available online at: http://www.biogeosciences-discuss.net/8/1463/2011/
bgd-8-1463-2011-supplement.pdf.
Acknowledgements. This research was supported by the National Natural Science Foundation
25
BGD
8, 1463–1481, 2011Forest aboveground NPP in Japan
Y. Wang et al.
Title Page
Abstract Introduction
Conclusions References
Tables Figures
◭ ◮
◭ ◮
Back Close
Full Screen / Esc
Printer-friendly Version
Interactive Discussion
Discussion
P
a
per
|
Dis
cussion
P
a
per
|
Discussion
P
a
per
|
Discussio
n
P
a
per
|
References
Brown, S.: Measuring carbon in forests: current status and future challenges, Environ. Pollut., 116, 363–372, 2002.
Brown, S. and Schroeder, P. E.: Spatial patterns of aboveground production and mortality of woody biomass for Eastern US forests, Ecol. Appl., 9, 968–980, 1999.
5
Cannell, M. G. R. (Ed.): World Forest Biomass and Primary Production Data, Elsevier, New York, USA, 1982.
Chapin, F. S. III., Matson, P. A., and Mooney, H. A. (Eds.): Principles of Terrestrial Ecosystem Ecology, Springer-Verlag, New York, USA, 2002.
Clark, D. A., Brown, S., Kicklighter, D. W., Chambers, J. Q., Thomlinson, J. R., and Ni, J.:
10
Measuring net primary production in forests: concepts and field methods, Ecol. Appl., 11, 356–370, 2001.
Fang, J. Y., Liu, G. H., and Xu, S. L.: Biomass and net production of forest vegetation in China, Ac. Ecol. Sinica, 16, 497–508, 1996 (in Chinese with English abstract).
Fang, J. Y., Piao, S. L., Field, C. B., Pan, Y., Guo, Q., Zhou, L., Peng, C., and Tao, S.: Increasing
15
net primary production in China from 1982 to 1999, Front. Ecol. Environ., 1, 293–297, 2003. Fang, J. Y., Oikawa, T., Kato, T., Mo, W. H., and Wang, Z. H.: Biomass carbon
accumula-tion by Japan’s forests from 1947 to 1995, Global Biogeochem. Cy., 19(GB2004), 1–10, doi:10.1029/2004GB002253, 2005.
Hicke, J. A., Asner, G. P., Randerson, J. T., Tucker, C., Los, S., Birdsey, R. A., Jenkins, J. C.,
20
and Field, C.: Trends in North American net primary productivity derived from satellite obser-vations, 1982–1998, Global Biogeochem. Cy., 16(2), 2, 1–15 doi:10.1029/2001GB001550, 2002.
Jenkins, J. C., Birdsey, R. A., and Pan, Y.: Biomass and NPP estimation for the mid-Atlantic region (USA) using plot-level forest inventory data, Ecol. Appl., 11, 1174–1193, 2001
25
Karjalainen, T., Pussinen, A., Liski, J., Nabuurs, G. J., Eggers, T., Lapvetel ¨ainen, T., and Kaipainen, T.: Scenario analysis of the impacts of forest management and climate change on the European forest sector carbon budget, Forest Policy Econ., 5, 141–155, 2003. Kira, T. (Ed.): Terrestrial Ecosystems: An Introduction, Kyoritsu Publications, Tokyo, Japan,
1976 (in Japanese).
30
BGD
8, 1463–1481, 2011Forest aboveground NPP in Japan
Y. Wang et al.
Title Page
Abstract Introduction
Conclusions References
Tables Figures
◭ ◮
◭ ◮
Back Close
Full Screen / Esc
Printer-friendly Version
Interactive Discussion
Discussion
P
a
per
|
Dis
cussion
P
a
per
|
Discussion
P
a
per
|
Discussio
n
P
a
per
|
Kira, T. and Shidei, T.: Primary production and turnover of organic matter in different forest ecosystems of the Western Pacific, Jpn. J. Ecol., 17, 70–87, 1967.
Kurz, W. A. and Apps, M. J.: A 70-year retrospective analysis of carbon fluxes in the Canadian forest sector, Ecol. Appl., 9, 526–547, 1999.
Myneni, R. B., Keeling, C. D., Tucker, C. J., Asrar, G., and Nemani, R. R.: Increased plant
5
growth in the northern high latitudes from 1981–1991, Nature, 386, 698–702, 1997.
Myneni, R. B., Dong, J., Tucker, C. J., Kaufmann, R. K., Kauppi, P. E., Liski, J., Zhou, L., Alexeyev, V., and Hughes, M. K.: A large carbon sink in the woody biomass of northern forests, Proc. Natl. Acad. Sci., 98, 14784–14789, 2001.
Nemani, R. R., Keeling, C. D., Hashimoto, H., Jolly, W. M., Piper, S. C., Tucker, C. J.,
My-10
neni, R. B., and Running, S. W.: Climate-driven increases in global terrestrial net primary production from 1982 to 1999, Science, 300, 1560–1563, 2003.
Piao, S. L., Fang, J. Y., Zhou, L. M., Zhu, B., Tan, K., and Tao, S.: Changes in vegetation net primary productivity from 1982 to 1999 in China, Global Biogeochem. Cy., 19, GB2027, doi:10.1029/2004GB002274, 2005.
15
Turner, D. P., Koerper, D. J., Harmon, M. E., and Lee, J. J.: A carbon budget for forests of the conterminous United States, Ecol. Appl., 5, 421–436, 1999.
Whittaker, R. H. and Marks, P. L.: Methods of assessing terrestrial productivity, in: Primary Productivity of the Biosphere, edited by: Lieth, H. and Whittaker, R. H., Springer-Verlag, New York, USA, 55–118, 1975.
BGD
8, 1463–1481, 2011Forest aboveground NPP in Japan
Y. Wang et al.
Title Page
Abstract Introduction
Conclusions References
Tables Figures
◭ ◮
◭ ◮
Back Close
Full Screen / Esc
Printer-friendly Version
Interactive Discussion
Discussion
P
a
per
|
Dis
cussion
P
a
per
|
Discussion
P
a
per
|
Discussio
n
P
a
per
|
Table 1. Regression parameters for the relationships between aboveground net primary
pro-duction (ANPP) and total NPP (TNPP), stem NPP (NPPS), and leaf NPP (NPPL) for Japan’s major forest types, whereaandbare the regression constants for each forest type. The units of all NPP components are Mg ha−1
yr−1
. All regressions were statistically significant (p<0.001).
Forest type ANPP=aTNPP+b ANPP=aNPPS+b ANPP=aNPPL+b
a b R2 n a b R2 n a b R2 n
Cryptomeria japonicaforests 0.8094 0.4425 0.98 74 1.2927 3.7627 0.91 107
Chamaecyparis obtusaforests 0.8800 −1.0011 0.98 12 1.2635 3.6640 0.86 48
Other deciduous broadleaf forests 0.8703 0.2064 0.98 27 1.2072 3.3053 0.87 10 Other needle-leaf forests 1.9424 0.7924 0.88 12 Evergreen broadleaf forests 1.2650 6.5991 0.87 19
BGD
8, 1463–1481, 2011Forest aboveground NPP in Japan
Y. Wang et al.
Title Page
Abstract Introduction
Conclusions References
Tables Figures
◭ ◮
◭ ◮
Back Close
Full Screen / Esc
Printer-friendly Version
Interactive Discussion
Discussion
P
a
per
|
Dis
cussion
P
a
per
|
Discussion
P
a
per
|
Discussio
n
P
a
per
|
Table 2. Relationships between aboveground biomass (AB,x) and aboveground net primary
production (ANPP,y) for the major forest types in Japan.
Forest type AB (Mg ha−1) ANPP (Mg ha−1yr−1) AB–ANPP relationship
Range Mean SD Range Mean SD Equation n R2 p Cryptomeria japonicaforests 10.5 to 371.0 136.8 75.9 0.7 to 36.3 14.3 5.2 1/y=6.5856/x+0.0144 172 0.48 <0.001
Chamaecyparis obtusaforests 25.3 to 308.2 161.3 69.0 4.9 to 20.6 12.4 3.6 y=0.0152x+9.9770 85 0.08 0.007
Pinusforests 24.7 to 222.1 96.5 51.4 5.6 to 20.3 11.8 3.8 1/y=2.5151/x+0.0582 26 0.56 <0.001
Larix leptolepisforests 13.3 to 210.3 88.6 60.0 5.6 to 17.1 12.2 3.2 y=0.0416x+8.5101 26 0.61 <0.001
AbiesandPiceaforests 12.6 to 378.7 176.2 91.1 1.2 to 21.7 10.7 4.7 y=0.038x+3.9452 44 0.55 <0.001 Other needle-leaf forests 13.6 to 396.4 119.2 89.1 3.3 to 18.1 10.2 4.4 Mean=10.2 16
Quercusforests 27.4 to 265.0 117.0 69.5 4.7 to 23.6 11.8 4.9 y=0.0489x+6.1131 26 0.48 <0.001 Other deciduous broadleaf forests 18.4 to 787.4 250.7 151.4 2.8 to 34.0 10.2 5.5 y=0.0184x+5.5736 101 0.26 <0.001 Evergreen broadleaf forests 19.5 to 377.6 99.8 87.9 7.8 to 30.8 15.4 5.4 Mean=15.4 67
Needle-leaf and broadleaf mixed forests 86.1 to 559.7 308.5 203.4 6.4 to 16.2 9.4 3.6 Mean=9.4 9
BGD
8, 1463–1481, 2011Forest aboveground NPP in Japan
Y. Wang et al.
Title Page
Abstract Introduction
Conclusions References
Tables Figures
◭ ◮
◭ ◮
Back Close
Full Screen / Esc
Printer-friendly Version
Interactive Discussion
Discussion
P
a
per
|
Dis
cussion
P
a
per
|
Discussion
P
a
per
|
Discussio
n
P
a
per
|
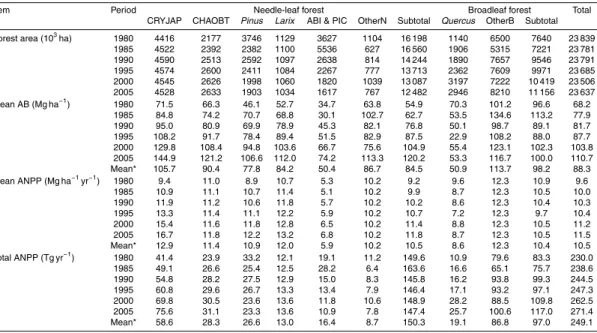
Table 3. Forest area, mean aboveground biomass (AB), mean aboveground net primary
pro-duction (ANPP), and total ANPP for Japan’s major forest types from 1980 to 2005. CRYJAP,
C. japonica; CHAOBT, C. obtusa; Larix, L. leptolepis; ABI & PIC,Abies and Picea; OtherN, Other needle-leaf forests; OtherB, Other deciduous broadleaf forests and Evergreen broadleaf forests
Item Period Needle-leaf forest Broadleaf forest Total
CRYJAP CHAOBT Pinus Larix ABI & PIC OtherN Subtotal Quercus OtherB Subtotal Forest area (103ha) 1980 4416 2177 3746 1129 3627 1104 16 198 1140 6500 7640 23 839
1985 4522 2392 2382 1100 5536 627 16 560 1906 5315 7221 23 781 1990 4590 2513 2592 1097 2638 814 14 244 1890 7657 9546 23 791 1995 4574 2600 2411 1084 2267 777 13 713 2362 7609 9971 23 685 2000 4545 2626 1998 1060 1820 1039 13 087 3197 7222 10 419 23 506 2005 4528 2633 1903 1034 1617 767 12 482 2946 8210 11 156 23 637 Mean AB (Mg ha−1) 1980 71.5 66.3 46.1 52.7 34.7 63.8 54.9 70.3 101.2 96.6 68.2
1985 84.8 74.2 70.7 68.8 30.1 102.7 62.7 53.5 134.6 113.2 77.9 1990 95.0 80.9 69.9 78.9 45.3 82.1 76.8 50.1 98.7 89.1 81.7 1995 108.2 91.7 78.4 89.4 51.5 82.9 87.5 22.9 108.2 88.0 87.7 2000 129.8 108.4 94.8 103.6 66.7 75.6 104.9 55.4 123.1 102.3 103.8 2005 144.9 121.2 106.6 112.0 74.2 113.3 120.2 53.3 116.7 100.0 110.7 Mean* 105.7 90.4 77.8 84.2 50.4 86.7 84.5 50.9 113.7 98.2 88.3 Mean ANPP (Mg ha−1
yr−1
) 1980 9.4 11.0 8.9 10.7 5.3 10.2 9.2 9.6 12.3 10.9 9.6 1985 10.9 11.1 10.7 11.4 5.1 10.2 9.9 8.7 12.3 10.5 10.0 1990 11.9 11.2 10.6 11.8 5.7 10.2 10.2 8.6 12.3 10.4 10.3 1995 13.3 11.4 11.1 12.2 5.9 10.2 10.7 7.2 12.3 9.7 10.4 2000 15.4 11.6 11.8 12.8 6.5 10.2 11.4 8.8 12.3 10.5 11.2 2005 16.7 11.8 12.2 13.2 6.8 10.2 11.8 8.7 12.3 10.5 11.5 Mean* 12.9 11.4 10.9 12.0 5.9 10.2 10.5 8.6 12.3 10.4 10.5 Total ANPP (Tg yr−1
) 1980 41.4 23.9 33.2 12.1 19.1 11.2 149.6 10.9 79.6 83.3 230.0 1985 49.1 26.6 25.4 12.5 28.2 6.4 163.6 16.6 65.1 75.7 238.6 1990 54.8 28.2 27.5 12.9 15.0 8.3 145.8 16.2 93.8 99.3 244.5 1995 60.8 29.6 26.7 13.3 13.4 7.9 146.4 17.1 93.2 97.1 247.3 2000 69.8 30.5 23.6 13.6 11.8 10.6 148.9 28.2 88.5 109.8 262.5 2005 75.6 31.1 23.3 13.6 10.9 7.8 147.4 25.7 100.6 117.0 271.4 Mean* 58.6 28.3 26.6 13.0 16.4 8.7 150.3 19.1 86.8 97.0 249.1
BGD
8, 1463–1481, 2011Forest aboveground NPP in Japan
Y. Wang et al.
Title Page
Abstract Introduction
Conclusions References
Tables Figures
◭ ◮
◭ ◮
Back Close
Full Screen / Esc
Printer-friendly Version
Interactive Discussion
Discussion
P
a
per
|
Dis
cussion
P
a
per
|
Discussion
P
a
per
|
Discussio
n
P
a
per
|
Table 4. Estimates of mean aboveground net primary production (ANPP) for Japan’s forests
and those of other northern countries or regions.
Country or region Period Forest type Mean ANPP Reference (Mg ha−1yr−1)
Japan 1980 to 2005 All 10.5 This study
Broadleaf 10.4 This study Needle-leaf 10.5 This study China 1984 to 1988 All 4.4* Fang et al. (1996) United States (Mid-Atlantic region) All 8.5 Jenkins et al. (2001)
Broadleaf 8.6 Jenkins et al. (2001) Needle-leaf 7.9 Jenkins et al. (2001) United States (eastern region) 1980 s to 1990 s Broadleaf 9.7 Brown and Schroeder (1999)
Needle-leaf 8.7 Brown and Schroeder (1999) Europe 1995 to 2000 All 3.2 (1.2 to 8.0) Karjalainen et al. (2003)
BGD
8, 1463–1481, 2011Forest aboveground NPP in Japan
Y. Wang et al.
Title Page Abstract Introduction Conclusions References Tables Figures ◭ ◮ ◭ ◮ Back Close
Full Screen / Esc
Printer-friendly Version Interactive Discussion Discussion P a per | Dis cussion P a per | Discussion P a per | Discussio n P a per | ( a) y = 0.8094x + 0.4425
R2 = 0.98
0 10 20 30
0 10 20 30 40
TNPP ( Mg ha-1 y r- 1)
A N P P ( M g h a
-1 y
r
-1)
( b) y = 1.265x + 6.5991
R2 = 0.87
0 10 20 30 40
0 10 20 30
NPPS ( Mg ha - 1
y r-1 ) A N P P ( M g h a
-1 y
r
-1)
( c ) y = 2.1544x + 2.0307
R2 = 0.99
0 4 8 12 16 20
0 2 4 6 8
NPPL ( Mg ha -1
y r- 1 ) A N P P ( M g h a
-1 y
r
-1)
y = 0.8094x + 0.4425 R² = 0.98 (p < 0.001)
y = 1.2650x + 6.5991 R² = 0.87 (p < 0.001)
y = 2.1544x + 2.0307 R² = 0.99 (p < 0.001)
Fig. 1.Examples of the relationships between the components of net primary production (NPP)
and aboveground net primary production (ANPP).(a) The relationship between total net pri-mary production (TNPP) and ANPP forC. japonicaforests.(b)The relationship between stem net primary production (NPPS) and ANPP for evergreen broadleaf forests.(c)The relationship between leaf net primary production (NPPL) and ANPP for needle-leaf and broadleaf mixed forests. The relationships between these NPP components and ANPP for other forest types are shown in Table 1.
BGD
8, 1463–1481, 2011Forest aboveground NPP in Japan
Y. Wang et al.
Title Page
Abstract Introduction
Conclusions References
Tables Figures
◭ ◮
◭ ◮
Back Close
Full Screen / Esc
Printer-friendly Version
Interactive Discussion
Discussion
P
a
per
|
Dis
cussion
P
a
per
|
Discussion
P
a
per
|
Discussio
n
P
a
per
|
Fig. 2.Examples of the relationships between aboveground biomass (AB, Mg ha−1) and
BGD
8, 1463–1481, 2011Forest aboveground NPP in Japan
Y. Wang et al.
Title Page
Abstract Introduction
Conclusions References
Tables Figures
◭ ◮
◭ ◮
Back Close
Full Screen / Esc
Printer-friendly Version
Interactive Discussion
Discussion
P
a
per
|
Dis
cussion
P
a
per
|
Discussion
P
a
per
|
Discussio
n
P
a
per
|
Fig. 3. Changes in mean aboveground net primary production (ANPP) of Japan’s forests from
1980 to 2005.