An Acad Bras Cienc (2017) 89 (2)
Anais da Academia Brasileira de Ciências (2017) 89(2): 973-989 (Annals of the Brazilian Academy of Sciences)
Printed version ISSN 0001-3765 / Online version ISSN 1678-2690 http://dx.doi.org/10.1590/0001-3765201720160357
www.scielo.br/aabc
Global patterns of aboveground carbon stock and sequestration in mangroves
GUSTAVO C.D. ESTRADA and MÁRIO L.G. SOARES
Universidade do Estado do Rio de Janeiro, Faculdade de Oceanografia, Departamento de Oceanografia Biológica, Núcleo de
Estudos em Manguezais, Rua São Francisco Xavier, 524, 4023-E, 20550-013 Rio de Janeiro, RJ, Brazil
Manuscript received on June 9, 2016; accepted for publication on November 11, 2016
ABSTRACT
In order to contribute to understand the factors that control the provisioning of the ecosystem service of carbon storage by mangroves, data on carbon stock and sequestration in the aboveground biomass (AGB) from 73 articles were averaged and tested for the dependence on latitude, climatic parameters, physiographic types and age. Global means of carbon stock (78.0 ± 64.5 tC.ha-1) and sequestration (2.9 ± 2.2 tC.ha-1
.yr-1
) showed that mangroves are among the forest ecosystems with greater capacity of carbon storage in AGB per area. On the global scale, carbon stock increases toward the equator (R²=0.22) and is dependent on 13 climatic parameters, which can be integrated in the following predictive equation: Carbon Stock in AGB = -16.342 + (8.341 x Isothermality) + (0.021 x Annual Precipitation) [R²=0.34; p < 0.05]. It was shown that almost 70% of carbon stock variability is explained by age. Carbon stock and sequestration also vary according to physiographic types, indicating the importance of hydroperiod and edaphic parameters to the local variability of carbon stock. By demonstrating the contribution of local and regional-global factors to carbon stock, this study provides information to the forecast of the effects of future climate changes and local anthropogenic forcings on this ecosystem service.
Key words: biomass, carbon, ecosystem services, mangrove, regression analysis, WorldClim.
Correspondence to: Gustavo Calderucio Duque Estrada
E-mail: [email protected]
INTRODUCTION
Mangroves are coastal forest ecosystems occurring in unconsolidated substrata in sheltered intertidal zones of tropical, subtropical and warm temperate regions of the planet. They are globally recognized for being highly important in terms of ecological, economic, social and cultural functions due to the variety of goods and services they provide, reaching an estimated annual economic value of more than US$ 900 000/km² (UNEP-WCMC 2006). The
included as part of the estimate) to anthropogenic greenhouse gas emission (17%, or 1.5 Pg C.year-1 - Van der Werf et al. 2009), and, on the other hand, to the economic feasibility of mangrove conservation by maintaining carbon storage (Siikamäki et al. 2012).
Given the importance that this function may have to justify mangrove conservation, it becomes necessary to direct efforts to quantify the fluxes and pools of carbon in the different compartments of the ecosystem as well as to understand the factors that control them. In the last 20 years, some reviews have been published addressing the storage and flux of carbon or organic matter in mangrove ecosystems (Twilley et al. 1992, Saenger and Snedaker 1993, Chmura et al. 2003, Bouillon et al. 2008, Komiyama et al. 2008, Kristensen et al. 2008, Adame and Lovelock 2011, Alongi 2014, Hutchison et al. 2014), which sought to synthesize the results of numerous previously published articles on the subject. Although some of these reviews present surveys of aboveground biomass, none have addressed the factors that influence the aboveground biomass (or carbon stock in this compartment) and the rate of aboveground biomass increment (or carbon sequestration in this compartment), except for Hutchison et al. (2014) on the role of climate variables.
Based on an extensive review and meta-analysis of data on carbon stock and sequestration in the aboveground biomass of mangroves, we: 1) tested the existence of global patterns of carbon stock and sequestration variability in mangroves in relation to climatic factors, physiographic types and age; 2) estimated global averages of aboveground carbon stock and sequestration; and 3) analyzed the aspects of methodology and geographic distribution of the existing studies in order to identify the limitations and gaps that future studies should seek to minimize.
MATERIALS AND METHODS
LITERATURE REVIEW
The literature review was based only on published articles. Theses, dissertations, research reports and manuscripts published in conference proceedings were not considered. Searches were conducted using the keywords (in English only) “carbon”, “stock”, “sequestration”, “biomass”, “biomass increment”, “growth” and “productivity” together with the word “mangrove”. The following databases were consulted: Google Scholar, Web of Science, SciELO and JStor.
DATA SELECTION AND TREATMENT
All data presented in each article were included in the review. When presented only in graphs, data extraction was performed using PlotDigitalizer version 2.5.1. In cases where data were not presented by sampling unit (e.g., plot), the averages presented were extracted. When necessary, the data collected were converted to the units adopted in this study: tC.ha-1 (Carbon Stocks) and tC.ha-1.year -1
(Rate of Carbon Sequestration). In the case of articles that reported only biomass and the rate of biomass increment, these values were transformed into stock and sequestration by applying a carbon content of 0.45 gC.g-1 of dry matter, as suggested by Twilley et al. (1992). The following information were also extracted from each article: study location and geographic coordinates, the age of the forests and information allowing forests to be classified in terms of physiographic type and successional stage or age.
An Acad Bras Cienc (2017) 89 (2)
CARBON STOCK AND SEQUESTRATION IN MANGROVES 975
mangrove species, such as hypersalinity (Lovelock
and Feller 2003), oligotrophy (Lovelock et al.
2004), high H2S concentration (Lee et al. 2008)
or low temperatures (Suwa and Hagihara 2008). For this classification, we sought in the compiled articles information that allowed the classification of the forests into physiographic types, such
as relative distance from the continent and the
adjacent water body, topographic level and tidal flooding frequency. In the case of shrub forests, information about the architecture of the trees was
also considered.
Climatic data were collected from the
WorldClim database (http://www.worldclim.org/),
whose detailed description is presented in Hijmans
et al. (2005). Of the 19 parameters available from
WorldClim, 13 were selected in the present study, which were considered to potentially influence the biomass and productivity of mangroves, namely:
BIO1: Annual Mean Temperature; BIO2: Mean Diurnal Range [Mean of monthly (max temp - min temp)]; BIO3: Isothermality [(BIO2/BIO7)*100];
BIO6: Minimum Temperature of Coldest Month;
BIO7: Temperature Annual Range (maximum
temperature of warmest month - BIO6); BIO11: Mean Temperature of Coldest Quarter; BIO12: Mean Annual Precipitation; BIO13: Mean Precipitation
of Wettest Month; BIO14: Mean Precipitation of Driest Month; BIO16: Precipitation of Wettest Quarter; BIO17: Precipitation of Driest Quarter; and BIO19: Precipitation of Coldest Quarter. In addition to the WorldClim parameters, mean annual
potential evapotranspiration (PET) was also used.
This data layer was obtained from the Consultative Group for International Agriculture Research -
Consortium for Spatial Information (CGIAR-CSI).
From PET, water balance was calculated as: Water
Balance = BIO12 - PET.
DATA ANALYSIS
Simple regression analysis was used to test the dependence of carbon stock and sequestration on latitude, climate parameters and age (when it was explicitly presented in the study). Logarithmic, exponential and power functions were also tested, but preliminary results showed that none of them presented higher R² than the linear regressions. Using the independent variables that resulted in the best fitted simple regression equations, an integrative multiple regression equation was also obtained. Regression analyses were calculated using the averages of stock and sequestration calculated per article or study area (in the case of articles that present data to more than one location). This procedure was used to prevent that the number of values per article and site could have caused biased statistical analysis. Following a similar procedure of Saenger and Snedaker (1993), carbon stock was also regressed in relation to the Latitude/ Canopy Height ratio. This regression was ran from the average canopy height per article or study area.
In addition to regression analysis, means by latitudinal range (0-10°, 10-25° and >25°) were compared using analysis of variance (ANOVA) followed by Tukey’s post-hoc test. The same procedure was followed to test the differences among physiographic types (fringe, basin and shrub). All statistical tests used a significance level of 5% and followed the procedures suggested by Zar (1996).
2010). In this case, both procedures (including and excluding plantations and managed forests) were performed and compared. For the analyses related to latitude, climatic parameters and physiographic types, data from pioneer forests and forests at early stage of regeneration were also excluded because they are expected to respond more directly to their age than to environmental parameters.
RESULTS AND DISCUSSION
We surveyed 73 scientific articles (Appendix 1S - Supplementary Material), 69 of which present data on aboveground biomass (n = 54) or carbon stock in aboveground biomass (n = 15) and 26 on biomass increment (n = 19) or carbon sequestration (n = 7). From the 73 studies, a total of 316 values of biomass or carbon stock and 101 of rates of biomass increment or carbon sequestration were extracted. As explained earlier, data presented as biomass or rate of biomass increment were converted to carbon stock and sequestration, respectively, and will be called this way from now on in the present study. The locations of the sample areas of the compiled articles are presented in Figure 1 and in Appendix 1S. The number of studies on carbon stock by country (71) was higher than the total number of compiled articles (69) because Donato et al. (2011) present data from three countries (Bangladesh, Indonesia and Micronesia).
LIMITATION OF EXISTING DATA
The analysis of the locations of the sample areas reveals a high concentration of studies in the Indo-West Pacific (IWP) Biogeographic Region for both carbon stock (54/71) and sequestration (18/26). This concentration in the IWP is primarily due to the high percentage of studies in the Indo-Malaysian Sub-Region (stock: 33/71; sequestration: 15/26) and Australia, which is the country with the greatest contribution of studies on carbon stock (10/71). Noteworthy are the lack of articles on carbon stock
and sequestration in the West Africa sub-region and the low percentage of studies in the sub-regions of West America (Stock: 2/71; Sequestration: no study) and East Africa (Stock: 6/71; Sequestration: 1/26). In addition, there are few studies in Brazil (Stock: 2; Sequestration: 1), in spite of presenting the second largest mangrove area in the world (13,000 km2; Spalding et al. 2010).
The number of sampling units (plots or quadrants) used in the compiled studies is quite variable and primarily reflects the sampling effort and the distinct goals. Of the 73 articles, 48% use 1-10 sample units, and 42% use 11 or more units, with emphasis on the studies of Estrada et al. (2015), Imbert and Rollet (1989) and Donato et al. (2011), using 94, 82, and 150 plots, respectively. The remaining articles (10%) do not present the number of sample units used. The high percentage of studies that have a low sample number (1 to 10: 48%) contribute to the even greater percentage (59%) of studies that do not show any pattern of spatial variation. Studies that show spatial variation patterns in carbon stock or sequestration (41%) demonstrated dependence on gradients of tidal flooding frequency (30%) or on the position of the forest in relation to the upper and lower points of the estuary (9%).
An Acad Bras Cienc (2017) 89 (2)
CARBON STOCK AND SEQUESTRATION IN MANGROVES 977
temporal variability of carbon sequestration in the aboveground biomass of mangrove forests.
GLOBAL AVERAGES OF CARBON STOCK AND SEQUESTRATION
Global averages were calculated for aboveground carbon stock and carbon sequestration in mangroves and are presented in Table I. When the global averages produced in the present study were compared with those presented in other reviews on this topic (Table I), it was found that although there are no major differences in the averages and standard deviations, with only a few exceptions, the number of publications and values compiled in the present study is considerably greater than that used by previous reviews, even if we consider only the most recent reviews. Based on this compilation, the present study shows that the maximum carbon stock found in mangrove forests is higher than shown in the previous reviews (Table I; Appendix 1S). With regard to carbon sequestration, although
the maximum and minimum values are similar in all reviews, the more detailed assessment conducted in the present study shows that the average is lower than those suggested by Twilley et al. (1992) and Bouillon et al. (2008).
Carbon stock in the mangroves aboveground biomass is similar to the averages for tropical and sub-tropical forests (30°N to 40°S) in Latin America and Asia/Oceania recently presented by Saatchi et al. (2011): 73.2 and 90.7 tC.ha-1 for Latin America and Asia/Oceania, respectively. However, the estimates presented by Saatchi et al. (2011) were made from a different methodology (using Lidar imagery to estimate height and height-allometries to estimate aboveground biomass) and represent an average of different forest ecosystems, including savannas and tropical rain forests in the same average.
In IPCC (2003) and IPCC (2006), averages are presented per forest ecosystem for tropical, sub-tropical, temperate and boreal regions, based on Figure 1 - Map (Aitoff projection) of the geographical distribution of the compiled articles (black circles) by Biogeographical Region and Sub-Region (according to Duke 1992).
a broad bibliographic survey. Figure 2(a) shows that carbon stock of mangrove forests is similar to tropical moist deciduous and temperate oceanic forests, both with 81 tC.ha-1, lower than in tropical rain forests (135 tC.ha-1) and in subtropical humid forests (99 tC.ha-1) and higher than in tropical and subtropical dry forests (both 59 tC.ha-1) and other types of forest ecosystems. Although the lower carbon stock in mangrove forests in comparison to tropical rain forests and subtropical humid forests are expected, to some extent, on the basis of potentially more limiting soil characteristics (e.g., high salinity and concentration of hydrogen sulfide in the interstitial water), we must consider that this comparison also has a limitation, as it includes data from mangrove forests from a broad latitudinal range (26°N to 37°S), whereas the other forest ecosystems are separated by latitudinal/climatic range.
Figure 2(b) shows that the mangrove carbon stock means by latitudinal range (tropical 1 = 0 to 10°, tropical 2 = 10 to 25° and subtropical > 25°) are significantly different (F = 10.7; p < 0.01), with the p-value of the Tukey’s t test < 0.05 in all cases (see section 3.2). The mangrove forests
located between 0° and 10° latitude average 103.7 tC.ha-1 and are positioned behind only the tropical rain forests in terms of carbon stock. This position is consistent with the high solar radiation and air temperature to which these forests are exposed due to their low latitude location but also because they are within the range of influence of the Intertropical Convergence Zone, which generates high rainfall input; in addition, in several cases, these low-latitude mangrove forests are under the influence of large rivers that supply huge amounts of water and nutrients (e.g., the Amazon, Orinoco and Congo rivers). However, carbon stock in mangroves occurring between 0 and 10° latitude is approximately 25% lower than that of tropical rain forests. Assuming the stress caused by salinity and the H2S concentration in the substrate may explain this difference, the absence of an understory, or at least a well-developed understory in mangroves (Snedaker and Lahman 1988) probably plays a key role in this difference, as the understory accounts for approximately 10% of the aboveground biomass in tropical rain forests (Nascimento and Laurance 2004). It is also observed (in Figure 2b) that mean carbon stock of temperate and subtropical mangrove TABLE I
Global estimates of carbon stock and sequestration in the aboveground biomass of mangroves found in the literature and number of references and values compiled by each study.
Reference Mean ± SD Max Min References (Values)
Carbon Stock (tC.ha-1
)
This Study 78.0 ± 64.5 418.5 0.9 69 (316)
Twilley et al. (1992) 80.1 ± 50.5 129.1 28.3 8 (11)
Saenger and Snedaker (1993)a
62.8 ± 46.9b
196.4 3.1 17 (43)
Komiyama et al. (2008)a
78.3 ± 51.0b
207.0 3.6 23 (54)
Hucthison et al. (2014)a
74.5 ± 54.6 - - 52 (102)
Carbon Sequestration (tC.ha-1
.yr-1
)
This Study 2.9 ± 2.2 9.7 0.4 26 (101)
Twilley et al. (1992) 5.4 ± 2.6b
10.9 1.4 7 (9)
Bouillon et al. (2008)a
4.5 ± 2.5 10.9 0.5 15 (31)
Komiyama et al. (2008)a
2.9 ± 2.6b
9.0 0.4 6 (12)
An
Acad Bras Cienc
(2017)
89
(2)
CARBON
ST
OCK
AND
SEQUESTRA
TION
IN
MANGROVES
979
Figure 2 - Mean values of (a,b) carbon stock, (c) carbon sequestration, and (d) turnover time of the aboveground biomass of terrestrial forest ecosystems (grey bars) and mangroves (black bars). Means of aboveground biomass of terrestrial forest ecosystems were taken from IPCC (2003) and IPCC (2006) and converted to carbon considering the same carbon content used in the present study (0.45 gC.g-1
forests is similar to tropical shrublands (43.4 and 31.5 tC.ha-1, respectively). This similarity in carbon stock is most likely determined by the similarity in terms of architecture, as mangrove forests that are located near their latitudinal limits usually have a shrubby architecture in response to the increased environmental stress imposed by low temperatures (Bridgewater and Cresswell 1999, Stevens et al. 2006, Soares et al. 2012). Mangrove forests that occur between 10 and 25° have a slightly lower mean stock (75.5 tC.ha-1) compared with mangroves in general (78.0 tC.ha-1), occupying the same position (5th) in relation to terrestrial forests.
The same comparison is presented for carbon sequestration in the aboveground biomass (Figure 2c). Unlike the approach used for carbon stock, only the overall mean was considered, including data from all latitudes, as the tests did not indicate the existence of a relationship with latitude, which will be discussed further in section 3.2. The average obtained in the present study for mangrove forests (2.9 tC.ha-1.year-1) is the second highest among forest ecosystems, slightly lower than in tropical rain forests (3.2 tC.ha-1.year-1) and higher than those of tropical moist deciduous forests and subtropical humid forests (both with 2.3 tC.ha-1.year-1). This result thus confirms that mangroves are one of the most productive forest ecosystems in terms of carbon increment in the aboveground biomass (Day Jr. et al. 1987, Komiyama et al. 2008).
The fact that mangroves have the second highest rate of carbon sequestration in aboveground biomass (2.9 tC.ha-1.yr-1) but only the fifth highest carbon stock (78.0 tC.ha-1) among forest ecosystems is intriguing and indicates an elevated turnover rate of biomass in mangroves. Using the ratio of mean biomass/ mean rate of biomass increment, Figure 2(d) shows that mangrove forests have the lowest turnover time (27 years) of aboveground biomass among the forest ecosystems, while tropical rain forests and tropical moist deciduous forests present renewal times of 43 and 36 years,
respectively. The fast turnover rate of aboveground biomass corroborates the high resilience described for mangroves (Vogt et al. 2012), which is, in the view of Alongi (2008), the result of an interaction among factors such as: high nutrient reserves in the substrate; high rates of nutrient flow and microbial decomposition; and the redundancy of key species, although disturbance regimes may also play a role (Duke 2002).
LATITUDE AND CLIMATE PARAMETERS
After excluding data from plantations, managed forests, pioneer forests and forests at early stage of regeneration, regression analyses between carbon stock and latitude or climatic parameters (Figure 3a-l) were ran with n = 59. All the regressions were significant, except for the mean diurnal range (Table II). The R² of the significant regressions ranged from 0.11 to 0.28, and these low values indicate the influence of other factors that vary regionally and locally, such as the frequency of tidal flooding, the availability of nutrients and the continental water input. However, despite the low coefficients of determination, the significance of the regressions and the graphical analysis of the dispersions (Figure 3a-l), especially those for which the R² was greater than 0.20, confirm the existence
of a dependence of carbon stock on latitude and on the climatic parameters.
An Acad Bras Cienc (2017) 89 (2)
CARBON STOCK AND SEQUESTRATION IN MANGROVES 981
TABLE II
Results of the regression tests between climatic parameters and carbon stock in the aboveground biomass.
Parameter R2 a b F p
Annual Precipitation (BIO 12) 0.28 19.48 0.03 21.97 < 0.01
Precipitation of Coldest Quarter (BIO 19) 0.25 44.06 0.09 19.45 < 0.01
Isothermality (BIO 3) 0.24 -12.85 14.22 17.8 < 0.01
Water Balance 0.23 64.11 0.03 16.91 < 0.01
Temperature Annual Range (BIO 7) 0.23 151.28 -5.11 16.76 < 0.01
Precipitation of Wettest Month (BIO 13) 0.23 19.8 0.19 17.31 < 0.01
Precipitation of Wettest Quarter (BIO 16) 0.22 22.74 0.07 16.25 < 0.01
Latitude 0.22 121.21 -2.75 16.2 < 0.01
Minimum Temperature of Coldest Month (BIO 6) 0.21 -7.36 4.88 15.22 < 0.01
Mean Temperature of Coldest Quarter (BIO 11) 0.20 -43.24 5.44 14.26 < 0.01
Precipitation of Driest Month (BIO 14) 0.18 53.63 0.35 12.2 < 0.01
Precipitation of Driest Quarter (BIO 17) 0.17 52.37 0.11 11.93 < 0.01
Anual Mean Temperature (BIO 1) 0.11 -82.86 6.41 7.11 < 0.01
Mean Diurnal Range (BIO 2) 0.04 133.93 -6.74 2.46 0.12
high R² obtained by these revisions appear to have been overestimated due to the low availability of biomass data at the time, considering that they were developed more than twenty years ago. With a higher number of studies and data, the relative importance of latitude for controlling the aboveground biomass of mangroves proved therefore to be lower. This is reinforced by the more updated meta-analysis by Hutchison et al. (2014), which found an even lower R² (0.14).
The dependence of carbon stock on latitude indirectly reveals the dependence on solar radiation and climatic parameters. Overall, the results of the regressions with climatic parameters show that the carbon stock increases when: temperature increases, especially during colder periods; when the thermal amplitude decreases; when the water surplus (positive water balance) increases or water deficit (negative water balance) decreases; when the annual precipitation increases; and when rainfall of colder and wetter periods increases.
In the present study, multiple regression analysis were not significant (or had at least one partial regression coefficient that was not significant) when the number of variables were higher than 2, which is probably a result of the high variance and collinearity. Based on the independent variables related to precipitation and temperature that resulted in the best fitted simple regression equations (Table II), an integrative multiple regression equation was also obtained (Equation 1):
Equation 1:
Carbon Stock in AGB = -16.342 + (8.341 x BIO3) + (0.021 x BIO12)
(BIO3 = Isothermality; BIO12 = Annual Precipitation)
R² = 0.34
p < 0.05 (multiple repression)
p < 0.05 (partial regression coefficient for BIO3)
p < 0.05 (partial regression coefficient for BIO3)
The only previous study that has tested the dependence of aboveground biomass on climate variables for mangroves (Hutchison et al. 2014) used the WorldClim database and multiple linear regression analysis. In Hutchison et al. (2014), no test of significance is presented, nor for the whole equation, neither for each of the four partial coefficient of regression. Hence, it is unfortunately not possible to conclude whether the equations are statistically valid or not. Despite of this limitation, the two equations presented by those authors were developed grouping four average (Set 1: BIO1, 4, 12 and 15) and four extreme (Set 2: BIO 10, 11, 16 and 17) climate variables and reached R² values of 25.1 and 26.7%, respectively. These results are similar to the upper limits of R² values found in the present study for simple linear regressions of both average (up to 0.28 – Annual Precipitation) and extreme (up to 0.25 – Precipitation of the Coldest Quarter) climate variables. However, the R²-values obtained by the abovementioned authors are lower than the one obtained for the integrative multiple equation in the present study (Equation 1: R² = 0.34).
The analysis of existing studies that tested the dependence of aboveground biomass (and/ or size parameters such as canopy height or diameter at breast height) with latitude or climatic parameters in terrestrial forest ecosystems shows that the percentage of variability explained by the independent variable is also low and rarely exceeds 30% (Malhi et al. 2006, Moles et al. 2009, Stegen et al. 2011, Becknell et al. 2012). In the case of carbon sequestration, no regression was significant, which most likely does not indicate the absence of a dependence of carbon sequestration on the climatic parameters and latitude, but rather the limitations of the quantity and quality of data available in the literature, as discussed in section 3.1.
An Acad Bras Cienc (2017) 89 (2)
CARBON STOCK AND SEQUESTRATION IN MANGROVES 983
temperatures limit the structural development of forests, which are less developed and more likely to have shrub-like forms close to their latitudinal limits (Schaeffer-Novelli et al. 1990, Bridgewater and Cresswell 1999, Stevens et al. 2006, Soares et al. 2012). Therefore, the importance of low temperature conditions in limiting the structural development of mangrove forests explains the best fit observed for the regressions between carbon stock and isothermality (R² = 0.23) minimum temperature of the coldest month (R² = 0.21) or mean temperature of the coldest quarter (R² = 0.20) compared with the annual mean temperature (R² = 0.11).
The increased coefficients of determination of the regressions with water balance (R² = 0.23) and especially with annual rainfall (R² = 0.28) demonstrate the importance of rainfall input for regulating the salinity of interstitial water and, consequently, the structural development of mangrove forests. Although some mangrove species can tolerate salinity values higher than 35 (see Saenger 2002), typical mangrove species generally reach their maximum growth rates under low- to intermediate-salinity values (between 2 and 18) depending on the species physiology and on the interaction with other factors (Ball 1988). Therefore, considering that salinity of the interstitial water in mangroves decreases with the increase of rainfall (Semeniuk 1983, Cohen et al. 1999), the observed dependence of carbon stock on precipitation is sustained. Although the present study indicate that precipitation-related parameters control the aboveground biomass to a certain extent, it is important to highlight that local factors, such as tidal frequency and inland freshwater runoff, are generally recognized to exert a much higher influence on the structural of functional properties of mangrove forests, as reviewed in Lugo and Snedakker (1974) and Schaeffer-Novelli et al. (2000), and discussed in section 3.3.
Figure 4 - Carbon stock (a) and sequestration (b) in the aboveground biomass (AGB) per physiographic type (mean ±
standard error). The letters a-c indicate significant differences.
There are significant differences only for carbon stock (ANOVA: F = 132.5, p < 0.01), although the Tukey post-hoc
test did not indicate significant differences between basin and
shrub forests (p = 0.30). In the other cases, the probability is always lower than 0.01.
The regression with the precipitation of the coldest quarter had the second highest coefficient of determination (R² = 0.25), which most likely indicates an interaction between precipitation
and temperature. That is, the stress caused by the cooler winter temperatures may be mitigated by a reduction in salinity caused by increased precipitation. The precipitation of the wettest month and the wettest quarter showed higher
driest period. However, this hypothesis must be tested in a controlled sampling design before it is assumed to be true.
PHYSIOGRAPHIC TYPES
Data analysis by physiographic type (Figure 4a-b) revealed a decreasing pattern from fringe (stock: 81.80 ± 57.71 t C.ha-1; sequestration: 2.81 ± 1.46 t C.ha-1.year-1) to basin (stock: 52.97 ± 43.92 t C.ha-1; sequestration: 2.01 ± 2.11 t C.ha-1.year-1) and shrub forests (stock: 33.00 ± 23.66 t C.ha-1, sequestration: 1.26 ± 0.85 t C.ha-1.year-1). This pattern is significant only for the carbon stock (ANOVA: F = 132.5, p
< 0.01), although the Tukey post-hoc test did not indicate significant differences between basin and shrub forests (p = 0.30). In the other cases, the probability is always lower than 0.01.
The pattern observed in the analysis with all compiled data reflects the dominant pattern of variation in the carbon stock and sequestration from the existing studies. For carbon stock, or simply in the aboveground biomass, this pattern was observed locally both in the Indian and Western Pacific mangroves (e.g., Woodroffe 1985, Slim et al. 1996, Alongi et al. 2008, Alongi 2011) and in the Atlantic and Eastern Pacific mangroves (e.g., Imbert and Rollet 1989, Day Jr. et al. 1996, Lovelock et al. 2005). In the case of carbon sequestration, or biomass increment, this pattern was described by Imbert and Rollet (1989), Ross et al. (2001) and Alongi (2011).
Most of the studies show that biomass and rate of biomass increment increases as interstitial water salinity increases, the concentration of nutrients decreases and the H2S concentration increases. While most studies relate the reduction of biomass to increased salinity, some show the combined effect between salinity and concentration of H2S and nutrients in the substrate.
The analysis of physiographic types therefore indicate that local factors contribute significantly
to the spatial variability of the carbon stock and sequestration in the aboveground biomass of mangroves. The local variability is certainly one of the factors that explain the low fits of the regressions with latitude and climatic parameters presented previously. The role of local factors is also demonstrated when canopy height is integrated in the test of dependence of carbon stock on latitude, using the Latitude/Canopy Height ratio as the independent variable (Figure 5). The R² of this regression was 0.45, twice the R² of the regression with latitude as the independent variable (R² = 0.22, see Figure 3a). As canopy height is determined by both global/regional and local drivers, this result highlights the importance of local factors on the aboveground carbon stock of mangroves.
An Acad Bras Cienc (2017) 89 (2)
CARBON STOCK AND SEQUESTRATION IN MANGROVES 985
radiation, factors such as tidal flooding, freshwater input and nutrients availability determine the local structural variability. In this sense, maximum structure development, and hence carbon stock, of mangrove forests is expected to be found in low latitude regions, were solar radiation and air temperature are higher. But minimum development may be found at any latitude, wherever rainfall is low and local factors reach their minimum levels.
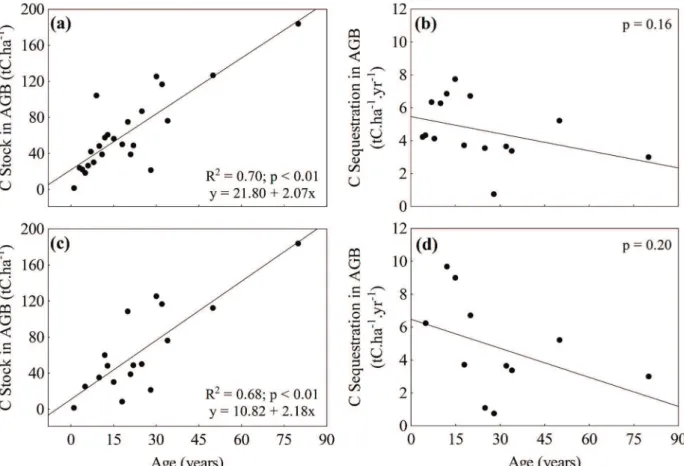
AGE AND SUCCESSIONAL STAGE
The scatter plots (Figure 6a-d) show that the carbon stock in the aboveground biomass tends to increase and sequestration tends to decrease linearly with age, whether including (Figure 6a-b) or excluding (Figure 6c-d) data from plantations and managed forests. The regression analysis, however, only confirmed this trend for carbon stock, with R²
= 0.70 for the analysis that included data from plantations and managed forests (F = 51.5, p
< 0.01, y = 21.80 + 2.07x) and R² = 0.68 for the analysis which excluded these data (F = 31.2, p
< 0.01, y = 10.82 + 2.18x). Therefore, this result shows that the exclusion of data from plantations and managed forests does not change substantially the relationship between carbon stock and age.
starts to reduce gradually towards the later stages. Aboveground biomass increases continuously but gradually reduces the rate of increase. These trends are in agreement with the model of Kira and Shidei (1967) and Whittaker and Woodwell (1967), which describes the behavior of biomass and net primary productivity (NPP) during the succession of terrestrial forests. Considering that the rate of aboveground biomass increment is regulated by NPP, it’s possible to assume it as a proxy of NPP.
Although not yet analyzed for mangrove forests, the factors that determine the dependence of net productivity on age have been widely discussed over the past 20 years for terrestrial forests (Ryan et al. 2004, Smith and Long 2001, Binkley et al. 2002). In summary, Smith and Long (2001) show that the peaks of gross and net productivity of a forest occur when it reaches maximum leaf cover. From this point, leaf biomass tends to stabilize, while wood biomass still increases. As a result, gross primary production stabilizes but wood respiration increases, leading to a gradual reduction in NPP.
CONCLUSIONS
It was shown in this study that at the global/ regional scale, carbon stock increases towards the Equator and its variability is dependent on climatic parameters, primarily temperature of coldest periods, isothermality, annual precipitation, and water balance. These parameters explain individually up to 28% of carbon stock variability, and up to 34% when integrated. When canopy height was integrated in the relationship between carbon stock and latitude (using the latitude/ canopy height ratio), the percentage of explanation increased to 45%, highlighting the contribution of local factors. Almost 70% of carbon stock variability is explained by the age of the forests, which demonstrates the importance of disturbances and forest dynamics to the local variability of carbon
stock. A statistically significant pattern of carbon stock variation by physiographic types (fringe > basin > shrub forests) indicates the importance of hydroperiod and edaphic parameters to the local variability of carbon stock. By demonstrating the contribution of local, regional and global factors to carbon stock, this study provides information to the forecast of the effects of future climate changes and local anthropogenic forcings on this ecosystem service.
ACKNOWLEDGMENTS
We are grateful to Conselho Nacional de Desenvolvimento Científico e Tecnológico (CNPq) for granting the scholarship to the first author. This study is a contribution of INCT AmbTropic - Brazilian National Institute of Science and Technology for Tropical Marine Environments, CNPq/FAPESB Grants 565054/2010-4 and 8936/2011.
REFERENCES
ADAME MF AND LOVELOCK CE. 2011. Carbon and
nutrient exchange of mangrove forests with the coastal ocean. Hydrobiol 663: 23-50.
ALONGI DM. 2008. Mangrove forests: Resilience, protection
from tsunamis, and responses to global climate change. Estuar Coast Shelf Sci 76: 1-13.
ALONGI DM. 2011. Patterns of mangrove wood and litter
production within a beach ridge-fringing reef embayment, Northern Great Barrier Reef Coast. Estuar Coast 34: 32-44.
ALONGI DM. 2014. Carbon Cycling and Storage in Mangrove
Forests. Annu Rev Mar Sci 6: 195-219.
ALONGI DM, TROTT LA, RACHMANSYAH, TIRENDI F, MCKINNON AD AND UNDU MC. 2008. Growth and
development of mangrove forests overlying smothered coral reefs, Sulawesi and Sumatra, Indonesia. Mar Ecol Prog Ser 370: 97-109.
BALL MC. 1988. Ecophysiology of mangroves. Trees 2: 129-142.
BECKNELL JM, KUCEK LK AND POWERS JS. 2012.
An Acad Bras Cienc (2017) 89 (2)
CARBON STOCK AND SEQUESTRATION IN MANGROVES 987
BINKLEY D, STAPE JL, RYAN MG, BARNARD HR AND FOWNES J. 2002. Age-related Decline in Forest
Ecosystem Growth: An Individual-Tree, Stand-Structure Hypothesis. Ecosyst 5: 58-67.
BOUILLON B ET AL. 2008. Mangrove production and carbon sinks: A revision of global budget estimates. Glob Biogeochem Cycles 22.
BRIDGEWATER PB AND CRESSWELL ID. 1999.
Biogeography of mangrove and saltmarsh vegetation: implications for conservation and management in Australia. Mangroves and Salt Marshes 3: 117-125.
CHMURA GL, ANISFELD SC, CAHOON DR AND LYNCH
JC. 2003. Global carbon sequestration in tidal, saline wetland soils. Glob Biogeochem Cycles 17.
CINTRON G, LUGO AE AND MARTINEZ R. 1985.
Structural and Functional Properties of Mangrove Forests.
In: D’arcy WG and Correa MD (Eds), The Botany and
Natural History of Panama: Missouri Botanical Garden, Saint Louis, USA, p. 53-66.
COHEN MCL, LARA RJ, RAMOS JF AND DITTMAR T.
1999. Factors influencing the variability of Mg, Ca and K in waters of a mangrove creek in Bragança, North Brazil. Mangroves and Salt Marshes 3: 9-15.
DAY JR JW, CONNER WH, LEY-LOU F, DAY RH AND
NAVARRO AM. 1987. The productivity and composition of mangrove forests, Laguna de Terminos, Mexico. Aquat Bot 27: 267-284.
DAY JR JW, CORONADO-MOLINA C, VERA-HERRERA FR, TWILLEY R, RIVERA-MONROY VH, ALVAREZ-GUILLEN H, DAY R AND CONNER W. 1996. A 7
year record of above-ground net primary production in a southeastern Mexican mangrove forest. Aquat Bot 55: 39-60.
DONATO DC, KAUFFMAN JB, MURDIYARSO D, KURNIANTO S, STIDHAM M AND KANNINEN M.
2011. Mangroves among the most carbon-rich forests in the tropics. Nat Geosci 4: 293-297.
DUKE NC. 1992. Mangrove Floristics and Biogeography. In: Robertson AI and Alongi DM (Eds), Tropical Mangrove
Ecosystems, Coastal and Estuarine Studies 41: American
Geophysical Union, Washington DC, USA, p. 63-100. DUKE NC. 2002. Gap creation and regenerative processes
driving diversity and structure of mangrove ecosystems. Wetlands Ecol Manag 9: 257- 269.
ELLIS WL, BOWLES JW, ERICKSON AA, STAFFORD N, BELL SS AND THOMAS M. 2006. Alteration of
the chemical composition of mangrove (Laguncularia racemosa) leaf litter fall by freeze damage. Estuar Coast Shelf Sci 68: 363-371.
ESTRADA GCD, SOARES MLG, FERNANDEZ V AND ALMEIDA PMM. 2015. The Evaluation of Carbon Stock
and Sequestration as an Ecosystem Service of Mangroves:
a Case Study from Southeastern Brazil. Intl J Biodiv Sci Ecosyst Serv Manag 11: 29-35.
EWEL KC, ZHENG S, PINZÓN ZS AND BOURGEOIS JA.
1998. Environmental effects of canopy gap formation in high - rainfall mangrove forests. Biotrop 34: 510-518.
HIJMANS RJ, CAMERON SE, PARRA JL, JONES PG AND
JARVIS A. 2005. Very high resolution interpolated climate surfaces for global land areas. Int J Climatol 25: 1965-1978.
HUTCHISON J, MANICA A, SETNAM R, BALMFORD A AND SPALDING M. 2014. Predicting Global Patterns in
Mangrove Forest Biomass. Conserv Let 7: 233-240.
IMBERT D AND ROLLET B. 1989. Phytomasse aerienne et production primaire dans la mangrove du Grand
Cul-De-Sac Marin (Guadeloupe, Antillas Francaises). Bull Ecol 20: 27-39.
IPCC. 2003. Good Practice Guidance for Land Use, Land-Use Change and Forestry, Intergovernmental Panel on Climate Change (IPCC), Hayama, Japan.
IPCC. 2006. Forest Lands. Guidelines for National Greenhouse Gas Inventories, Intergovernmental Panel on Climate Change (IPCC), Hayama, Japan.
KAO WY, SHIH CN AND TSAI TT. 2004. Sensitivity
to chilling temperatures and distribution differ in the mangrove species Kandelia candel and Avicennia marina. Tree Physiol 24: 859-864.
KIRA T AND SHIDEI T. 1967. Primary production and
turnover of organic matter in different forest ecosystems of the Western Pacific. Jpn J Ecol 17: 70-87.
KOMIYAMA A, ONG JE AND POUNGPARN S. 2008.
Allometry, biomass, and productivity of mangrove forests: A review. Aquat Bot 89: 128-137.
KRISTENSEN E, BOUILLON S, DITTMAR T AND MARCHAND C. 2008. Organic carbon dynamics in
mangrove ecosystems: A review. Aquat Bot 89: 201-219.
LEE RY, PORUBSKY WP, FELLER I, MCKEE KL AND JOYE SB. 2008. Porewater biogeochemistry and soil
metabolism in dwarf red mangrove habitats (Twin Cays, Belize). Biogeochem 87: 181-198.
LEE SY ET AL. 2014. Ecological role and services of
tropical mangrove ecosystems: a reassessment. Glob Ecol Biogeogr 23: 726-743.
LOVELOCK CE AND FELLER IC. 2003. Photosynthetic
performance and resource utilization of two mangrove species coexisting in a hypersaline scrub forest. Oecol 134: 455-462.
L O V E L O C K C E , F E L L E R I C , M C K E E K L ,
ENGELBRETCH BMJ AND BALL MC. 2004. The effect
of nutrient enrichment on growth, photosynthesis and hydraulic conductance of dwarf mangroves in Panamá. Funct Ecol 18: 25-33.
LOVELOCK CE, FELLER IC, MCKEE KL AND
structure and sediment characteristics in Bocas del Toro, Panama. Caribb J Sci 41: 456-464.
LUGO AE AND SNEDAKER SC. 1974. The ecology of
mangroves. Ann Rev Ecol Evol Syst 5: 39-64.
MALHI YR ET AL. 2006. The regional variation of
aboveground live biomass in old-growth Amazonian forests. Glob Change Biol 12: 1107-1138.
MAZDA Y, KOBASHI D AND OKADA S. 2006. Tidal-scale
hydrodynamics within mangrove swamps. Wetl Ecol Manag 13: 647-655.
MOLES AT, WARTON DI, WARMAN L, SWENSON NG,
LAFFAN SW, ZANNE AE, PITMAN A, HEMMINGS
FA AND LEISHMA MR. 2009. Global patterns in plant
height. J Ecol 97: 923-932.
NAGELKERKEN I ET AL. 2008. The habitat function of mangroves for terrestrial and marine fauna: A review. Aquat Bot 89: 155-185.
NASCIMENTO HEM AND LAURANCE W. 2004. Biomass
dynamics in amazonian forest fragments. Ecol Appl 14: 127-138.
NGUYEN HT, YONEDA R, NINOMIYA I, HARADA K, DAO TV, MAI T AND PHAN HN. 2004. The effects
of stand-age and inundation on carbon accumulation in mangrove plantation soil in Namdinh, Northern Vietnam. Trop 14: 21-37.
REN H, CHEN H, LI Z AND HAN W. 2010. Biomass
accumulation and carbon storage of four different aged Sonneratia apetala plantations in Southern China. Plant Soil 327: 279-291.
ROSS MS, RUIZ PL, TELESNICKI GJ AND MEEDER JF.
2001. Estimating above-ground biomass and production in mangrove communities of Biscayne National Park, Florida (USA). Wetl Ecol Manag 9: 27-37.
RYAN MG, BINKLEY D, FOWNES JH, GIARDINA CP AND SENOCK RS. 2004. An experimental test of the
causes of forest growth decline with stand age. Ecol Monogr 74: 393-414.
SAATCHI SS ET AL. 2011. Benchmark map of forest carbon stocks in tropical regions across three continents. Proc Natl Acad Sci 108: 9899-9904.
SAENGER P. 2002. Mangrove Ecology, Silviculture and
Conservation, Kluwer Academic Press, Dordretch,
Holland.
SAENGER P AND SNEDAKER SC. 1993. Pantropical trends
in mangrove aboveground biomass and annual litterfall. Oecol 96: 293-299.
SCHAEFFER-NOVELLI Y, CINTRON-MOLERO G, ADAIME RR AND CAMARGO TM. 1990. Variability
of mangrove ecosystems along the Brazilian coast. Estuar 13: 204-218.
SCHAEFFER-NOVELLI Y, CINTRÓN-MOLERO G, SOARES MLG AND TOGNELLA MT. 2000. Brazilian
mangroves. Aquat Ecosyst Health Manag 3: 561-570.
SEMENIUK V. 1983. Mangrove distribution in Northwestern Australia in relationship to regional and local freshwater seepage. Vegetatio 53: 11-31.
SIIKAMÄKI J, SANCHIRICO JS AND JARDINE SL. 2012.
Global economic potential for reducing carbon dioxide emissions from mangrove loss. Proc Natl Acad Sci 109: 14369-14374.
SLIM FJ, WADA MPM, KODJO M AND HEMMINGA
MA. 1996. Biomass and Litterfall of Ceriops tagal and Rhizophora mucronata in the Mangrove Forest of Gazi Bay, Kenya. Mar Freshw Res 47: 999-1007.
SMITH FW AND LONG JN. 2001. Age-related decline in
forest growth: an emergent property. For Ecol Manag 144: 175-181.
SNEDAKER SC AND LAHMAN EJ. 1988. Mangrove
Understorey Absence: A Consequence of Evolution? J Trop Ecol 4: 311-314.
SOARES MLG, ESTRADA GCD, FERNANDEZ V AND
TOGNELLA MMP. 2012. Southern limit of the Western South Atlantic mangroves: Assessment of the potential effects of global warming from a biogeographical perspective. Estuar Coast Shelf Sci 101: 44-53.
SPALDING M, KAINUMA M AND COLLINS L. 2010.
World atlas of mangroves, Earthscan, USA.
STEGEN JC, SWENSON NG, ENQUIST BJ, WHITE EP, PHILLIPS OL, WEISER MD, JØRGENSEN PM, MONTEAGUDO A, MENDOZA A AND VARGAS PN.
2011. Variation in above-ground forest biomass across broad climatic gradients. Glob Ecol Biogeogr 20: 744-754.
STEINKE TD AND NAIDOO Y. 1991. Respiration and net
photosynthesis of cotyledons during establishment and early growth of propagules of the mangrove, Avicennia marina, at three temperatures. S Afr J Bot 57: 171-174.
STEVENS PW, FOX SL AND MONTAGUE CL. 2006.
The interplay between mangroves and saltmarshes at the transition between temperate and subtropical climate in Florida. Wetl Ecol Manag 14: 435-444.
STUART SA, CHOAT B, MARTIN KC, HOLBROOK NM
AND BALL MC. 2007. The role of freezing in setting the
latitudinal limits of mangrove forests. New Phytol 173: 576-583.
SUWA R AND HAGIHARA A. 2008. Seasonal changes
in canopy photosynthesis and foliage respiration in a Rhizophora stylosa stand at the northern limit of its natural distribution. Wetl Ecol Manag 16: 313-321.
TWILLEY RR AND DAY JR JW. 1999. The productivity and nutrient cycling of mangrove ecosystems. In: Yáñez-Arancibia A and Lara-Domínguez AL (Eds), Ecosistemas
de Manglar en América Tropical: NOAA, Silver Spring, USA, p. 127-152.
TWILLEY RR, CHEN RH AND HARGIS T. 1992. Carbon
An Acad Bras Cienc (2017) 89 (2)
CARBON STOCK AND SEQUESTRATION IN MANGROVES 989
of tropical coastal ecosystems. Water, Air & Soil Pollut 64: 265-288.
UNEP-WCMC. 2006. Shoreline protection and other ecosystem services from mangroves and coral reefs, UNEP-WCMC, Cambridge, UK.
VAN DER WERF GR, MORTON DC, DE FRIES RS, OLIVE
JGJ, KASIBHATLA PS, JACKSON RB, COLLATZ GJ
AND RANDERSON JT. 2009. CO2 emissions from forest
loss. Nat Geosci 2: 737-738.
VOGT J, SKÓRA A, FELLER IC, PIOU C, COLDREN G AND BERGER U. 2012. Investigating the role of
impoundment and forest structure on the resistance and resilience of mangrove forests to hurricanes. Aquat Bot 97: 24-29.
WHITTAKER RH AND WOODWELL GM. 1967. Surface
area relations of woody plants and forest communities. Am J Bot 54: 931-939.
WOODROFFE CD. 1985. Studies of a mangrove basin, Tuff
Crater, New Zealand. III. The flux of organic and inorganic particulate matter. Estuar Coast Shelf Sci 20: 447-461. ZAR JH. 1996. Biostatistical Analysis, Prentice Hall, New