проблеми і держава. — 2015. — Вип. 1 (12). — С. 5-15. — Режим доступу до журн.:
http://sepd.tntu.edu.ua/images/stories/pdf/2015/15ckamip.pdf.
Celuch K. (2015). Efficient use of data resources using the example of meetings and events industry management in Poland.
Sotsial'no ekonomichni problemy i derzhava – Socio Economic Problems and the State [online]. 12 (1), p.5$15. [Accessed April 30, 2015]. Available from: <http://sepd.tntu.edu.ua/images/stories/pdf/2015/15ckamip.pdf.>.
UDC 338.48 (075.8)
JEL Classification: M31
Krzysztof Celuch
Vistula University,
3 Stokłosy Str., 02-787 Warsaw, Poland
e mail: k.celuch
@
vistula.edu.pl
Ph.D., Assist. Prof. / Vice Rector
EFFICIENT USE OF DATA RESOURCES USING THE EXAMPLE OF
MEETINGS AND EVENTS INDUSTRY MANAGEMENT IN POLAND
Abstract. The main objective is to present results, which determine the number, size of meetings and events, which are held in Poland in 2014 and present their economic value. In addition, the research presents the profile of participants, characteristics of meetings and material concerning the importance of meeting industry in shaping competitive position of world and Polish cities. The research presents the image of 18820 meetings and events of quantitative and qualitative characteristics and analysis of cities and regions. The contribution of the meetings industry to a state economy, estimated based on the data, is 1121,1 million PLN of value added generated in the hotel base and 141,5 million PLN in gastronomy, i.e. 1262,6 million PLN in total. The contribution to creation of jobs is 15519 employees in the hotel base and 11954 in gastronomic services, characterized by much smaller productivity than jobs in the hotel base. It gives 27473 jobs nationwide in total.
Keywords: meetings industry, events, Poland, data, conferences, incentives.
Introduction. The main objective is to present results, which determine the number, size of meetings and events, which are held in Poland in 2014 and present their economic value. In addition, the Report presents the profile of participants, characteristics of meetings, which are organised by recommended organisers and material concerning the importance of meeting industry in shaping competitive position of world and Polish cities.
This year's edition of the report presents the image of 18820 meetings and events of quantitative and qualitative characteristics. In addition, another analysis of cities and regions appeared and continuation of research concerning the profile of participants of meetings which were held in Poland. The analysis presented in the following Report is traditionally based on standards assumed in the study concerning tourism related to the meeting entitled "Measuring the Economic Importance of the Meetings Industry Developing a Tourism Satellite Account Extension", prepared by the World Tourism Organization (UNWTO, 2006) and affiliated members. According to UNWTO assumptions, statistical studies, meetings and events which comply with the following conditions are taken into account: participation of minimum 10 participants, duration at least of half a day, i.e. 4 hours and more, place (venue), where the meeting is held and was paid especially for this purpose.
year prepare statistics with regard to meetings industry. Both rankings are a stimulus for further development of destinations and often an important decision-making premise for organisers of congresses. ICCA forms its ranking on the basis of collected data on association meetings with breakdown into two categories: international associations and international, non-governmental associations which meet at the same time three conditions: they are held periodically, they gather minimum 50 participants, they migrate between at least 3 countries.
Another significant report is "International Meeting Statistics" issued by the Union of International Association (UIA, 2013). UIA forms its ranking on the basis of collected data on international meetings which meet at the same time four criteria: they last at least 3 days, they gather minimum 300 participants, participants come from minimum 5 countries, at least 40% of participants come from foreign countries.
Both Reports (ICCA, UIA) analyze meetings in terms of such criteria as: number of participants, field and subject matter and their character. Number of associations meetings qualified by International Congress and Convention Association (ICCA, 2014) and also by Union of International Associations (UIA) is different owing to already mentioned and approved criteria which determine the general community. However, it is worth comparing and presenting in the direct comparison, the number of meetings organised in Poland which is shown in Fig. 1.
Fig. 1 Number of association meetings organised in Poland in the years 2003-2013 according to the statistics of associations ICCA/UIA
Source: Own study on the basis of ICCA and UIA data
Data are juxtaposed in Fig. X and show the number of association meetings classified by ICCA and UIA in the years 2003-2013. According to UIA data in Poland, the majority of meetings (159) was organised in 2005. Further years in the ranking were: 2003 – 156 meetings and 2006 – 151 meetings. Number of meetings in 2013 is worth mentioning, when significant growth occured (114) as compared to 2012 (63). On the other hand, according to ICCA the year 2011 turned out to be the best (193 meetings). We can observe a significant growth as compared to 2010. Decrease to 150 meetings in 2012 is worth mentioning, but also growth in 2013. The worst years according to UIA data turned out to be the year 2010 (74 meetings) and in accordance with ICCA data the year 2003 (65 meetings). In order to enrich the above data we can juxtapose the detailed information on specific events which were held in Poland in 2013.
coupled to local conditions of tourism development. The urban tourism industry, treated as an urban function, is subject to intensive internationalization of a whole city. The internationalization of the tourist function has an impact on management activities performed by urban DMOs” (Zmyślony, 2014).
Methodology. The research was prepared by Poland Convention Bureau of Polish Tourist Organization in cooperation with the regional marketing offices from Poland and venues where meetings and events are held. The primary purpose of it, was identification of number and size of meetings and events which are organised in Poland in 2014 (among others, social, economic, business). The research was addressed to people who collect statistical data in the above mentioned venues as well as employees of regional marketing offices responsible for these activities.
According to the adopted formula 4 groups of meetings/events were divided: conference/congress, corporate event, incentive event and fairs/exhibitions. For the purpose of research the following terms were adopted:
· "conference/congress" determines national and international associations meetings without any clear division into governmental meetings and
· "corporate event" determines the company event, with particular focus on trainings, workshops, seminars, press conferences, products premieres,
· incentive events, including incentive travels of profitable, arbitrary character,
· "fairs/exhibitions" are dedicated to large events of any subject which are usually held in the area of fairs.
Assumptions and goals were verified on the basis of quantitative analysis and included also in the context of the branch, with breakdown into meetings and events which are held within the following thematic groups: humanities, technological, IT and communication, economic and political as well as medical. The nature of the above groups should be understood as follows:
· humanities – meetings and events related to culture and art as: history of art, philology, musicology, ethics, philosophy and these associated with society as: history, archaeology, sociology, psychology, economics and anthropology;
· technological – meetings and events related to architecture and urban planning, automatics and robotics, bio-cybernetics, construction, electronics, electrical engineering, geodesy and cartography, mining, engineering, chemical technology, transport;
· IT and communication – meetings and events related to academic and technical discipline involved in processing of information, including technologies of information processing, technologies of flexible production of information processing as well as communication systems, communication and its derivatives;
· economic and political – meetings and events related to economics, politics, finances, management sciences, food commodities;
· medical – meetings and events related to medical sciences including: stomatology, pharmacy, public health, physiotherapy, laboratory diagnosis, medical technology, medical biology, bio-gerontology.
Personal scope of the analysis included meetings and events which were held in Polish cities in 2014 with particular focus on cities and regions where regional venue marketing offices operate as well as individual venues which took part in the project.
Assumed criteria of meeting and events analysis include: · number of participants and their nationalities;
· duration of national and international meetings as well as events; · categories and types of meetings and events;
· estimated economic value of organised meetings which were held in Poland.
Characteristics of the research sample. The survey questionnaire was transferred to ten regional convention bureaus and all of them transferred its results in accordance with the previously agreed guidelines. In addition, it was sent to more than 200 conference venues from Poland. However, it is worth noticing that analyzed venues constitute only the part of all which have the possibility to coordinate meetings and events related to meetings industry. On the other hand, these are venues with which the cooperation may result in creation of detailed material devoted to associations meetings and corporate events which were organised in Poland.
During the analysis of the number of meetings which were introduced into the database we can note that a vast majority of them was held in hotels: 61.36% -11548 meetings (in 2013 65,11% -11785 meetings). The second place covers exhibition and congress centres 18.93% – 3562 meetings (2012: 15,9% – 2877 meetings). The third place covers venues or halls which are rented for the purpose of special events 13,86% – 2609 meetings (2013: 13,95% – 2525 meetings). On the other hand, the last place covers universities 5,85% 1101 meetings (2013: 5,04% 913 meetings) (Table 1).
Table 1 Number of venues which provide statistical data
Place of event/venue Number %
Hotel 11548 61,36%
Venue /hall for special events 2609 13,86%
Exhibition/Congress centre 3562 18,93%
University 1101 5,85%
Total 18820 100,00%
Source: Own study
Results. Quantitative analysis shall be started from characteristics according to months during which the vast majority meetings and events took place (Table 2).
Table 2 Seasonality of the number of meetings and events which took place in 2014
Month Number %
January 1218 6,47%
February 1369 7,27%
March 1838 9,77%
April 1542 8,19%
May 1964 10,44%
June 1764 9,37%
July 790 4,20%
August 666 3,54%
September 1936 10,29%
October 2280 12,11%
November 1993 10,59%
December 1460 7,76%
Total 18820 100,00%
Source: Own study on the basis of PCB POT data
meetings and events took place (790 – 4,20%, 666 – 3,54%). As compared to the previous year – 2013 seasonality of number of meetings and events is similar. October and November turned out to be the key months and the opposite the summer period namely July and August as the least frequently chosen. On the other hand, May and September are also well visible and gather more than 20% of all meetings.
Another important element which was examined is the duration of meetings and events which took place in 2014. Data concerning 18820 meetings and events were analyzed. All of the above mentioned meetings were divided into 3 groups according to the time of their duration.
65,22% which constitute 12274 all of meetings/events lasted less than 1 day. Table 2 includes those which lasted 2 days (20,25% – 3811 meetings) and more than 2 days i.e. 2735 meetings which constitute 14,53%.
Table 2 Number of meetings and events according to duration
Number of days Number %
1 day 12274 65,22%
2 days 3811 20,25%
more than 2 days 2735 14,53%
Total 18820 100,00%
Source: Own study on the basis of PCB POT data
The analysis covered the number of participants according to the type of organised meetings or events. In 2014 3,900,002 participants took part in meetings or events in Poland. Meetings and events were divided into 5 thematic types, according to the assumed categories by regions, cities and venues which prepared the local studies (Table 3).
Table 3 Number of participants of meetings and events according to the type
Type of meeting Number %
Economic and political 844498 21,65%
Humanities 1221107 31,31%
IT and communication 307059 7,87%
Medical 385645 9,89%
Technical 1141693 29,27%
Total 3900002 100,00%
Source: Own study on the basis of PCB POT data
According to the list the greatest attendance concerned meetings and events in the humanities in which altogether 1221107 participants took part, which constituted more than 1/3 of the whole. The second category covered meetings of technical character – 1141693 participants, which constitute almost 30% per year. On the other hand, the smallest interest (less than 8%) concerned thematic meetings and events related to IT and communication – 307059 participants. 844498 participants took part in these meetings or events which are related to economics and politics. On the other hand, meetings and events of medical character gathered 385645 participants which constitute almost 10%.
Table 4 Number of participants of meetings and events according to their category
Category Number %
Conference/Congress 1123826 28,82%
Fairs and exhibitions 2111989 54,15%
Corporate events 331202 8,49%
Incentive event 332985 8,54%
Total 3900002 100,00%
Source: Own study on the basis of PCB POT data
54,15% of all participants of described meetings and events who participated in fairs and exhibitions, gathered 2111989 participants. The next place covered participants of congresses and conferences: 1123826 participants (28,82%). The least numerous category with regard to participation turned out to be incentive events: 332985 participants (8,54%), as well as corporate events (331202 participants – 8,49%)
The analysis covered also number of participants with breakdown into particular months (Table 5). Based on this, months were specified, in which the greatest number of participants took part in meetings and events which were organised in Poland. The first place covered March in which the number of participants amounted to 645135 which constituted 16,54% in the context of the entire year. The second place covered October with 610402 participants (15,65%) which should be considered in the context of number of events. It suggests organization of large meetings, in particular, during these two months.
What is more, more than 400,000 participants took part in meetings and events in such months as: May (411185) and September (444216). Month in which the smallest number of participants was recorded is: July with 83708 participants and was last in the entire year (2,15% people).
Table 5 Seasonality of number of participants of meetings and events
Month Number %
January 145199 3,72%
February 374657 9,61%
March 645135 16,54%
April 275778 7,07%
May 411185 10,54%
June 248816 6,38%
July 83708 2,15%
August 100670 2,58%
September 444216 11,39%
October 610402 15,65%
November 365890 9,38%
December 194346 4,98%
Total 3900002 100,00%
Source: Own study on the basis of PCB POT data
with breakdown into countries and continents. Due to diverse character 4 geographic groups were established and three of them are related to national participants.
Table 6 Geographic diversity concerning the place of origin
Origin of participants Number %
Local 5462 29,02%
Regional 3770 20,03%
Nationwide 6601 35,07%
International 2987 15,87%
Total 18820 100,00%
Source: Own study on the basis of PCB POT data
Analyzed 18820 meetings and events were assigned to the aforementioned groups. Due to difficulties with regard to determination of nationalities of participants, the largest group of participants who came from a given country or geographic area was assumed as a model. The prepared form, owing to its simplicity, does not contain any detailed data concerning particular participants, therefore obtained information were prepared mostly by organisers on the basis of contacts with clients. Determination of the place of origin of participants was not possible in the case of Warsaw because such data were not submitted. However, the remaining, collected meetings show also the place of origin of participants.
The analysis of 18820 meetings and events showed that 15833 meetings covered mostly participants from Poland. The system of this group is presented with breakdown into three geographical areas: nationwide group i.e. participants come from one or more Voivodeships (6601 meetings – 35,07%); regional group (3770 meetings – 20,03%); local group (5462 meetings – 29,02%). Presented data make it possible to state that 84% participants of analyzed meetings were Poles.
Qualitative analysis covered also breakdown into types of meetings and events from the point of view of the object of sciences (Table 7). The largest group (27,67%) constituted meetings and events from the group of economic and political character (5207). The next places covered meetings and events of technical character -4536 (24,10%), as well as these in the humanities – 4518 (24,01%). The further places covered meetings and events devoted to medical issues 2476 – 13,16% as well as information and communication – 2083 (11,07%).
Table 7 Number of meetings and events according to their type
Type of meeting Number %
Economic and political 5207 27,67%
Humanities 4518 24,01%
IT and communication 2083 11,07%
Medical 2476 13,16%
Technical 4536 24,10%
Total 18820 100,00%
Source: Own study on the basis of PCB POT data
Table 8 Number of meetings and events according to their category
Category Number %
Conference/Congress 10318 54,82%
Fairs 672 3,57%
Corporate events 5558 29,53%
Incentive event 2272 12,07%
Total 18820 100,00%
Source: Own study on the basis of PCB POT data
The analysis of meetings industry in Poland creates the possibility to compare number of meetings and events of social, economic, business and political character which were organised in particular cities. The following information, presented below, depicts the number of meetings which were presented on the basis of data provided by regional Convention Bureaux and introduced directly to the on-line form on Poland Convention Bureau website. Summarized data showed the image of meetings and events which took place in Polish cities in 2014. Below is presented the list of TOP 20 Polish cities according to number of meetings and events which took place in these cities. All the remaining cities were classified in the other group, which constituted less than 2%. However, 5 crucial cities according to the ranking from 2014 are presented below: Kraków – 3986 (21,18%), Warsaw – 3586 (19,05%), Wrocław – 2791 (14,83%), Poznań – 1716 (9,12%) and Gdańsk – 1676 (8,91%) (Table 9).
Table 9 Number of meetings and events which took place in particular Polish cities
City Number %
Bydgoszcz 779 4,14%
Gdańsk 1676 8,91%
Gdynia 94 0,50%
Gliwice 9 0,05%
Katowice 1576 8,37%
Kielce 659 3,50%
Koszalin 6 0,03%
Karpacz 12 0,06%
Krakow 3986 21,18%
Łódź 1241 6,59%
Ostromecko 27 0,14%
Otrębusy 50 0,27%
Poznań 1716 9,12%
Rzeszów 11 0,06%
Szczecin 9 0,05%
Toruń 224 1,19%
Wałbrzych 28 0,15%
Warszawa 3586 19,05%
Wrocław 2791 14,83%
Other 340 1,81%
Total 18820 100,00%
Collected information was also used to prepare the list of number of meetings and events with breakdown into categories and according to the place of its organization.
On the basis of collected data, we can state that in 2014 the largest number of congresses and conferences was held in Warsaw (2582). The next cities are Kraków (2439), Poznań (752) and Gdańsk (680).
Corporate events, in accordance with presented data, most often were organised in Katowice (1044) and Gdynia is the last city in this ranking. Kraków occupies the first place in the category of incentive events (673). The second city is Wrocław (431) and Gdańsk (391). The last category which was taken into account was fairs and exhibitions. Studies provided by regional Convention Bureaux indicate that the largest number of such events was held in Wrocław (146) and Kraków (116).
Table 10 Number of meetings and events which were organised in Polish cities according to categories
City Conferences/Congresses Fairs Corporate
events
Incentive
events Total
Bydgoszcz 355 41 302 81 779
Gdańsk 680 38 567 391 1676
Gdynia 66 9 5 14 94
Katowice 462 17 1044 52 1575
Kielce 585 49 22 3 659
Krakow 2439 116 748 673 3976
Łódź 653 31 405 152 1241
Poznań 752 110 628 216 1706
Toruń 85 5 111 23 224
Warszawa 2582 71 777 156 3586
Wrocław 1359 146 855 431 2791
Source: Own study on the basis of PCB POT data
Implications and conclusions. Efficient use of data resources using the example of meetings and events industry statistics in Poland in 2014 is a good case study how data from more than ten regional convention bureaus can be collected and elaborated.
But the most important is the fact that based on the conducted research economic impact was elaborated and can be used as a basement. Average duration of congresses during which tests were conducted was 2,98 days and average stay of participants, 4,07 days (+/-6%). It means part of participants stayed at the place of a congress longer than it lasted. The estimated average number of nights in the accommodation base is 2,79 (+/-9.7%). The average daily cost of accommodation amounted to 744,57 PLN (+/-11.3). As regards expenses for restaurant services, they were 130,42 PLN (+/-23%), and culture-leisure expenses, 18,67 PLN (+/-42%). As far as the average duration of fairs when the survey was conducted, it amounted to 3,15 days, and the estimated time spent on participation in fairs by their participants was 3,22 days (+/- 3%). The average number of nights related to the participation in fairs was 1,87 (+/- 5,6%). On the other hand, the average daily cost of accommodation estimated relative to the participants of fairs was 528,1 PLN (+/-7,8%). The collected data also enable a relatively precise estimate of daily expenses for restaurant services, 159,95 PLN (+/-13,4%) and for culture-leisure services, 9,46 PLN (+/-33,5%).
The collected data enable only a partial evaluation of the meetings industry’s contribution to economy. It is possible to assess the volume of sales of accommodation and gastronomic services purchased by the participants of events and expenses for culture-leisure services. Based on data of the Poland Convention Bureau, the figures amounted to:
gastronomic service sales – 484,7 million PLN culture-leisure sales – 54,7 million PLN.
The available data on the global production in section I relate to 2012, when it amounted to 34388 million PLN 1, therefore the estimated contribution of the meetings industry to the production of this section is 8,1%, with 6,7% for accommodation only. Thus it is an important contribution to the industry operations in Poland, especially since the estimate did not fully include the sales for the benefit of the meetings industry. It is also worth adding that the estimated sales amount of accommodation, gastronomic and culture-leisure services (2842,2 million PLN) supplied the local economies that hosted events and meetings.
Based on more detailed data on the share of value added in section I in 2012, which are available in the Eurostat base, the contribution of sales of hotel and gastronomic services in developing the value added and jobs can be calculated2. The contribution of the meetings industry to a state economy, estimated based on the data, is 1121,1 million PLN of value added generated in the hotel base and 141,5 million PLN in gastronomy, i.e. 1262,6 million PLN in total. The contribution to creation of jobs is 15 519 employees in the hotel base and 11 954 in gastronomic services, characterized by much smaller productivity than jobs in the hotel base. It gives 27 473 jobs nationwide in total.
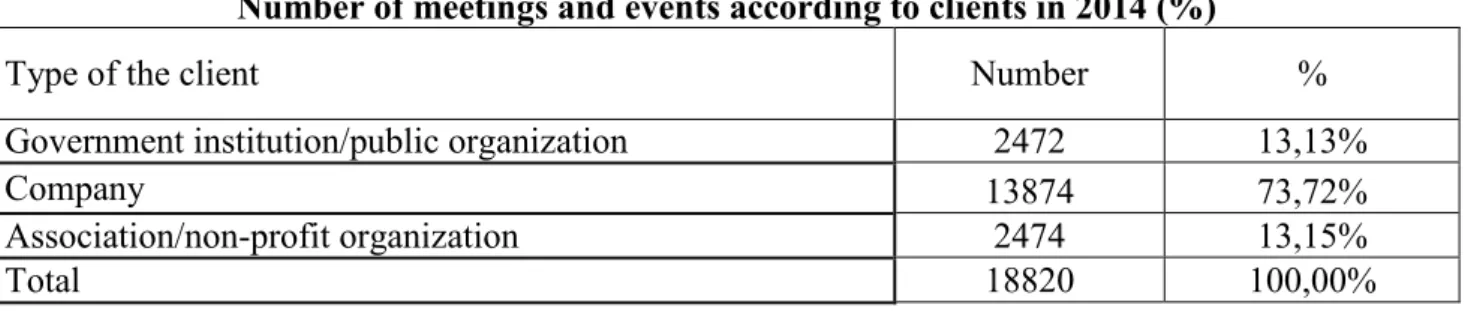
Recommendations for future research. Thanks to the collected data it was possible to show information on the type of groups, which took part in the meeting. On the basis of collected information it was stated that 73,72%, i.e. 13874 meetings and events were organised at the request of enterprises. The remaining two groups: associations and non-profit organizations (2474 – 13,5%), as well as government and public institutions – 2472 meetings (13,13%) had similar share as the client and differed only by several meetings (Table 11).
Table 11 Number of meetings and events according to clients in 2014 (%)
Type of the client Number %
Government institution/public organization 2472 13,13%
Company 13874 73,72%
Association/non-profit organization 2474 13,15%
Total 18820 100,00%
Source: Own study on the basis of PCB POT data
As it is seen major group are companies which are directly linked to private investors. Moreover they can come from all around the world and can be focused on exchanging services and money globally. The limited internationalization of tourism management in the Polish cities is reflected by rather moderate changes to the organizational structures of DMOs. In cities where the tourist function is relatively the most internationalized, changes to the structures are substantial, i.e. in Kraków, Gdansk and Wroclaw” (Zmyślony, 2014)
Finally it is good to remember that meetings industry is directly linked to local strategies and investments. Local governments very often think about congress venues as a source for additional money, but they forget about long-term plans and initiatives. The reform of the administrative system in Poland carried out at the beginning of the 90’ has initiated the process of decentralization of public finance. It induced a necessity of creating a development strategy, including the development of tourism infrastructure, at the level of the local government. The activity of local government units, tourism institutions and organizations largely influences the dynamics of local
1
National accounts by institutional sectors and subsectors 2009-2012, Central Statistical Office (CSO), Warsaw 2014, p. 316.
2
and regional tourism development however due to limited means the possibilities of shaping investments directly decrease.” (Nowak S., Ulfik A., 2013)
Speaking about efficient use of data resources using the example of meetings and events industry management in Poland we need to say this this is the subject, which can be elaborated in many ways starting from statistic methods and finishing with human behavior. That is why it is a huge area to develop and consider for future research.
REFERENCES
1. Celuch K., (2015) Managing content, product and motivation in meetings and events industry, Warszawa: Wydawnictwo Uczelnia Vistula
2. Celuch K., Davidson R. (2011) Better Business Results through Motivational Experiences and Incentive Travel, Warszawa: Wydawnictwo Uczelnia Vistula
3. Hofstede G., Hofstede G. J. (2008) Kultury i organizacje, Warszawa: Polskie Wydawnictwo Ekonomiczne
4. Taylor C., Lee DH. (2007) Cross-cultural Issues in Buyer Behavior, UK: Advances in International Marketing Volume 18 – Cross-Cultural Buyer Behavior
5. Wallace E., Mathai M., Heath A. (2008) The Convention Industry Council Manual, Washington: Convention Industry Council
6. World Tourism Organisation: Measuring the Economic Importance of the Meetings Industry. Developing a Touri sm Satellite Account Extension (2006) Madrid: World Tourism Organisation
7. Organizacja Narodów Zjednoczonych: Terminologia turystyczna. Zalecenia WTO, ONZ-WTO, UKFiT, Warsaw 1995.
8. Celuch K., Dziedzic E.: Report: "Przemysł spotkań i wydarzeń w Polsce – Poland Meetings and Events Industry Report 2011", Warsaw 2011
9. Celuch K.: Report: „Przemysł spotkań i wydarzeń w Polsce – Poland Meetings and Events Industry Report 2013”, Warsaw 2014
10. Convention Industry Council; APEX Industry Glossary, The glossary of the meetings, conventions and exhibitions industry, Alexandria, VA, USA 2013
11. Zmyślony P. (2014). Internationalization of tourism management in Polish cities: Strategies, marketing and structures, „European Journal of Tourism, Hospitality and Recreation” 5(3), 69-89
12. Nowak S., Ulfik A.; Financial independence of communities and the support of tourism infranstructure, Journal of Tourism, Recreation & Sport Management. – Vol. 1 2013, s. 21-26
13. National accounts by institutional sectors and subsectors 2009-2012, Central Statistical Office (CSO), Warsaw 2014, p. 316.
14. Structural statistics of companies in the EUROSTAT base and own calculations according to the annual exchange rate of 4.18 PLN http://appsso.eurostat.ec.europa.eu/nui/show.do?dataset=ert_bil_eur_a&lang=en, 2.03.2015.
Рецензія: д.е.н., проф. Андрушків Б. М.
Reviewed: Dr., Prof. Andrushkiv B. M.
Received: February, 2015
1st Revision: April, 2015