A Complex Network Approach to
Distributional Semantic Models
Akira Utsumi*
Department of Informatics, The University of Electro-Communications, Tokyo, Japan
Abstract
A number of studies on network analysis have focused on language networks based on free word association, which reflects human lexical knowledge, and have demonstrated the small-world and scale-free properties in the word association network. Nevertheless, there have been very few attempts at applying network analysis to distributional semantic models, despite the fact that these models have been studied extensively as computational or cogni-tive models of human lexical knowledge. In this paper, we analyze three network properties, namely, small-world, scale-free, and hierarchical properties, of semantic networks created by distributional semantic models. We demonstrate that the created networks generally exhibit the same properties as word association networks. In particular, we show that the distribution of the number of connections in these networks follows the truncated power law, which is also observed in an association network. This indicates that distributional semantic models can provide a plausible model of lexical knowledge. Additionally, the observed dif-ferences in the network properties of various implementations of distributional semantic models are consistently explained or predicted by considering the intrinsic semantic fea-tures of a word-context matrix and the functions of matrix weighting and smoothing. Further-more, to simulate a semantic network with the observed network properties, we propose a new growing network model based on the model of Steyvers and Tenenbaum. The idea underlying the proposed model is that both preferential and random attachments are required to reflect different types of semantic relations in network growth process. We dem-onstrate that this model provides a better explanation of network behaviors generated by distributional semantic models.
Introduction
How word meaning is represented in human memory is a longstanding problem that has attracted the interest of linguists, philosophers, psychologists and other scholars. A number of theories and models for lexical representation or the mental lexicon—e.g., semantic networks [1,2], feature-list theory [3,4], and prototype theory [5,6]—have been proposed, and their validity has been examined and debated using psychological experiments [7,8]. Computational modeling, especially the connectionist model [9], has also been employed to explore lexical
a11111
OPEN ACCESS
Citation:Utsumi A (2015) A Complex Network Approach to Distributional Semantic Models. PLoS ONE 10(8): e0136277. doi:10.1371/journal. pone.0136277
Editor:Zi-Ke Zhang, Hangzhou Normal University, CHINA
Received:December 1, 2014
Accepted:July 22, 2015
Published:August 21, 2015
Copyright:© 2015 Akira Utsumi. This is an open access article distributed under the terms of the
Creative Commons Attribution License, which permits unrestricted use, distribution, and reproduction in any medium, provided the original author and source are credited.
Data Availability Statement:All relevant data are within the paper and its Supporting Information files.
Funding:Financial support for this study was provided by Japan Society for the Promotion of Science KAKENHI Grant Numbers 23300098 and 15H02713, and by UEC Research Support Program from the University of Electro-Communications.
representation. Brain science has revealed the biological and neuroanatomical basis of the men-tal lexicon [10].
Recently, network science or network analysis has emerged as a new research methodology for the study of language in general and semantic representation in particular [11–13]. Net-work analysis takes as input a netNet-work produced from the observable data (i.e., word cooccur-rence and word association) about the mental lexicon or human semantic memory, and reveals the properties of the network. These network properties provide information about the struc-ture of the mental lexicon and the cognitive mechanism underlying the semantic strucstruc-ture, nei-ther of which is directly observable from the data [12]. Furnei-thermore, despite their simplicity, network models that simulate the observed network properties can provide valuable insight into the process of lexical development by which these network properties emerge. Therefore, a large number of network studies have investigated semantic or lexical representation and its related phenomena such as word co-occurrence [14–17], the phonological lexicon [18,19], the-saurus [20,21], and verbal fluency [22]. The most studied phenomenon among these is free word association [23,24], because it reflects human lexical knowledge acquired through world experience, thereby revealing the structure of human semantic memory or the mental lexicon more directly and efficiently than other lexical phenomena.
Network studies on word association have demonstrated the small-world and scale-free properties of semantic networks [21,25–29]. For an association network where each word is represented by a node and an association relation between two words is represented by an edge joining the corresponding nodes, the small-world property indicates that any two word nodes are connected by traversing only a few edges, even if the network is highly clustered locally. The scale-free property indicates that most word nodes are poorly connected, while a relatively small number of words are highly connected; as a result, the distribution of the number of con-nections for each node follows a power law. All existing studies agree on the small-world prop-erty of the association network, but some studies [29] suggest that the association network is not completely scale-free; rather the network is characterized by a power law truncated by an exponential cutoff, where the most connected words have a smaller connection than would be expected in a purely power-law distributed network. These network properties are expected to reveal the cognitive mechanism underlying the structure of the mental lexicon [12]. For exam-ple, the small-world structure sheds light on an efficient search process in semantic memory. Investigating various network models that generate scale-free networks provides valuable insight about psychological processes involved in lexical development [21].
Another emerging topic in the study of lexical representation is the distributional semantic model (DSM) [30–32] (also known as a vector space model). Since Landauer et al. [33] pub-lished their seminal study on latent semantic analysis (LSA), the DSM framework has been extensively studied as a computational or cognitive model of human semantic memory. In DSMs, the lexical meaning of a word is represented by a high-dimensional vector in a semantic space, and the degree of semantic relatedness between any two words can easily be computed from their vectors. Word vectors are constructed from a corpus by observing distributional sta-tistics of word occurrence. DSMs have been demonstrated to explain a number of cognitive phenomena relevant to semantic knowledge or the mental lexicon such as similarity judgment [33,34], semantic priming [35], visual attention to semantically relevant objects [36], and embodiment [37,38]. The primary advantage of DSMs is that, despite their simplicity, they are very useful for a variety of applications in not only cognitive modeling but also natural lan-guage processing; hence, an increasing number of studies have focused on DSMs and proposed a variety of new methods for constructing word vectors.
interest in word association and the lexical structure of language. It is quite important in the study of DSMs to examine whether they exhibit the same network properties as observed in the analysis of word association and other language networks. In so doing, network analysis can provide evidence for (or against) the validity of DSMs as a cognitive model of semantic mem-ory or the mental lexicon.
One notable exception is the study by Steyvers and Tenenbaum [21], which investigated whether LSA [31,33], one of the most popular versions of DSMs, exhibits the same network structure as word association. They found that LSA networks were small-world, but not scale-free. A subsequent study by Griffiths et al. [39] obtained the same result; the scale-free property of word association is difficult to reproduce in LSA, although it is appropriately simulated by the topic model based on latent Dirichlet allocation. From these results, they concluded that LSA is limited as a model of human semantic memory. However, their findings do not imply that DSMs generally fail to model semantic memory, because a variety of methods for con-structing semantic spaces other than LSA are devised in the DSM framework [30,32]. Further-more, as Morais et al. [29] pointed out, their analysis of the scale-free property was quite subjective in that their claim of power-law behavior was derived solely from the observation of the behavior of distribution without any statistical testing.
Therefore, in this paper, we analyze the small-world, scale-free, and hierarchical properties of semantic networks constructed from various DSMs in a more systematic way to determine whether DSM networks exhibit the same properties as association networks. Through this net-work analysis, we investigate whether DSMs can provide a psychologically plausible model of semantic memory. Furthermore, we explore quantitative variations in these network properties among various DSM implementations and attempt to explain or predict them in terms of the intrinsic features and functions of DSM methods for constructing semantic spaces. In doing so, we expect network analysis to provide a new way of analyzing the properties and structures of semantic spaces created by DSMs.
In this paper, we also discuss a growing network model that produces a semantic network with the observed network properties. Steyvers and Tenenbaum [21] proposed a network model, based on the Barabási–Albert model [40] for generating scale-free networks, that simu-lates the scale-free and small-world properties of word association networks. Their model is characterized by the process of semantic differentiation, an extension of preferential attach-ment in the Barabási–Albert model. During the process of network growth a new node is con-nected, not to a node chosen with probability proportional to the number of connections for a node, but to the neighbors of the chosen node. Although the process of semantic differentiation enables the network model to simulate small-world properties, the authors’evaluation of their model is not sufficient to justify the ability of the model to reproduce the scale-free property of real semantic networks. Additionally, their model does not have enough flexibility to reflect behavioral diversity of real semantic networks.
Analysis of Word Association Network
Before examining the network properties of DSM networks, we confirm whether our network analysis replicates the properties of a word association network demonstrated by previous studies.
Materials and Methods
We used the English word association norm collected at the University of South Florida (USF) [24], which has also been used in previous studies on association networks. Following these studies, we constructed a directed network as follows. First, only cue words were represented as nodes (i.e., words that appeared only as an associate were not considered). Second, two word nodesxandywere connected by a directed edge fromxtoy, if the wordywas listed as an asso-ciate of cuexby at least two of the participants in the association experiment. We also gener-ated an undirected network by replacing directed edges with undirected ones.
We then analyzed the properties of the word association network according to the method described below. Following existing studies on word association networks [21,29], we restricted the analyses in this paper to the largest connected component. For the small-world property, we computed the clustering coefficientCand the average shortest path lengthLof a generated network, and examined whether the network satisfiesCCrandomandLLrandom (whereCrandomandLrandomare the clustering coefficient and average shortest path length of the corresponding random network, respectively) [42].
For the scale-free property, we examined whether the degree distribution of the target net-work follows the power lawP(k)*k−α. This was carried out not only by observing the shape of the plotted distribution, but also by applying Clauset et al.’s [43] statistical framework for testing the goodness-of-fit between the data and the power law. In their framework, the power-law distribution is fitted to the data (i.e., plotted distribution) and the power-power-law exponentαis estimated using maximum likelihood estimation. This fitting procedure assumes some lower boundkminto the power-law behavior, for an empirical reason that most naturally occurring distributions only follow a power-law distribution above some lower bound. The lower bound
kminis identified by minimizing the Kolmogorov–Smirnov distanceDKSbetween the data and the theoretical power-law fit. In this study, to avoid generating a biased estimate by excluding many legitimate data points, we estimated the optimalkminwithin the rangekmin50. The goodness-of-fit test was conducted by empirically estimating the probabilitypthatDKSfor the observed data is smaller than that for synthetic data randomly drawn from the power-law dis-tribution that best fits the observed data. In other words,pdenotes the probability of obtaining the observed data under the null hypothesis that the data follow the estimated power-law model. Ifpis small, the null hypothesis is rejected. Clauset et al. [43] suggested that the power law is a plausible hypothesis ifp>0.1; we also used this criterion.
We also compared the estimated power-law model with two alternative models, namely the truncated power-law distributionP(k)*k−αe−λk, and the exponential distributionP(k)*e−λk. These two distributions are frequently observed in many real systems whose degree distribu-tions do not follow the power law [44]. Selection among these three models was conducted using 10-fold cross-validation. Each model was fitted to the training data by maximum likeli-hood estimation and its prediction error for the test data was estimated by a log-likelilikeli-hood. Note that, for the statistical testing described here, we employed a Python package powerlaw [45].
However, for non-hierarchical networks, the clustering coefficientC(k) of a node is independent of its degreek. According to this finding, we examined the correlation between the local cluster-ing coefficientC(k) and degreekon a log-log plot and a hierarchical exponentβfor target net-works. The hierarchical exponentβfor many hierarchical networks is almost equal to 1; however, some studies [46,49,50] suggest thatβ= 1 is neither a sufficient nor necessary condi-tion for a network to be hierarchical. The scaling law withβ<1 also indicates the hierarchical topology of the network.
Results
Table 1shows the network statistics for the USF association network and their corresponding random graphs. These random graphs were generated by randomly rearranging connections in the corresponding association networks. The values ofLrandomandCrandomwere computed by averaging over 10 random graphs. The association network has a small-world structure because
CCrandomandLLrandom. This result is completely consistent with existing findings on the analysis of association networks [21,25,27–29].
Regarding the scale-free property of the association network,Fig 1a and 1bplot the in-degree distribution of the directed association network and its cumulative distribution. These graphs show that the distributions deviate from the pure power law, as argued by Morais et al. [29]. The goodness-of-fit test for the best-fit power-law model (α= 2.91,kmin= 35) indeed ruled out the possibility of the pure power law,DKS= 0.048,p= .01. Furthermore, the model selection procedure using 10-fold cross-validation indicated that the truncated power law (i.e., the power law with an exponential cutoff) was selected as the model that best fits the observed distribution (average log-likelihood:−176.41 for the power law,−175.60 for the truncated
power law, and−176.63 for the exponential). These results are completely consistent with the
findings of Morais et al. [29]. It should be noted that, in this paper, we address only the in-degree distribution to examine the scale-free property of semantic networks, because using the out-degree or the degree of the undirected network would introduce bias that stems from the task characteristics such as the number of associations [25].
Comparison of the estimated power-law exponentαin this and other studies also suggests that the truncated power law better describes the in-degree distribution in the USF association network. The estimated exponent isα= 2.91 in this study andα= 2.92 in that by Morais et al. [29], but these values are higher than those of other studies claiming the pure power-law fit (e.g.,α= 1.79 [21],α= 2.03 [39], andα= 2.13 [25]). Interestingly, our estimate ofαfor the truncated power-law distribution is 1.78, which is close to their estimates of the pure power law.
We also applied the fitting procedure to the observed in-degree distribution belowkmin(= 35). This analysis is motivated by the existing finding that some semantic networks obey the power law with initial exponential decay [51]. The result is that the exponential distribution with
Table 1. Statistics of the semantic network (n= 5,018) constructed from the University of South Florida (USF) association norms.
m nCC hki kmax D L Lrandom C Crandom
Directed 63,620 4,845 12.7 313 10 4.26 3.64 0.187 0.005
Undirected 55,236 5,018 22.0 330 5 3.04 3.03 0.187 0.005
Note. n= number of nodes;m= number of edges;nCC= number of nodes of the largest (strongly) connected component;hki= average node degree;
kmax= maximum node degree;D= diameter of the network;L= average shortest path length;Lrandom= average shortest path length of the random
network with the same size and density;C= clustering coefficient;Crandom= clustering coefficient of the random network with the same size and density.
λ= 0.124 best fits the data (average log-likelihood:−1375.49 for the power law,−1372.28 for the
truncated power law, and−1333.30 for the exponential).Fig 1cshows that this exponential fit
appears to be the case:P(k) decreases roughly linearly with the degree on the semilogarithmic (i.e., log-linear) scale, and the slope of the red line is equal toλloge.
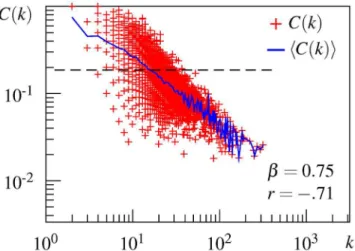
Finally, to examine whether a hierarchical structure is involved in the association network, a local clustering coefficientC(k) is plotted against the degreekon a logarithmic scale, as shown inFig 2. This plot is derived from the undirected version of the largest strongly connected com-ponent of the directed USF network.Fig 2shows that the USF association network has a hierar-chical structure. The local clustering coefficientC(k) of a node is negatively correlated with its degreekon a log-log plot (r=−.71). The dependency is linearly fitted in a log-log plot, as
indi-cated by the blue line connecting the average of local clustering coefficients across points with the same degree. The estimated slopeβ= 0.75 is smaller than 1, but, interestingly, the maxi-mum value ofC(k) follows the line withβ= 1.02. This result indicates that hierarchical modu-larity exists in the USF association network.
Fig 1. Degree distributions of the directed University of South Florida (USF) association network.(a) in-degree distribution, (b) cumulative in-degree distribution, (c) degree distribution belowkminon a semilogarithmic scale.
doi:10.1371/journal.pone.0136277.g001
Fig 2. Local clustering coefficient as a function of the node degree for the USF network.Red plots
denote the local clustering coefficient of an individual node, the blue line connects the average local clustering coefficient with the same degree, and the dashed line denotes the clustering coefficientC.β= the hierarchical exponent,r= the correlation coefficient betweenC(k) andk.
Analysis of DSM Networks
Materials and Methods
To compare DSM networks directly with the USF association network, we used only the cue words of the USF association norm when creating the DSM networks. As a corpus for DSMs, we used the written and non-fiction parts of the British National Corpus, comprising 491,106 documents, 73,422 distinct words, and 4,702 cue words.
We created a semantic network from a given semantic space by first computing the cosine similarity between pairs of words and then determining local neighborhoods using cosine simi-larity. Local neighborhoods were determined by two methods, namely thek-nn method and the
cs-method. Thek-nn method was used by Steyvers and Tenenbaum in their study [21], while thecs-method was devised in this study. Although both methods create directed edges from each word to its nearest neighbors, they differ in the way that the number of nearest neighbors is determined for each word. In thek-nn method, the number of neighbors for wordwiis set to the number of associates of that word in the USF association norms. Therefore, the out-degree distribution of a DSM network is identical to the out-degree distribution of the USF association network. In thecs-method, the number of neighbors for wordwiis determined to be the smallest
k¼ jVN
i jsuch that the cumulative similarity ratio ofViNexceeds the thresholdR:
P
wj2ViNcosðwi;wjÞ
P
wj2Vcosðwi;wjÞ
>R ð1Þ
whereVN
i is the set ofknearest neighbors ofwi,Vis the set of all words exceptwi, andcos(wi, wj) is the cosine similarity between wordswiandwj. The thresholdRwas determined such that the created DSM network has the samehkias in the directed association network. Note that Steyvers and Tenenbaum [21] also used theε-method, in which local neighborhoods are com-puted by thresholding the cosine similarity; that is, any pair of words whose cosine value is equal to or higher than thresholdεis connected by an undirected edge. However, the symmetric nature of this method is not appropriate for modeling semantic knowledge underlying word association. In human word association, having wordxas an associate of cue wordydoes not imply thatyis an associate ofx, but theε-method cannot capture this difference. Therefore, we did not use theε-method in this paper.
In the DSM framework, semantic spaces are constructed according to the following three steps [32].
1. Initial matrix construction:A word-context frequency matrixAis constructed withnw rows for words andnccolumns for the contexts. An elementaijofAis the frequencyfijof wordwiin a contextcj; hence, thei-th row corresponds to the initial word vector for thei-th wordwi.
2. Weighting:The elements of the matrixAare weighted.
3. Smoothing:The dimensionncof the row vectors ofAis reduced tonr.
In Step 2, we employed two popular weighting methods, tf-idf and ppmi. In the tf-idf weighting scheme, the weight is calculated as the product of the local weight based on the term frequency and the global weight based on the inverse document frequency or entropy. In this paper, we used the following function (i.e., the product of the logarithm of the word frequency and the entropy) [52,53]:
aij¼ logðfijþ1Þ 1þ
Pnc
k¼1PiklogPik
lognc
ð2Þ
Pij¼ fij
Pnc
k¼1fik
ð3Þ
whereaijis a weighted element for wordwiin contextcj. In the ppmi weighting scheme, weight
aijis calculated by pointwise mutual information defined inEq 5, and negative values are replaced with zero [34].
aij¼
pmiij ðif pmiij>0Þ
0 ðotherwiseÞ
ð4Þ
(
pmiij ¼ log pij pipj
pij ¼
fij
Pnw
i¼1 Pnc
j¼1fij
pi ¼
Pnc
j¼1fij Pnw
i¼1 Pnc
j¼1fij
pj ¼
Pnw
i¼1fij
Pnw
i¼1 Pnc
j¼1fij
ð5Þ
In Step 3, matrix smoothing was conducted using singular value decomposition (SVD). In this study, we setnr= 300, which is also used in typical applications of LSA.
Using the methods explained above, we created 24 DSM networks from all possible combi-nations of the two methods for determining neighborhoods (k-nn orcs-method), two initial matrices (word-document or word-word), three weighting options (tf-idf, ppmi, or
unweighted), and two smoothing options (SVD or unsmoothed). Note that LSA, which was used by Steyvers and Tenenbaum [21] to construct semantic spaces, corresponds to the combi-nation of a word-document matrix, tf-idf weighting, and SVD smoothing. We then analyzed the properties of these DSM networks according to the method described in the Analysis of Word Association Network section.
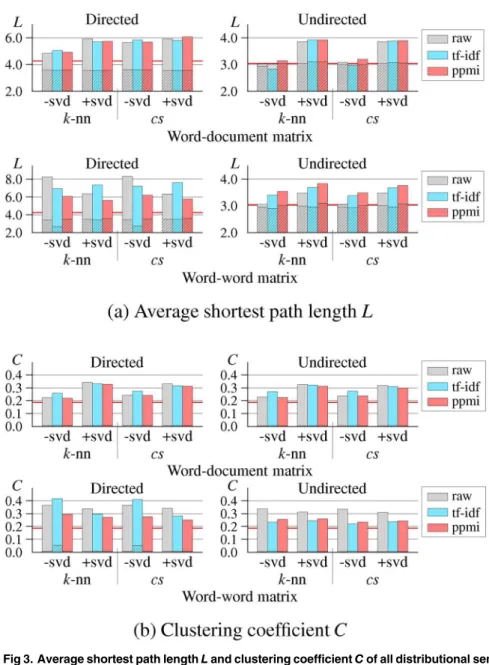
Results for Small-world Property
networks, these results clearly indicate that all the DSM networks have a small-world structure (i.e., high clustering coefficient, small shortest path length, and high connectivity).
Results for Scale-free Property
In this section, we first discuss the overall results of the statistical analysis (i.e., the goodness-of-fit test for the power law and model selection by 10-fold cross-validation) for all the DSM networks. Thereafter, we provide a more detailed analysis of the scale-free property of DSM networks by observing their in-degree distributions. We first compare the in-degree distribu-tions for two types of initial matrices and then examine the effect of weighting and smoothing on power-law behavior.
Overall result. Table 3shows the results of statistical testing of all the DSM networks. The symbols for each code are divided into two parts. The first symbol (+or-) denotes the result of the goodness-of-fit test for the power law, where+denotes that the pure power law is a plau-sible hypothesis for the data and-indicates that it can be ruled out. The subsequent symbols (any ofP,T, andE) denote the most appropriate distributions selected by 10-fold cross-valida-tion. SymbolsP,T, andEdenote, respectively, that the power law, truncated power law, and exponential are selected as the distribution with the best fit. If multiple models have equal
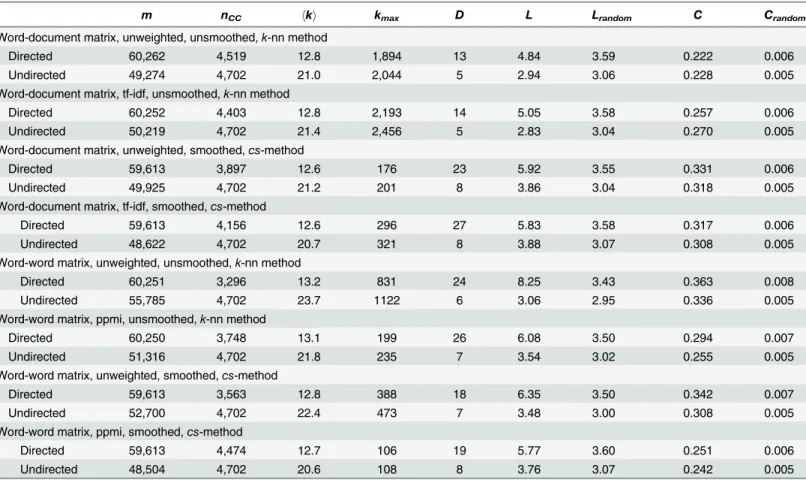
Table 2. Statistics for some representative examples of distributional semantic model (DSM) networks (n= 4,702).
m nCC hki kmax D L Lrandom C Crandom
Word-document matrix, unweighted, unsmoothed,k-nn method
Directed 60,262 4,519 12.8 1,894 13 4.84 3.59 0.222 0.006
Undirected 49,274 4,702 21.0 2,044 5 2.94 3.06 0.228 0.005
Word-document matrix, tf-idf, unsmoothed,k-nn method
Directed 60,252 4,403 12.8 2,193 14 5.05 3.58 0.257 0.006
Undirected 50,219 4,702 21.4 2,456 5 2.83 3.04 0.270 0.005
Word-document matrix, unweighted, smoothed,cs-method
Directed 59,613 3,897 12.6 176 23 5.92 3.55 0.331 0.006
Undirected 49,925 4,702 21.2 201 8 3.86 3.04 0.318 0.005
Word-document matrix, tf-idf, smoothed,cs-method
Directed 59,613 4,156 12.6 296 27 5.83 3.58 0.317 0.006
Undirected 48,622 4,702 20.7 321 8 3.88 3.07 0.308 0.005
Word-word matrix, unweighted, unsmoothed,k-nn method
Directed 60,251 3,296 13.2 831 24 8.25 3.43 0.363 0.008
Undirected 55,785 4,702 23.7 1122 6 3.06 2.95 0.336 0.005
Word-word matrix, ppmi, unsmoothed,k-nn method
Directed 60,250 3,748 13.1 199 26 6.08 3.50 0.294 0.007
Undirected 51,316 4,702 21.8 235 7 3.54 3.02 0.255 0.005
Word-word matrix, unweighted, smoothed,cs-method
Directed 59,613 3,563 12.8 388 18 6.35 3.50 0.342 0.007
Undirected 52,700 4,702 22.4 473 7 3.48 3.00 0.308 0.005
Word-word matrix, ppmi, smoothed,cs-method
Directed 59,613 4,474 12.7 106 19 5.77 3.60 0.251 0.006
Undirected 48,504 4,702 20.6 108 8 3.76 3.07 0.242 0.005
Note. n= number of nodes;m= number of edges;nCC= number of nodes of the largest (strongly) connected component;hki= average node degree;
kmax= maximum node degree;D= diameter of the network;L= average shortest path length;Lrandom= average shortest path length of the random
network with the same size and density;C= clustering coefficient;Crandom= clustering coefficient of the random network with the same size and density.
average log-likelihoods rounded to one decimal place, all the corresponding symbols are listed in the order given above. Details of the statistical tests are given inS2 Table.
Code+Pindicates that a pure power-law distribution is definitely the most appropriate, while codes+PTand+PTEindicate that a pure power law is very likely to be most appropriate. Conversely, codes-T,-TE, and+Tindicate that a truncated power-law degree distribution is most appropriate, although in the case of-TE, an exponential distribution cannot be ruled out. Other possible code patterns are not obtained for DSM networks. Note that the test result for the USF association network is coded as-T, which favors a truncated power law.
Overall,Table 3shows that all the DSM networks exhibit a power-law or a truncated power-law distribution; 13 networks are coded as+P,+PT, or+PTEin favor of the pure power law, and the remaining 11 networks are coded as-T,-TE, or+Tin favor of the truncated power law. In addition, we also analyzed the observed in-degree distribution below the lower
Fig 3. Average shortest path lengthLand clustering coefficientCof all distributional semantic model
(DSM) networks.The hatched part of each bar graph representsLrandomandCrandom.
boundkminusing the same procedure as in the analysis of the word association network. The result is that, for all 24 DSM networks, the exponential distribution is a significantly better fit for the data belowkminthan both the pure and truncated power laws. These results provide direct evidence against Steyvers and Tenenbaum’s [21] argument that LSA networks do not have a power-law distribution, and thus, LSA cannot provide a plausible model of semantic memory. Instead, the results indicate that a DSM has the ability to produce semantic networks with a degree distribution that is the same as or similar to that of the association network. Hence, network analysis also confirms that a DSM can provide a psychologically plausible framework for modeling human semantic memory.
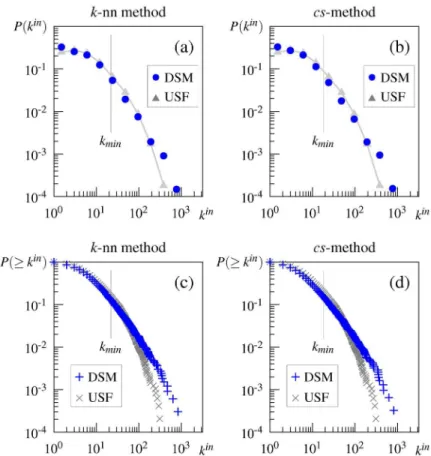
Comparison of initial frequency matrix. As shown inFig 4(and in the second column
+TofTable 3), the in-degree distributions of the DSM networks generated from the initial word-word matrix follow the truncated power-law degree distribution. These distributions are similar to, but less truncated than the distribution of the USF association network.
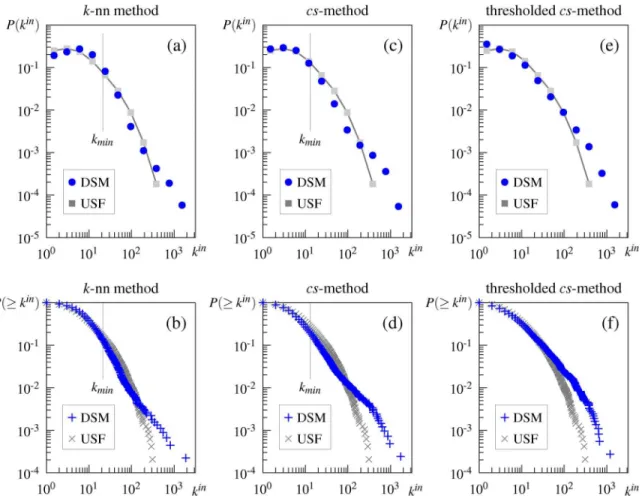
In contrast, as shown inFig 5a–5d, the shape of the degree distributions of the DSM net-works generated from the word-document matrix differs from both the distribution of the association network and the pure power law; the distributions decay exponentially for smallk, but the decay suddenly decreases in a linear fashion, which is unlikely to be observed in real-world systems. Although the second column ofTable 3indicates that a pure or truncated power law is favored over an exponential one, the shape obviously differs from these three distributions.
One probable explanation for these unnatural distributions is that, owing to its high spar-sity, the word-document matrix may generate inappropriate DSM networks, whereby word pairs with very low cosine similarity are connected by edges. In general, a word-document matrix is sparser than a word-word matrix generated from the same corpus; the percentage of zero elements was 99.36% for the word-document matrix used in this study, and 78.84% for the word-word matrix. The high sparseness of the word-document matrix leads many word pairs to have very low cosine similarity. Indeed, in the word-document-based DSM network by thecs-method, about half the word pairs connected by an edge had a cosine of 0.05 or less. These low-cosine word pairs must be chosen for an edge such that the DSM network has the same average degree as the association network. It is appropriate for word pairs that are some-what related to be connected by an edge. However, despite being semantically unrelated, many other pairs are chosen because they have low cosine values by chance. In this case, more fre-quent words tend to have a low, but non-zero cosine similarity to more unrelated words, because they have more non-zero elements in their vector representation. The fatter tail
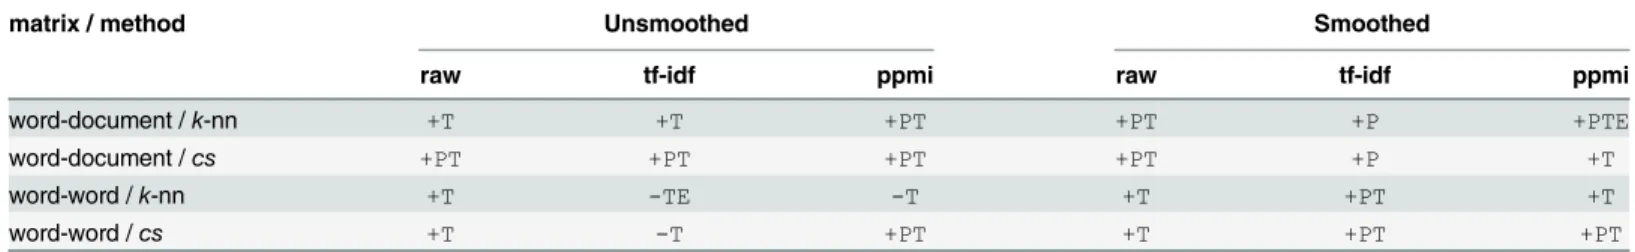
Table 3. Summary of statistical testing for power-law behavior of in-degree distributions of directed DSM networks.
matrix / method Unsmoothed Smoothed
raw tf-idf ppmi raw tf-idf ppmi
word-document /k-nn +T +T +PT +PT +P +PTE
word-document /cs +PT +PT +PT +PT +P +T
word-word /k-nn +T -TE -T +T +PT +T
word-word /cs +T -T +PT +T +PT +PT
Note.Codes used in this table start with a symbol denoting the result of the goodness-of-fit test for the power law, followed by one to three symbols denoting the result of model selection by 10-fold cross-validation. Symbol+denotes that the power lawfits the data, while symbol-denotes that the power law is ruled out. SymbolsP,T, andEdenote that the power law, truncated power law, and exponential, respectively, are selected as the bestfitting distribution. When more than one symbol is presented as the result of model selection, it means that the average log-likelihoods of these models, rounded to one decimal place, are equal.
observed in the degree distribution for the word-document matrix may be a consequence of this frequency effect; some frequent words are connected by a large number of edges. Hence, if a network is created by thresholding the cosine similarity of word pairs, it is expected that its degree distribution approaches the (truncated) power law. Indeed, as shown inFig 5e and 5f, the degree distribution of the network we created using thecs-method by limiting word pairs to be joined by an edge to those with the cosine greater than 0.05, followed the truncated power law. The same result was obtained in networks created using thek-nn method.
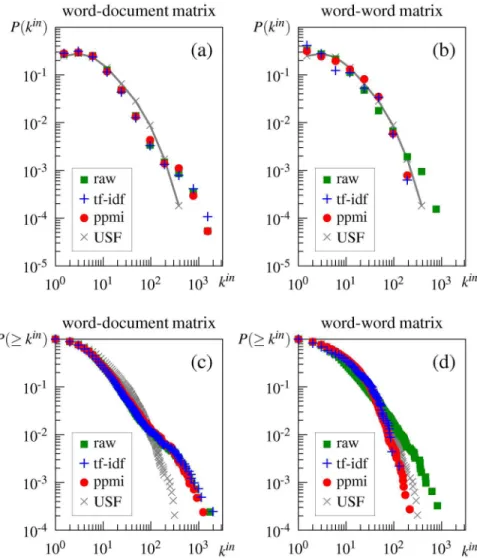
Effect of weighting. Weighting does not change the unnatural degree distribution observed in the word-document-based networks, as shown inFig 6a–6c, and in the third and fourth columns ofTable 3. (Note thatFig 6shows only the distributions for DSM networks generated by thecs-method. The results of the DSM networks generated by thek-nn method are shown inS1 Fig, but do not differ from the results of thecs-method.)
However, in the case of the word-word matrix, weighting alters the degree distribution; both tf-idf and ppmi weighting change the degree distribution into a more truncated form (i.e., with a sharper cutoff) whose curve is more similar to that of the association network, as shown inFig 6b–6d.Table 3(i.e., codes-Tand-TEin the third and fourth columns) shows that the distribu-tions are no longer plausible power laws and follow the truncated power law, although a pure power law is most plausible for the network generated by thecs-method with ppmi weighting.
Fig 4. In-degree and cumulative in-degree distributions of the DSM network generated from the initial word-word matrix.(a) in-degree distribution of the DSM networks generated by thek-nn method, (b) in-degree distribution of the DSM networks generated by thecs-method, (c) cumulative in-degree distribution of the DSM networks generated by thek-nn method, (d) cumulative in-degree distribution of the DSM networks generated by thecs-method. DSM = DSM network, USF = USF association network.
The obtained result can be explained by the role of weighting in constructing word vectors. The role of weighting is to assign a greater weight to unexpected events, that is, contexts that are more significantly associated with to a target word, and a smaller weight to expected events [32]. For example, frequent words are likely to occur in a context even if they are not semanti-cally associated with that context. Weighting downplays these expected events to compute the similarity between two word vectors correctly. Conversely, weighting highlights those contexts in which a word occurs more often than would be expected by chance. This function of weight-ing also makes word vectors semantically more appropriate, and as a result, semantically related words are more likely to be connected by an edge in the DSM networks generated from the word-word matrix. However, weighting does not work as a method for reducing the spar-sity of a matrix; instead, sparspar-sity is often increased. Because the sparspar-sity of the word-document matrix is the main cause of the unnatural degree distribution of its DSM networks as men-tioned previously, weighting does not remedy the problem and the DSM networks generated from the weighted word-document matrix still exhibit the unnatural distribution.
Effect of smoothing. SVD smoothing alters the degree distributions of DSM networks with both types of context. The smoothed word-document matrix yields a scale-free network whose degree distribution follows the pure power law above some lower bound, although it
Fig 5. In-degree and cumulative in-degree distributions of the DSM network generated from the initial word-document matrix.(a) in-degree
distribution of the DSM networks generated by thek-nn method, (b) cumulative in-degree distribution of the DSM networks generated by thek-nn method, (c) in-degree distribution of the DSM networks generated by thecs-method, (d) cumulative in-degree distribution of the DSM networks generated by thecs -method, (e) in-degree distribution of the DSM networks generated by the thresholdedcs-method, (f) cumulative in-degree distribution of the DSM networks generated by the thresholdedcs-method. DSM = DSM network, USF = USF association network.
exhibits slightly unusual behavior for smallk, as shown inFig 7a. (Fig 7shows the result for the network generated from the tf-idf-weighted word-document matrix by thecs-method, but this does not differ from the results of the unweighted and ppmi-weighted matrix and those of the networks generated by thek-nn method. For these results, seeS1 Fig)
In the case of the word-word matrix, SVD smoothing also affects the DSM network such that its degree distribution takes a more truncated form. As a result, the DSM network based on the unweighted word-word matrix follows almost the same truncated power-law distribu-tion as the USF associadistribu-tion network, as shown inFig 7b. The DSM networks based on the weighted matrix exhibit a power-law distribution above a high lower bound, as shown inFig 7c and indicated by+PTin the last two columns ofTable 3.
The obtained result is likely due to the functions of SVD smoothing, namely sparsity reduc-tion and discovery of latent meanings. For the word-document matrix, its sparsity is greatly
Fig 6. In-degree and cumulative in-degree distributions of the DSM networks generated from different
weighting schemes by thecs-method.(a) in-degree distribution of DSM networks generated from the
word-document matrix, (b) in-degree distribution of DSM networks generated from the word-word matrix, (c) cumulative in-degree distribution of DSM networks generated from the word-document matrix, and (d) cumulative in-degree distribution of DSM networks generated from the word-word matrix. raw = unweighted DSM, tf-idf = DSM with tf-idf weighting, ppmi = DSM with ppmi weighting, USF = USF association.
reduced by SVD smoothing and the resulting DSM network exhibits a power-law degree distri-bution in the same way as other DSM networks. For the word-word matrix, the structure of DSM networks may be influenced by latent meanings that cannot be directly derived from the unsmoothed matrix but can be discovered by SVD smoothing. Despite being actually semanti-cally related, two words that do not cooccur in any context are computed as completely unre-lated by the unsmoothed DSM. Using SVD smoothing to overcome this difficulty, semantically
Fig 7. In-degree and cumulative in-degree distributions of some DSM networks generated after and before singular value decomposition (SVD)
smoothing by thecs-method.+SVD = smoothed DSM,−SVD = unsmoothed DSM, USF = USF association.
doi:10.1371/journal.pone.0136277.g007
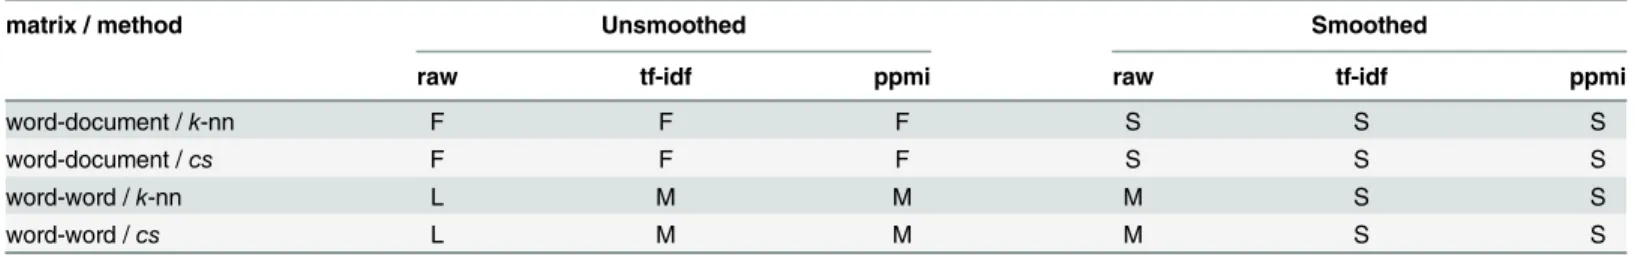
Table 4. Type of power-law behavior of in-degree distribution of DSM networks.
matrix / method Unsmoothed Smoothed
raw tf-idf ppmi raw tf-idf ppmi
word-document /k-nn F F F S S S
word-document /cs F F F S S S
word-word /k-nn L M M M S S
word-word /cs L M M M S S
Note.L: less truncated power law, M: moderate truncated power law similar to that of the USF network, S: power law with a steep power-law slope, F: power law with an unnatural, fat tail.
related words are likely to be computed correctly and the resulting DSM network captures human semantic knowledge more accurately.
Summary. According to the behavior of the USF association network, the power-law behavior of degree distributions of DSM networks can be categorized into the following four types.
Table 4shows the result of categorization of all DSM networks.
• Moderate truncated power law (Type M): This type of distribution follows the truncated power law exhibited by the USF association network. In other words, Type M distributions are highly similar or almost identical to the distribution of the USF association network. The distribution of the DSM network for the unweighted and smoothed word-word matrix (the red plot inFig 7b) is a typical example of Type M.
• Less truncated power law (Type L): This type of distribution follows a less truncated power law (or seemingly moderate power law) than the distribution of the USF network. The distri-bution of the DSM network for the unweighted and unsmoothed word-word matrix (Fig 4) is a typical example of Type L.
• Steep power law (Type S): This type of distribution follows a power law above a lower bound, but its power-law slope is steeper than those of other classes of distributions (i.e., the expo-nentα>4). Distributions of the DSM networks based on the tf-idf-weighted and smoothed word-document matrix (the red plot inFig 7a) and the ppmi-weighted and smoothed word-word matrix (the red plot inFig 7c) are typical examples of Type S.
• Power law with an unnatural, fat tail (Type F): This type of distributions seems to follow a power law, but exhibits an unnatural, fat tail for largek, owing to the data sparseness of the initial DSM matrix. The distribution of the DSM network for the unweighted and
unsmoothed word-document matrix (Fig 5a–5d) is a typical example of Type F.
As shown inTable 4, the behavior of the degree distribution of DSM networks differs greatly between the word-document matrix and the word-word matrix, although it does not depend on the methods for weighting (tf-idf, ppmi) and neighborhood determination (k-nn,cs). Owing to its data sparseness, the unsmoothed word-document matrix creates semantic net-works of Type F. SVD smoothing compensates for the lack of information due to data sparse-ness, thus leading to scale-free DSM networks of Type S. On the other hand, the unsmoothed word-word matrix creates a network of Type M or Type L, which exhibits a truncated power-law degree distribution. When DSMs are smoothed, their networks exhibit more truncated dis-tributions, becoming Type S or Type M networks.
Results for Hierarchical Property
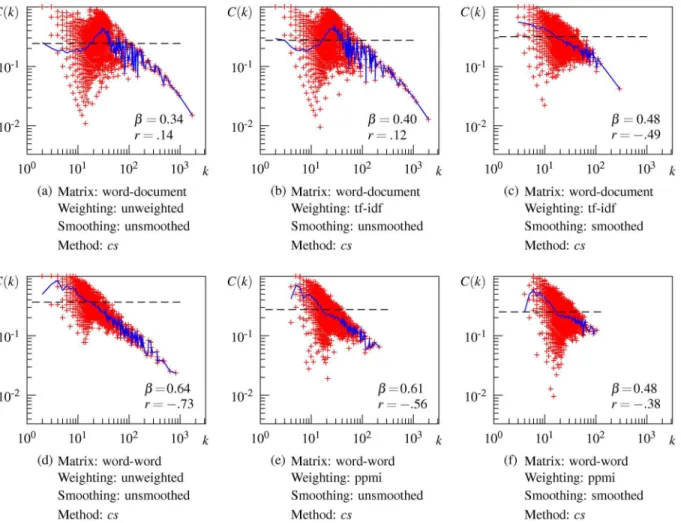
Fig 8shows the correlation between the local clustering coefficientC(k) and degreekon a log-log plot for some DSM networks. (The correlation for all 24 DSM networks is depicted inS2 Fig)
hierarchical modularity in the same way as the USF association network (seeFig 8d). The cor-relation betweenC(k) andkis negative and strong (r=−.73) and the averageC(k) follows the
power law, although the hierarchical exponentβis less than that of the USF association net-work. The ppmi weighted word-word matrix also generates a hierarchically structured network as shown inFig 8e. These results indicate that unsmoothed word-word-based DSM networks are organized hierarchically.
SVD smoothing works differently for word-document-based and word-word-based net-works. When the word-document matrix is smoothed,C(k) is moderately correlated with
k(r=−.49) and the averageC(k) follows a power law with a small exponentβ, thus suggesting
that a hierarchical structure seems to emerge in the resulting DSM network (Fig 8c). In con-trast, when the word-word matrix is smoothed, the correlation betweenC(k) andkbecomes weaker andC(k) no longer follows a power law in the resulting DSM network (Fig 8f). This result suggests that the hierarchical modularity tends to collapse partially by smoothing the word-word matrix. As a result of smoothing, DSM networks generated by both types of matri-ces exhibit a similar hierarchical structure.
Despite these differences in power-law behavior ofC(t) among the DSM networks, theC(t) plots for all DSM networks share some characteristics. The local clustering coefficientC(k)
Fig 8. Local clustering coefficient as a function of the node degree for some representative DSM networks.Red plots denote the local clustering
coefficient of an individual node, the blue line connects the average local clustering coefficient with the same degree, and the dashed line denotes the clustering coefficientC.
diverges around thek*101region and the average of this region characterizes the clustering coefficientCof the whole network, as indicated by the intersection of the dashed line with the blue line in this region inFig 8. The wider divergence ofC(k) in this region implies that some nodes are part of densely interlinked clusters, while other nodes are outside of these clusters despite having a considerable number of connections. This is the main cause of non-hierarchy in the word-document-based DSM networks shown inFig 8a and 8b. At the same time, all the networks share the behavior of theC(k) curve, that is, for nodes with largekabove this region,
C(k) decreases linearly withk. Neighbors of hub nodes (i.e., highly connected nodes) have a small chance of being linked to one another, and thus hub nodes connect distant clusters and other groups of nodes that do not form clusters. This implies that hub nodes occur at a higher level in the hierarchical structure of the network. From these common characteristics, we can reasonably assume that DSM networks consist of a mixture of hierarchical modules and a non-hierarchical set of nodes. The observed difference in power-law behavior ofC(k) among the DSM networks may reflect the relative proportion of nodes in the hierarchical modularity. What these results imply about the semantic properties involved in the semantic network is explained in the next section.
Dynamics of DSM Networks
In the last section, we demonstrated that, in general, some DSMs can generate semantic net-works with the same scale-free and hierarchical properties as the association network, and in particular, DSM networks have different degree distributions and hierarchical structures depending on the way their semantic spaces have been constructed. Two questions that natu-rally arise and must be addressed are how the structure of these semantic networks emerges and what structural factors govern the different behaviors of DSM networks. In this section, we attempt to provide a probable answer to each of these questions in terms of semantic relations between connected word nodes. We propose that distinction of the two types of semantic rela-tions, namely, syntagmatic and paradigmatic relarela-tions, is a key factor in explaining the struc-ture and dynamics of semantic networks. The distinction of semantic relations has not been addressed in existing studies on network analysis of semantic networks; thus, we argue that this study can shed new light on the structure and dynamics of semantic networks.
Semantic Relation
The basic premise of semantic networks is that two word nodes are connected by an edge if these words are semantically related. In a word association network [21,29], semantic related-ness between two words is determined according to whether one word is an associate of the other word. In a word cooccurrence network [15,54], it is determined according to the cooc-currence frequency in the text. In a DSM network, it is computed as the cosine similarity between two word vectors in a semantic space. Despite these different approaches to the com-putation of semantic relatedness, the semantic relation that exists between words determined to be semantically related is the same and can be classified into a few types. However, existing network analysis studies on semantic networks do not focus on the type of semantic relations. In lexical semantics [41], semantic relations can be classified into two types:syntagmatic
related and people often associatebathwithtowel. Syntagmatically related words tend to cooc-cur in a noun phrase (e.g.,red rose) or a verb phrase (play soccer), and thus they are likely to belong to different word classes (e.g., noun–adjective, noun–verb). In other words, syntagmati-cally related words are not semantisyntagmati-cally similar, but semantisyntagmati-cally related. On the other hand, two words are paradigmatically related if they do not cooccur but can be substituted for one another; in other words, they cooccur with similar words. For example, two wordsstudentand
pupilare unlikely to cooccur, but they occur in the same context such as“A teacher scolded his [student/pupil] in the classroom,”and thus they are paradigmatically related. Paradigmatic relations tend to be taxonomically or semantically similar by virtue of synonym, antonym or other coordinates, and they belong to the same word class (e.g., noun–noun, verb–verb).
The syntagmatic-paradigmatic distinction, by its definition, is closely related to the way in which contexts are given to construct the initial matrix in the DSM framework [56,57]. Syntag-matic relations are likely to be represented by the use of documents as contexts, in other words by DSMs with the word-document matrix, because two word vectors (i.e., row vectors of the matrix) are more similar if they cooccur in more documents. Paradigmatic relations are likely to be represented by the use of words as contexts, in other words by DSMs with the word-word matrix, because two word vectors are more similar if they share more collocated words. For example,Table 5lists the associates (i.e., out-degree neighbors) of the cue wordslemonand vio-letin the DSM networks based on the initial unsmoothed word-document and word-word matrices, together with the associates in the USF association network. As predicted, more asso-ciates in the word-word-based network are paradigmatically related to the cue words than those in the word-document-based network.
In the next subsection, we explain the results of the hierarchical property for DSM networks obtained in the last section, using the relationship between the syntagmatic-paradigmatic dis-tinction and the DSM matrix.
Hierarchical Structure of Semantic Networks and
Syntagmatic-Paradigmatic Distinction
Syntagmatic and paradigmatic relations play different roles in creating the hierarchical struc-ture of a semantic network. As explained in the previous subsection, paradigmatically related words are taxonomically similar; they are synonyms or coordinated words (i.e., they share a superordinate word), or one word is a hyponym (or superordinate) of another word. Therefore, a semantic network (a word web) created using paradigmatic relations forms a hierarchy of words or their concepts. In cognitive science, this kind of word hierarchy has been proposed
Table 5. List of associates of some cue words with their semantic relations.
Cue Network Associate words (Out-degree neighbors) # of paradigmatic
relation
lemon DSM (word-document) juice, pepper, parsley, grate, sauce, butter, seasoning, onion, chicken, mayonnaise, cook 0 DSM (word-word) orange, carton,lime, seasoning, orange juice,fruit, zest, juice, mayonnaise, tomato, vinegar 3 USF association lime, sour,orange,tree,fruit, yellow, car, lemonade, peel,apple, squeeze 5
violet DSM (word-document) yellow, bloom,flower, summer,blue,green 3
DSM (word-word) pink, pale,purple,yellow,green,red 5
USF association purple,flower, rose,color,blue, fem 3
Note.Bolded words are paradigmatically related to their corresponding cue word. Both DSM networks used in this table are generated from the unsmoothed and unweighted matrix.
for quite some time as a mental representation of semantic memory, such as Collins and Quil-lian’s hierarchical network model [1]. A thesaurus (e.g., Roget’s thesaurus and WordNet [58]) is also a typical example of this kind of word hierarchy. In contrast, syntagmatically related words are not semantically (or taxonomically) similar; they are related by virtue of a relation between a concept and its feature or attribute. For example,“being used after abath”is a fea-ture of atoweland“beingred”is a feature of arose. Syntagmatic relations themselves do not form a hierarchical network because they simply join a concept and its features. Psychological models for semantic memory built primarily on the basis of syntagmatic relations do not have a hierarchical structure. For example, feature models [3,4] argue that a concept (i.e., the mean-ing of a noun) is represented as an unstructured set of features. Hence, syntagmatic relations are likely to make a semantic network less hierarchical.Fig 9shows an example of how a semantic network is organized hierarchically by paradigmatic relations and non-hierarchically by syntagmatic relations. In this figure, a hierarchy such as“animal mammal dog, cat, bear”is formed by paradigmatic relations (denoted by solid lines), while syntagmatic relations (denoted by dashed lines) are not involved in these hierarchical networks.
Considering the relationship of the syntagmatic-paradigmatic distinction to the hierarchical structure of a semantic network and the method used to construct the initial DSM matrix, we can provide a plausible explanation for the results of the hierarchical property of DSM net-works. First, DSM networks generated from the unsmoothed word-document matrix are orga-nized non-hierarchically or less hierarchically, because the word-document matrix is likely to represent syntagmatic relations, which lead to a less hierarchical network. Second, DSM net-works generated from the unsmoothed word-word matrix are organized hierarchically, because the word-word matrix is likely to represent paradigmatic relations, which organize a hierarchi-cal network. Finally, SVD smoothing induces a change in the hierarchy of semantic networks, because it contributes to the discovery of latent meanings. Latent meanings are not explicitly represented by a word-context matrix, and it follows that the smoothed matrix has a greater chance of capturing semantic relations other than those favored by the original matrix.
Fig 9. Illustration of the hypothetical semantic network created by syntagmatic and paradigmatic relations.Solid lines denote paradigmatic relations,
while dashed lines denote syntagmatic relations. The color of a node indicates the word class of the corresponding word (green = noun, yellow = adjective, red = verb).
Therefore, non-hierarchical DSM networks for the word-document matrix become hierarchi-cal, whereas hierarchical DSM networks for the word-word matrix become less hierarchical when the matrices are smoothed.
To confirm that the syntagmatic-paradigmatic distinction really affects the hierarchical structure in semantic networks, we examined the correlation between the degree of network hierarchy and the proportion of edges representing syntagmatic relations. Although there is no widely accepted method to measure the degree of network hierarchy quantitatively, we used a dependency betweenC(k) andk, namely a correlation coefficient betweenC(k) andkon a log-log plot. To estimate the proportion of edges connecting syntagmatically related word nodes, we judged whether each edge was based on a syntagmatic or paradigmatic relation according to two criteria based on WordNet [58]: specific patterns of the subgraph (i.e., network motif) connecting two word nodes and a thesaurus-based similarity between these nodes. Because these criteria are conditions for a paradigmatic relation, a pair of words connected by an edge was judged to be syntagmatically related if neither criterion was satisfied. For example, two words were deemed paradigmatically related if they share a parent node in the WordNet hier-archy (i.e., they are synonyms). Two words were also deemed paradigmatically related if one word node is a child or a grandchild of another word node (superordination), or if the two words do not share a parent node but are very closely positioned in the WordNet hierarchy (coordination). Next, for all 24 DSM networks plus the USF association network, we calculated the correlation coefficient between the correlation coefficient betweenC(k) andkand the pro-portion of syntagmatically motivated edges. If our assumption is correct, the propro-portion of edges connecting syntagmatically related words should be positively correlated with the corre-lation coefficient betweenC(k) andk, because more syntagmatic relations make a semantic network less hierarchical, and less hierarchical networks are assumed to exhibit a weaker nega-tive correlation (and thus a greater neganega-tive value of the correlation coefficient) betweenC(k) andk.
This correlation analysis revealed that there is a significant positive correlation between the proportion of syntagmatically motivated edges and the correlation coefficient betweenC(k) andk,r= 0.482 (n= 25),p<.05. This result clearly indicates that the difference in semantic relations does affect the hierarchical structure of a semantic network; semantic networks in which more paradigmatically related words are connected are likely to exhibit a hierarchical structure.
Network Model and Semantic Development
In this section, we also demonstrate that the syntagmatic-paradigmatic distinction can explain a variety of power-law or truncated power-law distributions revealed by different DSM net-works, by incorporating the syntagmatic-paradigmatic distinction into a growing network model for simulating a semantic network.
Steyvers–Tenenbaum model. Barabási and Albert [40] proposed a simple model for a scale-free network using the mechanism of network growth andpreferential attachment, which leads to the pure power-law degree distribution with an exponent of 3. In this model, a small fully connected network ofM0nodes is initially constructed, and then new nodes are succes-sively added to the network (i.e., network growth). Each new node is connected toM(M0) existing nodes selected with probability proportional to their degrees (i.e., preferential attachment).
differentiation is the process of adding some kind of variation on the meaning of an existing word by a new word, according to the suggestions made by studies on language and conceptual development. Their network model differentiates the meaning of an existing word node by connecting a new node toMrandomly chosen neighbors of the existing node. Steyvers and Tenenbaum [21] demonstrated that the degree distribution of the network generated by this model fits well with the observed distribution of the word association network. However, their model cannot explain the observed difference among distributions of DSM networks, because it does not have sufficient free scaling parameters to generate a variety of pure and truncated power-law distributions.
It should be noted that Steyvers and Tenenbaum [21] provided a more general formaliza-tion of the probabilityPijwith which a particular nodevjis chosen in the neighborhood ofviat Step 2 as given below:
Pij¼ uj
X
vk2Hi
uk
ð6Þ
whereujis the utility of a word ofvj, andHiis a set of neighbors ofvi. They suggested two ways of determining node utilities: utility based on word frequency (uj= log(fj+ 1) wherefjis the fre-quency of a wordvj) and an equal utility (uj= 1/jHij). They reported that these two utility func-tions yielded very similar results for degree distribufunc-tions. Additionally, although they did not describe how the frequency of words in real semantic networks was used to determine the util-ity of nodes in a synthetic network, it is very difficult to determine how this should be done because the order of adding words with different frequencies to the existing network affects the behavior of the resulting synthetic network. For these reasons, in this study we used the equal utility function, thereby assuming that the probability of choosing a neighbor node is uni-formly distributed, as described in the algorithm above.
New network model. We argue that the limitation of the Steyvers–Tenenbaum model can be overcome by assuming that semantic growth cannot be explained solely by the process of semantic differentiation. Obviously, two word nodes connected by semantic differentiation (or preferential attachment) can be regarded as semantically or taxonomically similar (i.e., para-digmatically related), because a new word added to the network by semantic differentiation corresponds to more specific variations on existing words. However, as explained thus far, a new word can be associated with other words by a syntagmatic relation. Furthermore, this pro-cess of acquiring the connections by syntagmatic relations does not nepro-cessarily require prefer-ential attachment, because there is no reason to assume that highly complex concepts (i.e., those with many connections) are likely to be attributes of a new concept. For example, in the USF association norms, the four most listed associates of the cue wordcherryarered,pie,fruit, andapple. The wordsfruitandappleare paradigmatically related tocherry, whileredandpie
are syntagmatically related tocherry. When we consider the situation where a new wordcherry
is added to the network, adding edges fromcherrytofruitandapplemeans thatcherry differen-tiates the concepts offruitandappleby introducing their new subcategories. This acquisition process can be reasonably regarded as semantic differentiation implemented by preferential attachment. On the other hand, adding edges toredandpieis interpreted differently; these edges may be added becausecherryhas the attributes of“being red”and“being an ingredient of a pie”. In this case, it is not reasonable to assume that preferential attachment always governs this process. These edges are added simply becausecherryhas the attributes of“being red”and
this mechanism asexperiential correlation, which is a term borrowed from cognitive linguistics that indicates perceptual correspondences grounded in human embodied experience [59].
To integrate the process of experiential correlation into the Steyvers–Tenenbaum model, we considerrandom attachmentof a new node to the existing nodes. As mentioned above, there is no reason to assume that highly complex concepts with many connections are likely to be attri-butes of a new concept. It can be justified by empirical observation that verb and adjective con-cepts involve much less hierarchical complexity than noun concon-cepts; verb and adjective concepts are represented by fewer levels of hierarchy (generally two) and with fewer distinc-tions at the superordinate level than noun concepts [60]. Furthermore, because it is very diffi-cult to assume a priori information on the attribute of a new concept (e.g., which color is preferentially selected as an attribute of a new object), we apply the principle of indifference to the process of experiential correlation by assuming that the probability of choosing an existing node for experiential correlation is equal over all existing nodes. It should be noted, however, that we do not claim that experiential correlation is never governed by preferential attachment or other network growth processes. We simply argue that random attachment is a plausible assumption when no a priori knowledge is available for node choice for experiential correla-tion. In some cases, preferential attachment may work as a principle of experiential correlacorrela-tion. For example, some adjectives have a more basic, wider meaning than other relevant adjectives (e.g.,redversusreddish).
Liu et al. [61] integrated random attachment into the Barabási–Albert model. In their model, a new node is attached to the existing nodes preferentially with probability 1−por
ran-domly with probabilityp. The resulting network has a degree distribution that follows a mix-ture of power-law and exponential behaviors. Clearly, the distribution completely follows the power law ifp= 0, whereas it follows the exponential ifp= 1. When 0<p<1, the distribution exhibits an approximately exponential behavior for smallk, and a power-law-like behavior for largek. Note that, as mentioned earlier, the degree distribution of the USF association network follows the exponential belowkminand the truncated power law abovekmin. This suggests that both preferential and random attachments may be required for appropriately simulating the behavior of semantic networks.
Following Liu et al.’s model [61], we propose a new network growth model by extending the Steyvers–Tenenbaum model to enable both preferential and random attachments. A new node is attached to the existing network preferentially by semantic differentiation with probability 1−p, and randomly by experiential correlation with probabilityp. For preferential attachment,
nodes connected to a new node are chosen from among only the neighbors of nodevithat were previously added by preferential attachment. In random attachment, nodes are chosen from among all the existing nodes.
A more formal description of the algorithm for connecting a new node toMexisting nodes in our modified Steyvers–Tenenbaum model is given below.
1. Each of theMedges connecting a new node to the existing network is labeled as either
“semantic differentiation”with probability 1−por“experiential correlation”with
probabil-ityp. The resulting numbers of edges labeled as“semantic differentiation”and“experiential correlation”are denoted byMpandMr(=M−Mp), respectively.
3. Mrexisting nodes are chosen randomly (i.e., with equal probability) from all existing nodes, and connected to the new node.
4. The direction of each edge is determined randomly, pointing toward the existing node with probabilityγand toward the new node with probability 1−γ, as in the case in the Steyvers–
Tenenbaum model.
Simulation results. We conducted a simulation experiment modeling the behavior of the USF and DSM networks using the modified Steyvers–Tenenbaum model. As the target for sim-ulation, we considered three representative DSM networks created by thecs-method; these were generated from the tf-idf-weighted and smoothed word-document matrix (corresponding to LSA), the unweighted and unsmoothed word-word matrix, and the ppmi-weighted and smoothed word-word matrix, respectively. These target networks were chosen such that differ-ent types of degree distributions (i.e., Type M, Type L, and Type S) were simulated. As shown inTable 4, the USF association network is of Type M, the two DSM networks generated from the tf-idf-weighted and smoothed word-document matrix and the ppmi-weighted and smoothed word-word matrix are of Type S, and the DSM network generated from the unweighted and unsmoothed word-word matrix is of Type L. DSM networks of Type F were not used in the simulation, because they deviate from naturally occurring semantic networks owing to the unsuccessful construction of word-document-based networks as explained previ-ously. In all the simulations, we setnequal to the number of nodes in the real networks (i.e.,
n= 5,018 for the USF association network andn= 4,702 for the DSM networks). We also set
M= 13 to ensure that the resulting synthetic networks would have approximately the same density as the corresponding real networks.
Two important parameters for the model,pandγ, were set as follows. We determinedp
using the fractionqof edges connecting a pair of syntagmatically related words in the target network and compared three settings:p=q(Model A),p=q/2 (Model B) andp= 0 (Model ST). Model A assumes that all syntagmatic relations are the result of random attachment, while Model B assumes that syntagmatic relations are caused equally by random and preferential attachment. We also consider Model ST, corresponding to the original Steyvers–Tenenbaum model, to compare the simulation performance of the modified Steyvers–Tenenbaum model and the original one. Note that the rationale behind Model B is that some syntagmatic relations may be governed by preferential attachment. As mentioned earlier, some verbs or adjectives are more general than others (e.g.,redversusreddish). Some syntagmatically related nouns can also be assumed to be connected by means of semantic differentiation. For example,cherryand
pieare syntagmatically related becausecherryhas the attribute of“being an ingredient of a pie,”
but we also assume thatcherrysubcategorizes a conceptpie(i.e., a cherry pie is a specific kind of pie). Because we have no prior knowledge of how likely syntagmatic relations are to be caused by preferential attachment, we simply assume equal probability for preferential and ran-dom attachment for syntagmatically related nodes.
Table 6summarizes the statistics of the synthetic networks generated by the model together with those of the corresponding real networks.Table 6demonstrates that all the synthetic net-works have the small-world property; the average shortest path lengthLand diameterDare close to those of the real network, and the clustering coefficientCis higher than that of the ran-dom network. One difference is that the clustering coefficientCof Model A is relatively low compared with the real network. This result is not surprising because the higher probability
pof random attachment generates a more randomized, and thus less clustered network. Fig 10shows the cumulative in-degree distributions of the synthetic networks generated by the three models (Model A, Model B and Model ST). To quantitatively evaluate how well the distributions of the model fit those of the real networks, we also show the Kolmogorov–
Smirnov statisticDKSin the graphs and inTable 6. A smallerDKSimplies a better fit between the model and the data. InFig 10, the best-fit model differs depending on the real network sim-ulated. Model A reproduces the in-degree distribution that best fits the data for the DSM net-works of Type S generated by smoothed matrices, as shown inFig 10c and 10d. Model B is most appropriate for simulating the distribution of the USF association network (Type M), as shown inFig 10a. Model ST also generates an appropriate distribution in some cases; it best fits the DSM network of the unsmoothed word-word matrix (Type L), as shown inFig 10b. These results can be summarized as the relationship between the overall shape (or the tail behavior) of the in-degree distribution and the probabilitypof random attachment. A network model
Table 6. Statistics for the simulated network generated by the proposed network models.
m nCC hki D L C DKS r β Lrandom Crandom
USF association (Type M;n= 5,018)
Model A 65,221 4,845 13.0 10 4.07 0.050 0.068 −.069 0.018 — —
Model B 65,221 4,844 13.0 10 3.92 0.147 0.050 −.488 0.517 — —
Model ST 65,221 4,845 13.0 9 3.80 0.261 0.076 −.708 0.698 — —
Data 63,620 4,845 12.7 10 4.26 0.187 — −.706 0.750 3.64 0.005
Word-word matrix, unweighted, unsmoothed,cs-method (Type L;n= 4,702)
Model A 61,113 3,097 13.0 26 6.49 0.027 0.121 .090 -0.346 — —
Model B 61,113 3,099 13.0 28 6.19 0.137 0.077 −.393 0.431 — —
Model ST 61,113 3,091 13.0 19 5.52 0.266 0.056 −.712 0.661 — —
Data 59,621 3,091 12.8 24 8.31 0.366 — −.730 0.644 3.45 0.008
Word-document matrix, tf-idf, smoothed,cs-method (Type S;n= 4,702)
Model A 61,113 4,157 13.0 16 4.76 0.025 0.050 .059 -0.535 — —
Model B 61,113 4,158 13.0 12 4.50 0.129 0.081 −.399 0.424 — —
Model ST 61,113 4,158 13.0 10 4.25 0.270 0.119 −.715 0.703 — —
Data 59,613 4,156 12.6 27 5.83 0.317 — −.487 0.482 3.58 0.006
Word-word matrix, ppmi, smoothed,cs-method (Type S;n= 4,702)
Model A 61,113 4,474 13.0 10 4.20 0.041 0.096 −.022 -0.135 — —
Model B 61,113 4,474 13.0 9 4.04 0.141 0.128 −.482 0.492 — —
Model ST 61,113 4,474 13.0 8 3.89 0.266 0.147 −.708 0.704 — —
Data 59,613 4,474 12.7 19 5.77 0.251 — −.383 0.477 3.60 0.006
Note. n= number of nodes;m= number of edges;nCC= number of nodes of the largest (strongly) connected component;hki= average node degree;D=
diameter of the network;L= average shortest path length;C= clustering coefficient;DKS= Kolmogorov–Smirnov statistic between the model and the
data;r= correlation coefficient between local clustering coefficientC(k) and node degreekon a log-log plot;β= hierarchical exponent;Lrandom= average
shortest path length of the random network with the same size and density;Crandom= clustering coefficient of the random network with the same size and
density.
Fig 10. Cumulative in-degree distributions of the synthetic networks generated by the modified Steyvers–Tenenbaum model (Model A and Model
B) and by the original Steyvers–Tenenbaum model (Model ST).Note thatDKSdenotes the Kolmogorov–Smirnov statistic,pdenotes the probability of