International Marine Shipping Network: A Khapra Beetle
Study
Dean R. Paini1,2*, Denys Yemshanov3
1Cooperative Research Centre for National Plant Biosecurity, Bruce, Australia,2CSIRO, Ecosystem Sciences, Clunies Ross St, Acton, Australia,3Natural Resources Canada, Canadian Forest Service, Great Lakes Forestry Centre, Sault Ste. Marie, Ontario, Canada
Abstract
Species can sometimes spread significant distances beyond their natural dispersal ability by anthropogenic means. International shipping routes and the transport of shipping containers, in particular are a commonly recognised pathway for the introduction of invasive species. Species can gain access to a shipping container and remain inside, hidden and undetected for long periods. Currently, government biosecurity agencies charged with intercepting and removing these invasive species when they arrive to a county’s border only assess the most immediate point of loading in evaluating a shipping container’s risk profile. However, an invasive species could have infested a container previous to this point and travelled undetected before arriving at the border. To assess arrival risk for an invasive species requires analysing the international shipping network in order to identify the most likely source countries and the domestic ports of entry where the species is likely to arrive. We analysed an international shipping network and generated pathway simulations using a first-order Markov chain model to identify possible source ports and countries for the arrival of Khapra beetle (Trogoderma granarium) to Australia. We found Kaohsiung (Taiwan) and Busan (Republic of Korea) to be the most likely sources for Khapra beetle arrival, while the port of Melbourne was the most likely point of entry to Australia. Sensitivity analysis revealed significant stability in the rankings of foreign and Australian ports. This methodology provides a reliable modelling tool to identify and rank possible sources for an invasive species that could arrive at some time in the future. Such model outputs can be used by biosecurity agencies concerned with inspecting incoming shipping containers and wishing to optimise their inspection protocols.
Citation:Paini DR, Yemshanov D (2012) Modelling the Arrival of Invasive Organisms via the International Marine Shipping Network: A Khapra Beetle Study. PLoS ONE 7(9): e44589. doi:10.1371/journal.pone.0044589
Editor:Carlos Garcia de Leaniz, Swansea University, United Kingdom
ReceivedMay 4, 2012;AcceptedAugust 3, 2012;PublishedSeptember 6, 2012
Copyright:ß2012 Paini, Yemshanov. This is an open-access article distributed under the terms of the Creative Commons Attribution License, which permits unrestricted use, distribution, and reproduction in any medium, provided the original author and source are credited.
Funding:This work was supported by the Cooperative Research Corporation for National Plant Biosecurity (http://www.crcplantbiosecurity.com.au/), CRC 10161. The funders had no role in study design, data collection and analysis, decision to publish, or preparation of the manuscript.
Competing Interests:The authors have read the journal’s policy and have the following conflicts: this work was supported by the Cooperative Research Corporation of National Plant Biosecurity. This does not alter the authors’ adherence to all the PLOS ONE policies on sharing data and materials.
* E-mail: [email protected]
Introduction
Species can spread and establish in new regions at distances that far exceed the limit of an organism’s natural dispersal ability, but only if the species can find an appropriate vector to carry the organism beyond its biological spread range. This long-distance spread is often driven by human activities, usually by international trade and transportation [1,2], which has increased dramatically in the last fifty years [2]. In particular, international marine shipping, which carries 90% of world trade [3], has been acknowledged as the primary means for the introduction of many invasive species [2,4,5].
International marine shipping networks therefore provide a prominent pathway for the introduction of invasive species and there are many cases to illustrate this. For example, the spread of Asian tiger mosquito,Aedes albopictus[6] andAedes japonicas[7] to numerous countries are both believed to be caused by the international marine trade in used tires. The invasive pathogen, pine wilt disease is also believed to have been spread around the world via contaminated wood in ships [8]. Dutch elm disease arrived to the UK from Canada via the shipment of Rock Elm [9],
and numerous marine species have been translocated around the world as a result of shipping [10].
Identification of the potential pathways and sources of human-assisted introductions of invasive organisms presents significant challenges because it often requires an understanding and quantification of the relevant socio-economic activities. Consider-ing the immense amount of environmental and economic damage invasive species cause worldwide [11,12,13], it is important that researchers attempt to assess potential risks and identify likely origins of existing and future infestations. In this way, the government agencies responsible for protecting a country’s borders and natural resources from these invasions can use this information to prioritize surveillance and plan for post-detection mitigation efforts.
movement of invasive organisms is a common analytical approach [19], fewer studies have performed analyses and simulations in the domain of transportation or trade networks [4,5,17]. Note that network-based analyses could potentially provide more targeted assessments of long-distance human-mediated spread, which traditional spatial dispersal models do not predict well [20–23]. Furthermore, the potential of an invasive species being introduced at a location of interest (such as port of entry or urban area) can be estimated from each potential origin (such as a foreign port) and then all potential points of origin can be ranked to identify the ports and countries that are the most likely to be a source for a new incursion.
In this paper we analyse a complex network of international shipping routes using a first-order Markov chain model to identify potential origins of introduction (i.e. source countries and international foreign ports) for the highly invasive Khapra beetle (Trogoderma granarium) to Australia. We also identify and rank those Australian ports most likely to receive this invasive species. This analysis was undertaken with a probabilistic pathway model that describes the likelihood of the pest being moved from portito port jas a linear function of the number of trips made by container ships through the segment ij and depicted as a matrix of the transmission probabilitiespij. This matrix is then used to simulate the sequential pathways of the invasive pest’s transmission from the ports of origin where the pest is known to occur to the locations of interest (i.e. Australian ports of entry).
The pathway modelling approach presented here has some similarities with the raster-based gravity models [24,25], however our study uses directional, vector-based information and thus helps uncover the pathway ‘‘crossroads’’ and the ports - transit hubs through which the movement of infested cargoes is most likely. Because shipping containers are infrequently inspected during the transit, and may be transported over long distances before being opened [26], the use of marine traffic data helps better direct surveillance efforts to the most probable origin locations of accidental pest’s at the ports of entry.
The Khapra beetle is a pest of stored grain, causing significant economic damage across the world [27], and has been nominated as among 100 of the ‘World’s Worst’ invaders [28]. If the Khapra beetle became established in Australia, it could have a significant impact on the Australian grain industry via reduced yields and increased treatment costs [29].
As such, the Khapra beetle has been identified as a high priority exotic pest of the Australian grains industry by Plant Health Australia who have developed an industry biosecurity plan should there be an incursion [27]. This study aims to identify those countries and overseas ports most likely to be the source of a potential incursion. This will aid in the development of more effective surveillance and inspection efforts in order to prevent this pest establishing in Australia.
Materials and Methods
Data
We obtained data from the Lloyd’s Maritime Intelligence Unit (LMIU) detailing every fully cellular container ship that arrived into Australian ports between January 1st, 2002 and December 31st, 2007. This data set contained the previous ten ports of call for these container ships before arriving into one of 30 Australian ports, documenting 25,507 arrivals and departures of 557 container ships, with many ships arriving multiple times during this period. These ships travelled from and to 553 foreign ports in 126 countries.
In order to build the network of potential pathways of Khapra beetle (Trogoderma granarium) introductions to Australian ports, we used the world wide distribution of Khapra beetle from the CABI Crop Protection Compendium [30]. This distribution was used to identify the ports within the known species range. While the pest is found in 36 countries, the container ships arriving into Australian ports during this period only travelled to 24 of them (87 ports).
Pathway Model
We estimated the potential of Khapra beetle to arrive with marine container vessels via the application of a pathway-based, first-order Markov model of Khapra beetle spread with marine container vessels through an international marine shipping network.
For this study, we assumed that some transmission potential existed between all intermediate locations within the shipping route. Consider a vessel route A–B–C–D, where A, B, and C denote the foreign ports of call and D is a destination port in Australia. Given that the ship has taken and unloaded contain-erized cargoes at each port, it is feasible to assume that the pest could be moved through the segments A–B, B–C, C–D, as well as segments A–C, B–D and A–D. Hence, we have decomposed all routes that included more than two nodes in to the combinations of unique segments i to j. This information then was used to assemble a database of unique pairs of ‘‘origin’’-‘‘destination’’ ports,ij and the associated numbers of vessels travelled through each particular segmentitoj.
The records did not detail the actual number of containers that have been unloaded or loaded at each particular port; hence we assumed that each vessel would have similar capacity to carry the pest in a containerized cargo. We acknowledge that more detailed information on the cargo types in cellular containers and the tonnages of loaded/unloaded containers could improve the accuracy of the pathway predictions however this information was not available. No future forecast was imposed on the container shipment data; therefore, the analysis is best interpreted as showing the present-day entry potential of Khapra beetle.
In summary, each unique pathway segment, i to j had an associated number of trips between two given ports,iandj,mij. We then rescaled the number of trips to the transmission rate value,pij, of the beetle being moved from i to j over the six year survey period (2002–2007) based on the total number of container vessels travelling fromitoj:
pij~mijl ð1Þ
where lt is the rate of Khapra beetle transmission with one container vessel over the survey periodt(six years). Essentially,ltis a scaling coefficient that translates the number of trips to a transmission rate value so the sum of the transmission rates is below 1:
X
n
j~1
mijltv1 ð2Þ
Pt~
0 ltm12 ::: ltm1n
ltm21 0 ::: ltm2n
::: ::: ::: ::: ltmn1 ltmn2 ::: 0
2 6 6 6 4 3 7 7 7 5
ð3Þ
Note that the value ofltis relative only to the number of vessels recorded in the Lloyds data between 2002 and 2007. Because the pathway model was only used in a relative context – to order the foreign ports by theirrelativepotential to be the source of Khapra beetle incursions at Australian ports (i.e. that the port X has a higher potential to be the source of beetle incursions than the port Y) – a precise estimation oflt was unnecessary. In our case, we selected theltvalue to ensure any row in the matrix Ptsatisfies the condition in Eq. 2 (so the row sum of the transmission rates is below 1). Note that the use of small lt values that ensure the conditions Spij ,1 was done for technical reasons so the ltmij values could be treated as probabilities in the model simulations.
The matrix had a size,Y, equal to the number of port locations in the Lloyds register data (i.e. the nodes of the shipping network). The data did not provide information about the number of containers unloaded/loaded at intermediate ports, so the diagonal elements ofPtwere set to 0.
We also added an extra column to the matrixPtthat describes the potential of the Khapra beetle not surviving transit fromitoj, i.e.:
Pt~
0 p12 p1n 1{P
n
j~1
p1j
p21 0 p2n 1{P
n
j~1
p2j
. . . . . . . . . . . . . . .
pn1 pn2 0 1{P
n
j~1
pnj 2 6 6 6 6 6 6 6 6 6 6 6 4 3 7 7 7 7 7 7 7 7 7 7 7 5
ð4Þ
where the elements 1{Pn
j~1
pij describe the probability that the
Khapra beetle doesn’t arrive in portj.
The pathway matrixPtwas then used to generate stochastic
realizations of potential movements of the beetle from the foreign ports in regions where the Khapra beetle is known to exist. Starting at each port in the countries with Khapra beetle (one port at a time), the model simulated the subsequent movements of the beetle to other locations by extracting the associated vector of transmission rates from the matrixPt at each port’s location and using it to select the next port. The process continued until the chosen location had no outgoing paths recorded in the Pt or a
terminal state was selected based on the elements1{Pn
j~1
pijin Eq.
4. Finally, we estimated the rates of pest arrival from the locationi fromj,Qij, from the number of times,Jithe pathways originated at a given portiwithin a Khapra beetle range arrived at the portj over the multiple stochastic pathway simulations:
Qij~Ji=K ð5Þ
where K is the total number of individual simulations of the pathway spread fromi(K= 26106for each port of origini). Note that the value ofQijwas also estimated for each port in the network
ioutside of the Khapra beetle known range, however our study focuses on Australian ports only. Notably, the value of Qij is conditional on the value oflchosen. However, sincelwas a linear multiplier applied to each element of the matrixPt, changes in its value did not affect the partial order relationships based on the estimated arrival rate values,Qijand consecutively, the ranking of the individual ports by the Khapra beetle incursion potential.
Summary Metrics
The forward-looking simulations provided for each port within the Khapra beetle range, i, list the arrival rates, Qij to the destination portsjin Australia. For each port of originiwithin the Khapra beetle range, we then compiled the lists of the arrival rate values, Qij for all other ‘‘destination’’ locations in Australia, j, j= 1,…,n,j?i. We then tabulated theQijvalues in a way so each ‘‘destination’’ location in the shipping network,j(i.e. an Australian port) had a corresponding list of the ports-potential origins,i(i.e. from where the pathway simulations were originally started) with the corresponding arrival rate values from the origin i to a destinationj. We then summarized movement of the pest through the shipping network in two ways. First, for each Australian port,j, we generated an overall arrival rate of the Khapra beetle from all foreign ports as:
Qj~1{ P n,j=i
j~1
1{Qij
h i
ð6Þ
where equation [6] is the product of all the beetle arrival rate values from all foreign ports to an Australian port,j.
We then usedQjto rank the Australian ports by their potential
to receive containers from the ports in the regions infested with Khapra beetle. We generated overall beetle arrival rates from each foreign port to all Australian ports combined. These values were then used to rank foreign ports by their potential to be the origin of a Khapra beetle infestation to Australian ports. It is tempting to identify arrival rates as arrival likelihoods, however these values are a function of l, which currently is unknown. As such, we calculated relative arrival rate values, which give an indication of the relative difference in risk for foreign and Australian ports to receive the pest. These relative arrival rates were calculated by dividing a port’s arrival rate,Qij, by the mean arrival rate.
We have also provided a general characteristic of the shipping network using the degree centrality metric. The degree centrality denotes the sum of the total numbers of ship arrivals and departures at a given port and is often interpreted as measure of the importance of a particular node in the network [31]. We then compared the degree centrality with the arrival rate,Qjfor major Australian ports.
Sensitivity Analysis
Uncertainties are an intrinsic feature of model-based assess-ments of ecological invasions [32], therefore it is important to estimate the impact of uncertainties on model results (the arrival rate values in our study). Uncertainty in the structure of the pathway network as well as key parameters of the pathway model can propagate in the model outputs [33,34] and need to be properly estimated.
In this study we estimated the impact of the uncertainty in key elements of the pathway model on the port-specific arrival ratesQj. First, we tested two scenarios that considered somewhat different aspects of the uncertainty around the transmission rate valuespijin the pathway matrixPt(Eq. 4). The first scenario added increasing
the mean pij values. Each pair of 6 0.3pij bounds defined the endpoints for a symmetric uniform distribution (with an upper bound of pij= 1.0 and lower bound of pij= 0) from which we sampled values randomly for input into the model. This scenario explored the impact of multiplicative errors in pij at the levels proportional to the baselinepijvalues, so the higherpijvalues had larger levels of uncertainty (and vice versa). The addition of multiplicative errors alters all positive values ofpijbut does not change the nodes withpij= 0. This implies that the multiplicative errors do not add or remove additional pathways with positive pest’s transmission potential and do not change the general structure of the shipping network. In general terms, these errors can be interpreted as uncertainty associated with the measurement of the transmission rates but holding the assumption that the general structure of the shipping network, the knowledge of ports with known beetle infestations and the average trade flow values are well known.
The second scenario estimated the impact of additive errors in the transmission probability values by adding a small uniform random variate topijregardless of their absolute values (i.e. including the nodes withpij= 0) and observing the impact on the location-specific arrival rates,Qj. This scenario changes the mean values ofpijand also adds new nodes to the shipping network (by changing thepij= 0 to a small positive random value and subsequently, altering the configuration of the shipping network). In short, this scenario adds the geographically uniform random variation to each network’s topology by assuming a very low probability of pest’s transmission through each possible network segmentijwith a set of bounds [0; 0.05]. In broad terms, these additive errors in thepijvalues depict an increasing lack of knowledge about thepij(i.e. from where and to where the ships with potentially infested cargoes may be travelling)
that shifts thepijvalues towards a uniform random distribution and thus changes the patterns of commodity flows and a configuration of the shipping network (the latter aspect was also the reason of choosing a relatively low upper bound, 0.05, of uniform distributions ofpijvalues).
We have also tested the topological stability of the shipping network. Our third scenario explored the impact of uncertainty about the configuration of the transportation network, which is the presence or absence of a particular node in the network. This approach goes beyond the traditional sensitivity analysis [35,36] and focuses on changes in the network’s connectivity [37]. To keep the analysis consistent with the abovementioned multiplicative and additive error scenarios we used a relatively straightforward technique and simulated added errors to knowledge about the network’s connectivity by temporarily removing a random portion of interlinked paths ij from the network and observed the corresponding changes in arrival rate values,Qj. At each pathway
simulation event, the proportion of nodes (i.e. elementsi,jin the pathway matrixPt) to be removed randomly was drawn from a
uniform distribution [0; 0.3]. In broad terms, the errors associated with the presence or absence of a particular node depict the potential lack of information about the connectivity of the shipping network (for instance, the insufficient data about undocumented intermediate stops in foreign ports before ship arrives to the final destination port).
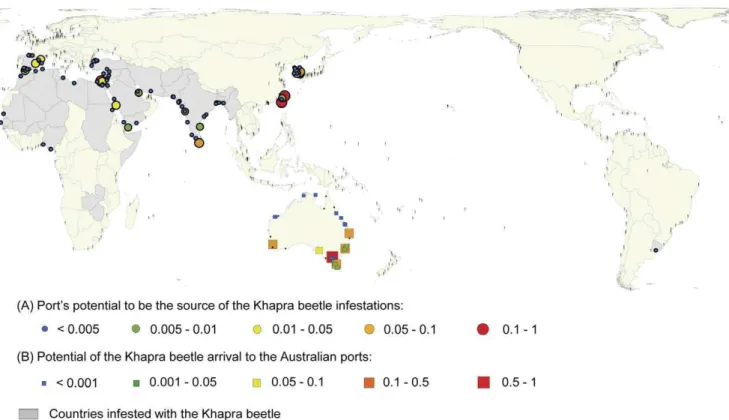
Figure 1. A geographical distribution of the Khapra beetle arrival potential to Australian ports.(A) Potential of foreign ports to be the source of Khapra beetle arrival at an Australian port, (B) The potential of Australian ports to receive Khapra beetle from foreign ports infested with the pest.
Results
Rankings of Foreign Countries as Potential Origins of KB Arrivals
We found Taiwan and Republic of Korea had the highest potentials for being a source of Khapra beetle (Trogoderma granarium) incursions (Figure 1 and Table 1; for the full list see Table S1). The relative arrival rate from these two countries to Australian ports was considerably higher (more than 3 times) than the third highest-ranked country (Egypt).
Rankings of Australian Ports to Receive the Pest from Elsewhere
We found the port of Melbourne to have the greatest potential to receive containerized cargoes infested with Khapra beetle, with Botany Bay and Brisbane being the next two highest ranked ports, respectively (Figure 1 and Table 2; for the full list see Table S2).
We then examined the rankings of foreign ports for each of the ten Australian ports in Table 2 and found the ports of Busan (Republic of Korea) and Kaohsiung (Taiwan) to be ranked first and second (respectively) for nine of the ten Australian ports, with their order reversed at Botany Bay (Table 3; for full lists see Tables S3, S4, S5, S6, S7, S8, S9, S10, S11, S12). The relative rates of the Khapra beetle arrival to Australian ports from these two foreign ports are generally three or more times higher than from the third ranked foreign port.
Sensitivity Analysis
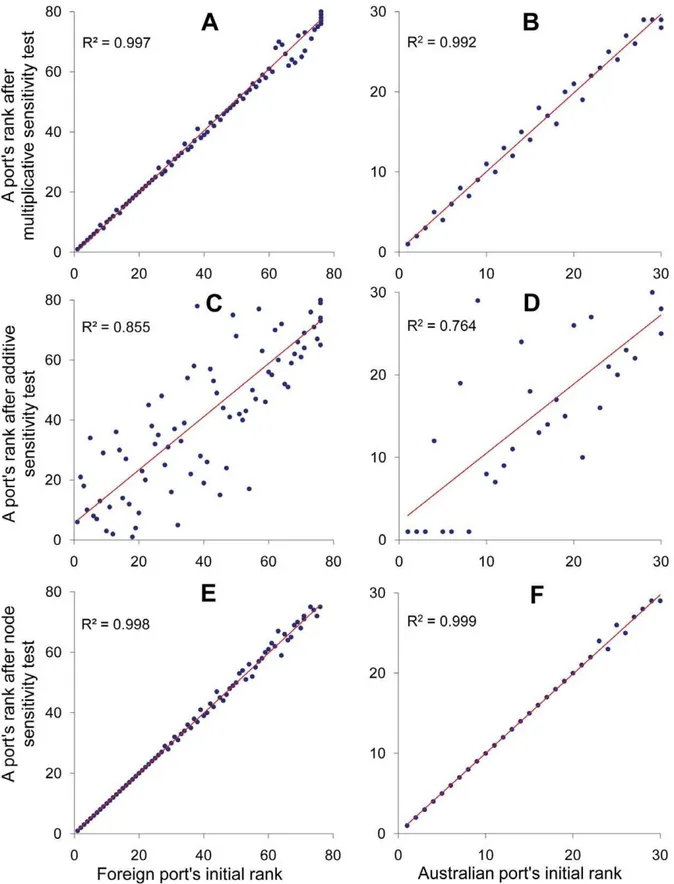
Multiplicative errors in the transmission probability values. We found the introduction of this type of error to the pij values had little effect on the rankings of foreign ports, particularly those ports that were ranked in the top half of the list (Figure 2A: linear regression, t85= 110.64, p,0.001, R2= 0.997).
A similar pattern was found with the ranking of Australian ports by their likelihoods to receive the Khapra beetle from foreign ports (Figure 2B: linear regression, t29= 42.40, p,0.001, R2= 0.992).
Additive errors in the transmission probability values. This introduced error changed the rankings of foreign and Australian ports (Figure 2C and 2D), though the rankings were still significantly correlated (foreign ports: linear regression,
t85= 15.19, p,0.001, R2= 0.855; Australian ports: linear
regres-sion, t29= 6.37, p,0.001, R2= 0.764).
Random removal of nodes from the shipping network. The random removal of a proportion of nodes from the shipping network (and associated pairs of origin-destination ports) had little impact on the rankings. In particular, the rankings of the top 30 foreign ports remained unchanged (Figure 2E: linear regression, t85= 155.22, p,0.001, R2= 0.998). A similar pattern
was observed for the rankings of Australian ports (linear regression, t29= 114.23 at p,0.001, R2= 0.999), with the ranks
of the top 20 Australian ports remaining unchanged (Figure 2F).
Discussion
Major Threats of Khapra Beetle Arrivals
The two ports, Busan (Republic of Korea) and Kaohsiung (Taiwan) represent substantially greater threats for the arrival of Khapra beetle to Australia, than any other international port. Taiwan, was ranked as the greatest threat to Australia for this beetle, and has two of its ports (Kaohsiung and Keelung) ranked in the top three or four as potential sources of Khapra beetle arrivals to Australia (depending on the Australian port considered: Table 3). The high likelihood of ports in Taiwan and the Republic of Korea being a source of Khapra beetle is likely a result of a large number of container ships travelling through these two ports before arriving into Australia. Examining the port rankings by degree centrality (the total number of ship arrivals and departures at a given port) revealed that Busan and Kaoshing had approximately four times the degree centrality (3086 and 2979, respectively) of the third ranked port, Keelung (758). A similar pattern was observed when pooling degree centrality to the country level and examining the rankings. Again Taiwan and the Republic of Korea were the top two ranked by degree centrality. While the combined number of arrivals and departures (degree centrality) in this marine transportation network might be enough to identify ports (or countries) of high infestation risk, this may not always be sufficient to identify the gateways of pest introduction. The particular corridor of pest arrival will be a result of the configuration of the shipping routes (i.e. it becomes a function of a network’s topology). For example, the degree centrality could be distributed evenly within the network while some specific nodes
Table 1.Top ten ranked source countries for Khapra beetle
infestations at Australian ports.
Country Qij RelativeQij*
Taiwan 0.639 9.054
Republic of Korea 0.594 8.413
Egypt 0.155 2.197
Spain 0.096 1.355
Saudi Arabia 0.067 0.953
Sri Lanka 0.066 0.939
India 0.022 0.315
Yemen 0.013 0.186
Turkey 0.012 0.168
Pakistan 0.009 0.121
Countries ranked by the arrival rate (Qij) to all Australian ports from the ports in
a given country. For the full list see Table S1.
*denotes the pest’s relative arrival rate versus the avergaeQijvalues for all
network locations (Qij= 0.0706). doi:10.1371/journal.pone.0044589.t001
Table 2.Top ten ranked Australian ports for receiving the
Khapra beetle from foreign ports.
Australian Port Qij RelativeQij*
Melbourne 0.547 8.921
Botany Bay 0.398 6.487
Brisbane 0.390 6.369
Bell Bay 0.217 3.537
Fremantle 0.154 2.517
Adelaide 0.095 1.548
Burnie 0.050 0.808
Sydney 0.026 0.418
Hobart 0.014 0.225
Newcastle 0.003 0.047
Ports ranked by arrival rate of Khapra beetle (Qij) from foreign ports in the
countries with known beetle presence. For the full list see Table S2. *denotes the pest’s relative arrival rate versus the avergaeQijvalues for all
Figure 2. Sensitivity analysis.Changes in port rankings after the introduction of multiplicative errors (A–B), additive errors (C–D), and the random removal of a portion of the nodes from the transportation network (E–F). All figures show significant (p,0.001) rank correlations (see Results for details). The lowest rank values (starting from 1) indicate the highest risk.
(ports) may be part of a well-travelled transportation corridor that connects particular regions with considerable trade flows. In this case, undertaking the simulations of individual shipping pathways through the network (as we have done in this study) may be the only way to identify high ranked ports. This point can be illustrated by examining the lower ranked countries in Table 1. Yemen is ranked 8th, above Turkey and Pakistan, for arrival rate of Khapra beetle. However, using degree centrality, Yemen would be ranked below these two countries, with less than half the degree centrality (Yemen = 57 degree centrality, Pakistan = 125, Tur-key = 113).
Stability of the Ports’ Rankings to Uncertainty
The sensitivity analysis revealed that the rankings of Australian and foreign ports are considerably stable. Despite the uniform random variance introduced into the pij values, the rankings remained relatively unchanged. These results are not surprising, given that the model is essentially a first-order Markovian pathway matrix, and thepijvalues did not include geographically explicit or climate-specific modifications. Further research will be required to better determine howpij(i.e. the transmission rate from one port to the next) might vary with season and geographical location. A better understanding of the value ofpijcould mean these arrival rate values could be combined with establishment likelihoods [38]
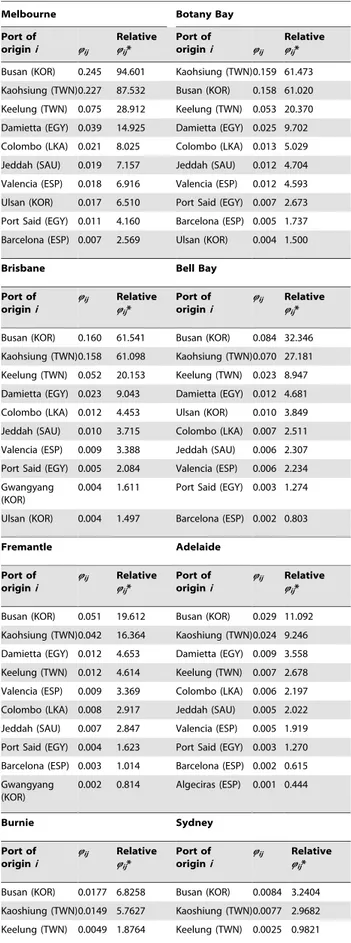
Table 3.Port by port rankings.
Melbourne Botany Bay
Port of
origini Qij
Relative Qij*
Port of
origini Qij
Relative Qij*
Busan (KOR) 0.245 94.601 Kaohsiung (TWN)0.159 61.473
Kaohsiung (TWN)0.227 87.532 Busan (KOR) 0.158 61.020
Keelung (TWN) 0.075 28.912 Keelung (TWN) 0.053 20.370
Damietta (EGY) 0.039 14.925 Damietta (EGY) 0.025 9.702
Colombo (LKA) 0.021 8.025 Colombo (LKA) 0.013 5.029
Jeddah (SAU) 0.019 7.157 Jeddah (SAU) 0.012 4.704
Valencia (ESP) 0.018 6.916 Valencia (ESP) 0.012 4.593
Ulsan (KOR) 0.017 6.510 Port Said (EGY) 0.007 2.673
Port Said (EGY) 0.011 4.160 Barcelona (ESP) 0.005 1.737
Barcelona (ESP) 0.007 2.569 Ulsan (KOR) 0.004 1.500
Brisbane Bell Bay
Port of origini
Qij Relative
Qij*
Port of origini
Qij Relative
Qij*
Busan (KOR) 0.160 61.541 Busan (KOR) 0.084 32.346
Kaohsiung (TWN)0.158 61.098 Kaohsiung (TWN)0.070 27.181
Keelung (TWN) 0.052 20.153 Keelung (TWN) 0.023 8.947
Damietta (EGY) 0.023 9.043 Damietta (EGY) 0.012 4.681
Colombo (LKA) 0.012 4.453 Ulsan (KOR) 0.010 3.849
Jeddah (SAU) 0.010 3.715 Colombo (LKA) 0.007 2.511
Valencia (ESP) 0.009 3.388 Jeddah (SAU) 0.006 2.307
Port Said (EGY) 0.005 2.084 Valencia (ESP) 0.006 2.234
Gwangyang (KOR)
0.004 1.611 Port Said (EGY) 0.003 1.274
Ulsan (KOR) 0.004 1.497 Barcelona (ESP) 0.002 0.803
Fremantle Adelaide
Port of origini
Qij Relative
Qij*
Port of origini
Qij Relative
Qij*
Busan (KOR) 0.051 19.612 Busan (KOR) 0.029 11.092
Kaohsiung (TWN)0.042 16.364 Kaoshiung (TWN)0.024 9.246
Damietta (EGY) 0.012 4.653 Damietta (EGY) 0.009 3.558
Keelung (TWN) 0.012 4.614 Keelung (TWN) 0.007 2.678
Valencia (ESP) 0.009 3.369 Colombo (LKA) 0.006 2.197
Colombo (LKA) 0.008 2.917 Jeddah (SAU) 0.005 2.022
Jeddah (SAU) 0.007 2.847 Valencia (ESP) 0.005 1.919
Port Said (EGY) 0.004 1.623 Port Said (EGY) 0.003 1.270
Barcelona (ESP) 0.003 1.014 Barcelona (ESP) 0.002 0.615
Gwangyang (KOR)
0.002 0.814 Algeciras (ESP) 0.001 0.444
Burnie Sydney
Port of origini
Qij Relative
Qij*
Port of origini
Qij Relative
Qij*
Busan (KOR) 0.0177 6.8258 Busan (KOR) 0.0084 3.2404
Kaoshiung (TWN)0.0149 5.7627 Kaoshiung (TWN)0.0077 2.9682
Keelung (TWN) 0.0049 1.8764 Keelung (TWN) 0.0025 0.9821
Table 3.Cont.
Melbourne Botany Bay
Port of
origini Qij
Relative Qij*
Port of
origini Qij
Relative Qij*
Damietta (EGY) 0.0026 0.9920 Damietta (EGY) 0.0018 0.6922
Ulsan (KOR) 0.0021 0.8098 Colombo (LKA) 0.0009 0.3436
Colombo (LKA) 0.0014 0.5356 Jeddah (SAU) 0.0007 0.2680
Jeddah (SAU) 0.0012 0.4785 Valencia (ESP) 0.0007 0.2535
Valencia (ESP) 0.0012 0.4650 Port Said (EGY) 0.0005 0.1909
Port Said (EGY) 0.0007 0.2591 Ulsan 0.0004 0.1463
Barcelona (ESP) 0.0004 0.1726 Barcelona (ESP) 0.0003 0.1126
Hobart Newcastle
Port of origini
Qij Relative
Qij*
Port of origini
Qij Relative
Qij*
Busan (KOR) 0.0049 1.8767 Busan (KOR) 0.00089 0.34454
Kaoshiung (TWN)0.0041 1.5825 Kaoshiung (TWN)0.00082 0.31716
Keelung (TWN) 0.0014 0.5427 Keelung (TWN) 0.00028 0.10701
Damietta (EGY) 0.0007 0.2684 Damietta (EGY) 0.00018 0.06883
Ulsan (KOR) 0.0005 0.2113 Colombo (LKA) 0.00009 0.03605
Colombo (LKA) 0.0004 0.1521 Valencia (ESP) 0.00009 0.03335
Jeddah (SAU) 0.0004 0.1357 Jeddah (SAU) 0.00007 0.02564
Valencia (ESP) 0.0004 0.1350 Barcelona (ESP) 0.00005 0.01947
Port Said (EGY) 0.0002 0.0833 Port Said (EGY) 0.00004 0.01504
Barcelona (ESP) 0.0001 0.0488 Karachi (PAK) 0.00004 0.01407
Top ten ranked source ports for Khapra beetle introduction to the ten most threatened Australian ports (see the rankings of Australian ports in Table 2). For the full lists see Tables S3, S4, S5, S6, S7, S8, S9, S10, S11, S12.
*denotes the relative pest’s arrival rate versus the avergaeQijvalues for all
and serve as inputs into economic analyses and risk assessments associated with the particular groups of imports [39,40,41].
Indirect supportive evidence for this model comes from a Khapra beetle incursion in Perth, Western Australia in 2007. The beetle was found in the personal belongings of a family migrating to Australia from Scotland, which were shipped to Australia in an infected shipping container. A trace back of the container, which carried the family’s belongings revealed that the container had visited the following ports (in reverse order), Fremantle (Australia), Grangemouth (Scotland), Felixstowe (England), Pt Qasim (Paki-stan), Gwangyang (South Korea), Busan (South Korea), Hamburg (Germany), Bangkok (Thailand) (personal communication – Rob Emery, Dept of Agriculture and Food, Western Australia, 2011). Although a molecular analysis to identify the exact source of this incursion was never completed, we note that Busan, and Gwangyang, were both visited by this container and were ranked 1stand 10th(respectively) as possible source ports for the receiving
Australian port – Fremantle (Table 3).
Potential Applications of the Pathway Model in Biosurveillance
Currently, Australian government biosecurity agencies do not identify a container’s previous ports (other than the immediate one in which the container was loaded before arriving to Australia). Considering the high risk posed by Khapra beetle and its ability to survive for long periods, undetected [42], biosecurity agencies should expand their screening efforts to collect a container’s pathway history from shipping companies and use it to evaluate a container’s risk profile. It would then be possible to optimise current inspection protocols and more efficiently allocate resources for biosecurity screening and surveillance.
Although the dataset used in our study documents the previous ten ports visited prior to the arrival of a ship to Australian ports, it is possible that the Khapra beetle could infest a container previous to these ten ports. The data show the average number of days at sea between ports is 7.9 days. Any ten-port steps would therefore cover, on average, 71 days. While this time frame would normally encompass the lifecycle of the Khapra beetle, its ability to go into a prolonged period of diapause could result in this species surviving long periods on a shipping journey [42,43].
Technical Aspects of an Application of the Pathway Model
The probabilistic pathway model presented in this study provides a computationally tractable and relatively simple way of incorporating trade and transportation data into assessments of human-assisted introductions of invasive pests. Essentially, the pathway model represents a network of vectors, each character-ized by the probability of an organism’s transmission based on the frequency of container ships travelling between the ports in other countries and Australian ports of entry. The model uses directional marine traffic flows to estimate local rates of the invasive pest arrival at Australian ports. In general, the behavior of the model is similar to approximating the network of commodity marine traffic flows with a gravity model [5], however our model is focused on reconstructing the sequential pathways of movement of Khapra beetle with container ships and does not attempt to recreate the full topological structure of the marine shipping network.
The model presented here is a first-order Markov chain in which the next pathway segment taken by a container vessel is independent of its previous path. In short, when a container arrives into a port on a ship, its future path is not bound to that ship, but is considered a function of the number of ships travelling
from that port to other ports. Clearly, this assumption could vary from port to port. For large hub ports, such as Singapore, where many arriving ships unload their containers for transfer to other ships, this is more likely to be a valid assumption. However, for smaller non-hub ports, most containers are likely to remain on a ship and continue along the predetermined path that ship travels. While presently, the vessel-specific data on container transfer were unavailable, we acknowledge that adding the port-specific estimates of the likelihood of a container being transferred to another ship after the arrival at the port would improve the pathway model and likely refine its predictions and rankings.
Conclusions
The analysis of a marine shipping network represents a significant step forward in the assessment of pathways of entry and identification of potential source locations for invasive species, which previously only assessed direct pathways of entry from a source country. Considering the increasingly connected nature of the world’s transportation and trade networks, and the increasing multitude of potential carriers of invasive organisms from one part of the world to another, this more sophisticated evaluation of potential pathways would seem appropriate. Analysing trade and transportation networks using pathway model simulations enables the ranking of potential sources of invasive pest incursions, and can be applied to any invasive species of concern and any country at risk from invasion. Note that the method presented in this study does not attempt to find the source of infestationsper se(as would be determined by genetic DNA testing methods), but rather prioritizes the most likely sources of future infestations from a multitude of potential locations of pest’s origins. Given the stability of the outputs of this model in the presence of uncertainty about the Khapra beetle’s port-to-port transmission potential, the analytic approach presented in this study helps improve and make more effective the current risk screening procedures of shipping containers undertaken by government agencies and industry stakeholders wishing to prevent the arrival and introduction of an invasive threat.
Supporting Information
Table S1 Ranking of source countries for Khapra beetle
infestations at Australian ports. Countries ranked by the
arrival rate (Qij) to all Australian ports from the ports in a given country.
(DOCX)
Table S2 Ranking of Australian ports for receiving the
Khapra beetle from foreign ports.Ports ranked by arrival
rate of Khapra beetle (Qij) from foreign ports in the countries with known beetle presence.
(DOCX)
Table S3 Ranking of all source ports for Khapra beetle introduction to the Australian port of Melbourne. (DOCX)
Table S4 Ranking of all source ports for Khapra beetle introduction to the Australian port of Botany Bay. (DOCX)
Table S5 Ranking of all source ports for Khapra beetle introduction to the Australian port of Brisbane.
(DOCX)
Table S6 Ranking of all source ports for Khapra beetle introduction to the Australian port of Bell Bay.
Table S7 Ranking of all source ports for Khapra beetle introduction to the Australian port of Fremantle. (DOCX)
Table S8 Ranking of all source ports for Khapra beetle introduction to the Australian port of Adelaide.
(DOCX)
Table S9 Ranking of all source ports for Khapra beetle introduction to the Australian port of Burnie.
(DOCX)
Table S10 Ranking of all source ports for Khapra beetle introduction to the Australian port of Sydney Harbour. (DOCX)
Table S11 Ranking of all source ports for Khapra beetle introduction to the Australian port of Hobart.
(DOCX)
Table S12 Ranking of all source ports for Khapra beetle introduction to the Australian port of Newcastle. (DOCX)
Acknowledgments
DRP acknowledges the support of the Australian Government’s Cooper-ative Research Centres Program. We extend our thanks to Peter Caley and Tom Harwood for comments on earlier versions of the manuscript; Marty Siltanen and Kirsty Wilson for technical diligence with preparing the data and help with running the pathway model simulations. Thanks also go to the Australian Federal Department of Agriculture, Fisheries and Forestry for providing the shipping network data.
Author Contributions
Conceived and designed the experiments: DRP DY. Performed the experiments: DY. Analyzed the data: DY DRP. Wrote the paper: DRP DY.
References
1. Meyerson LA, Mooney HA (2007) Invasive alien species in an era of globalization. Frontiers in Ecology and the Environment 5: 199–208. 2. Hulme PE (2009) Trade, transport and trouble: managing invasive species
pathways in an era of globalization. Journal of Applied Ecology 46: 10–18. 3. IMO (2011) International shipping facts and figures - information resources on
trade, safety, security, environment. International Maritime Organization. 4. Yemshanov D, Koch FH, Ducey M, Koehler K (2011) Trade-associated
pathways of alien invasive forest insect entries in Canada. Biological Invasions 14: 797–812.
5. Kaluza P, Kolzsch A, Gastner MT, Blasius B (2010) The complex network of global cargo ship movements. Journal of the Royal Society Interface 7: 1093– 1103.
6. Kiritani K, Yamamura K (2003) Exotic insects and their pathways for invasion. In: Ruiz GM, Carlton JT, editors. Invasive species Vectors and management strategies. Washington: Island Press.
7. Lounibos LP (2002) Invasions by insect vectors of human disease. Annual Review of Entomology 47: 233–266.
8. Webster J, Mota M (2008) Pine wilt disease: global issues, trade and economic impact. In: Mota M, Vieira P, editors. Pine wilt disease: a worldwide threat to forest ecosystems: Springer.
9. Brasier CM, Gibbs JN (1973) Origin of the Dutch elm disease epidemic in Britain. Nature 242: 607–609.
10. Hayes KR, Sliwa C (2003) Identifying potential marine pests - a deductive approach applied to Australia. Marine Pollution Bulletin 46: 91–98. 11. Blackburn TM, Cassey P, Duncan RP, Evans KL, Gaston KJ (2004) Avian
extinction and mammalian introductions on oceanic islands. Science 305: 1955– 1958.
12. Hulme PE, Pysek P, Nentwig W, Vila M (2009) Will threat of biological invasions unite the European Union? Science 324: 40–41.
13. LaDeau SL, Kilpatrick AM, Marra PP (2007) West Nile virus emergence and large-scale declines of North American bird populations. Nature 447: 710–714. 14. Keller RP, Drake JM, Drew MB, Lodge DM (2011) Linking environmental conditions and ship movements to estimate invasive species transport across the global shipping network. Diversity and Distributions 17: 93–102.
15. Tatem AJ, Hay SI (2007) Climatic similarity and biological exchange in the worldwide airline transportation network. Proceedings of the Royal Society B-Biological Sciences 274: 1489–1496.
16. Tatem AJ, Hay SI, Rogers DJ (2006) Global traffic and disease vector dispersal. Proceedings of the National Academy of Sciences of the United States of America 103: 6242–6247.
17. Koch FH, Yemshanov D, Colunga-Garcia M, Magarey RD, Smith WD (2011) Potential establishment of alien-invasive forest insect species in the United States: where and how many? Biological Invasions 13: 969–985.
18. Drake JM, Lodge DM (2004) Global hot spots of biological invasions: evaluating options for ballast-water management. Proceedings of the Royal Society of London Series B-Biological Sciences 271: 575–580.
19. Pitt JPW, Worner SP, Suarez AV (2009) Predicting Argentine ant spread over the heterogeneous landscape using a spatially explicit stochastic model. Ecological Applications 19: 1176–1186.
20. Buchan LAJ, Padilla DK (1999) Estimating the probability of long-distance overland dispersal of invading aquatic species. Ecological Applications 9: 254– 265.
21. Melbourne BA, Hastings A (2009) Highly variable spread rates in replicated biological invasions: fundamental limits to predictability. Science 325: 1536– 1539.
22. Neubert MG, Caswell H (2000) Demography and dispersal: Calculation and sensitivity analysis of invasion speed for structured populations. Ecology 81: 1613–1628.
23. Hastings A, Cuddington K, Davies KF, Dugaw CJ, Elmendorf S, et al. (2005) The spatial spread of invasions: new developments in theory and evidence. Ecology Letters 8: 91–101.
24. Bossenbroek JM, Kraft CE, Nekola JC (2001) Prediction of long-distance dispersal using gravity models: Zebra mussel invasion of inland lakes. Ecological Applications 11: 1778–1788.
25. Prasad AM, Iverson LR, Peters MP, Bossenbroek JM, Matthews SN, et al. (2010) Modeling the invasive emerald ash borer risk of spread using a spatially explicit cellular model. Landscape Ecology 25: 353–369.
26. Allen EA, Humble LM (2002) Nonindigenous species introductions: a threat to Canada’s forests and forest economy. Canadian Journal of Plant Pathology-Revue Canadienne De Phytopathologie 24: 103–110.
27. Plant Health Australia (2005) Industry Biosecurity Plan for the Grains Industry -Khapra Beetle. Plant Health Australia.
28. Global Invasive Species Database (2012)Trogoderma granarium.
29. Ridsell-Smith J, McKirdy S, Maynard G (2008) Impact of exotic pest invasions on Australian agriculture: the need for biosecurity and quarantine. Entomolog-ical Society of America. Reno, Nevada: EntomologEntomolog-ical Society of America. 30. CABI CPC (2011) CAB International Crop Protection Compendium. 31. Wasserman S, Faust K (1994) Social network analysis. Methods and
applications. Cambridge: Cambridge University Press.
32. Andrews CI, Hassenzahl DM, Johnson BB (2004) Accommodating uncertainty in comparative risk. Risk Analysis 24: 1323–1335.
33. Li H, Wu J (2006) Uncertainty analysis in ecological studies: an overview. In: Wu J, Jones KB, Li H, Loucks OL, editors. Scaling and uncertainty analysis in ecology: methods and applications. Dordrecht: Springer.
34. Walker WE, Harramoes P, Rotmans J, van der Sluijs JP (2003) Defining uncertainty - a conceptual basis for uncertainty management in model-based decision support. Integrated Assessment 4: 5–17.
35. Henderson-Sellers B, Henderson-Sellers A (1996) Sensitivity evaluation of environmental models using fractional factorial experimentation. Ecological Modelling 86: 291–295.
36. Swartzman GL, Kaluzny SP (1987) Ecological simulation primer. New York: MacMillan Publishing Company.
37. Krammer F, Taubig H (2005) Connectivity. In: Brandes U, Erlebach R, editors. Network analysis Methodological Foundations: Springer. 143–177.
38. Paini DR, Worner SP, Cook DC, De Barro PJ, Thomas MB (2010) Using a self organising map to predict invasive species: sensitivity to data errors and a comparison with expert opinion. Journal of Applied Ecology 47: 290–298. 39. Cook DC, Carrasco LR, Paini DR, Fraser RW (2011) Estimating the social
welfare effects of New Zealand apple imports. The Australian Journal of Agricultural and Resource Economics 55: 599–620.
40. Cook DC, Fraser RW, Paini DR, Warden AC, Lonsdale WM, et al. (2011) Biosecurity and Yield Improvement Technologies Are Strategic Complements in the Fight against Food Insecurity. Plos One 6.
41. Yemshanov D, Koch FH, Lyons DB, Ducey M, Koehler K (2012) A dominance-based approach to map risks of ecological invasions in the presence of severe uncertainty. Diversity and Distributions 18: 33–46.
42. Bell CH (1994) A review of diapause in stored-product insects. Journal of Stored Products Research 30: 99–120.