Different Scales
Yang Tang1,2,3*, Huijun Gao1, Wei Zou2,3,4, Ju¨rgen Kurths1,2,5*
1Research Institute of Intelligent Control and Systems, Harbin Institute of Technology, Harbin, China,2Institute of Physics, Humboldt University Berlin, Berlin, Germany, 3Potsdam Institute for Climate Impact Research, Telegraphenberg, Potsdam, Germany,4School of Mathematics and Statistics, Huazhong University of Science and Technology, Wuhan, China,5Institute for Complex systems and Mathematical Biology, University of Aberdeen, Aberdeen, United Kindom
Abstract
Recent studies have detected hubs in neuronal networks using degree, betweenness centrality, motif and synchronization and revealed the importance of hubs in their structural and functional roles. In addition, the analysis of complex networks in different scales are widely used in physics community. This can provide detailed insights into the intrinsic properties of networks. In this study, we focus on the identification of controlling regions in cortical networks of cats’ brain in microscopic, mesoscopic and macroscopic scales, based on single-objective evolutionary computation methods. The problem is investigated by considering two measures of controllability separately. The impact of the number of driver nodes on controllability is revealed and the properties of controlling nodes are shown in a statistical way. Our results show that the statistical properties of the controlling nodes display a concave or convex shape with an increase of the allowed number of controlling nodes, revealing a transition in choosing driver nodes from the areas with a large degree to the areas with a low degree. Interestingly, the community Auditory in cats’ brain, which has sparse connections with other communities, plays an important role in controlling the neuronal networks.
Citation:Tang Y, Gao H, Zou W, Kurths J (2012) Identifying Controlling Nodes in Neuronal Networks in Different Scales. PLoS ONE 7(7): e41375. doi:10.1371/ journal.pone.0041375
Editor:Olaf Sporns, Indiana University, United States of America
ReceivedMay 9, 2012;AcceptedJune 20, 2012;PublishedJuly 27, 2012
Copyright:ß2012 Tang et al. This is an open-access article distributed under the terms of the Creative Commons Attribution License, which permits unrestricted use, distribution, and reproduction in any medium, provided the original author and source are credited.
Funding:This research is supported by 973 Project (2009CB320600), the National Natural Science Foundation of China (60825303, 60834003, 61021002, 11171125) and the Key Laboratory of Integrated Automation for the Process Industry (Northeastern University), the Fundamental Research Funds for the Central Universities of China (2011QN161), SUMO (EU), grants of the German Research Foundation (DFG) in the Research Group FOR 868 Computational Modeling of Behavioral, Cognitive, and Neural Dynamics and in the IRTG 1740 (DFG) and the Alexander von Humboldt Foundation of Germany. The funders had no role in study design, data collection and analysis, decision to publish, or preparation of the manuscript.
Competing Interests:Professor Ju¨rgen Kurths is a PLoS ONE Editorial Board member. This does not alter the authors’ adherence to all the PLoS ONE policies on sharing data and materials.
* E-mail: [email protected] (YT); [email protected] (JK)
Introduction
Synchronization is widely observed in many fields such as coupled nonlinear systems and complex networks [1–6]. Especial-ly, synchronization of distributed brain activity has been found to play an important role in neural information processing [7–11]. The experimentally observed brain activity, characterized by synchronization phenomena over a wide range of spatial and temporal scales, reflects the relevance for cognitive dysfunctions and pathophysiology [8]. Structurally, the analysis of the anatomical connectivity of the mammalian cortex has uncovered that large-scale neuronal networks display both high clustering and short pathlength [12,13]. The cortical network also shows a hierarchy of complex connectivity [12,14–17].
Extensive information in mammalian cortex, such as the brains of macaque monkeys and cats, has been collected [18–22]. Recently, hub regions, which are believed to play pivotal roles in the coordination of information flow in brain networks [22–24], have been identified using modern tools from complex networks [20,22]. The hub regions of cortical networks are analyzed using node degree, structural motif, path length and clustering coefficient distributions [22]. The results in [20] highlight the influence of the topological connectivity in the formation of synchronization, revealing a few cortical areas forming a Rich-Club connectivity pattern.
Control of complex networks is a hot topic, which is closely related to synchronization of complex networks [25–27]. Some vertices in complex networks serve as reference sites, leaders or pacemakers [28] and drive all the other vertices toward desired targets or evolutions and thus synchronization is achieved. It is valuable to study the controllability of complex networks, especially for cortical networks due to the technical [29,30] and neuroscience backgrounds [8,16,20]. By fully utilizing the structure of the networks, Lu et al. [27] found out the minimum number of controllers for the pinning synchronization control of complex network with general topology and derived some efficient criteria to judge the success of the designed pinning controllers, which are illustrated by small-world and scale-free networks to be valid and efficient for large-scale networks.
determine the locations of optimal driving sequences, which is crucial in to achieve the most efficient controlling performance.
Understanding a complex network’s structure is beneficial to understanding its function [33,34]. The past decade has witnessed an increasing of methods developed in this cross-disciplinary of physics community [35]. Structural properties in complex networks exist on both the microscopic level, arising from differences between single node properties, and the mesoscopic level resulting from features shared by groups of nodes. In [34], it is shown by benchmark problems how multiscale generative probabilistic exponential random graph models combined with efficient inference techniques can be used to achieve this separation of scales, resulting in an improved detection accuracy of latent classes. In [20,36], extensive numerical evidences are given to confirm the original claims that the microscopic and mesoscopic dynamics of synchronized patterns indeed follow different routes. In [33,37], mesoscopic analysis of networks is applied to exploratory analysis and data clustering.
In this study, we use the cortico-cortical network of cats’ brain, which is a weighted and directed network with community structure [22]. We aim to identify controlling regions (driver nodes) of brain networks of a cat, which is equivalent to enhancing controllability of cortical networks. By converting the problem of identification of controlling nodes into a single-objective optimization problem, a recent well-studied evolutionary computation method, the self-adaptive differential evolution (JaDE), is utilized to uncover the controlling nodes of the neuronal network. By utilizing JaDE, the controlling nodes are identified in microscopic, mesoscopic and macroscopic ways. In addition, the controlling nodes selected by JaDE are compared with the usual hubs [22], which are identified using node degree, betweenness centrality, closeness and node importance. In contrast to the usual hubs, most of the controlling nodes are selected from the nodes with a small degree. Our results reveal that the number of driver nodes plays a key role in the controllability of neuronal networks.
Results
Firstly, several examples are provided to verify the performance of JaDE [38]. JaDE is used to detect the controlling nodes/areas/ regions of the cortical network of cats’ brain in microscopic, mesoscopic and macroscopic ways, respectively.
We will analyze three different scales of controlling nodes/ areas/regions in the cortical network: (1) the microscopic scale refers to the mean degree, the mean betweenness centrality (BC) and the mean closeness of driver nodes that are calculated under different numbers l of driver nodes; (2) the mesoscopic scale corresponds to the controlling communities; (3) the macroscopic scale is the controlling nodes sorted according to their total times of serving as driver nodes.
In the following, the reliability of evolutionary computation methods is shown in terms of the convergence speed, the mean value and the best value of ten runs. In order to show that JaDE is suitable for identification of controlling nodes of the cortical network, we compare it with some well-known efficient evolution-ary computation approaches CLPSO [39], jDE [40], SaDE [41] and CoDE [42]. Also, JaDE is compared with some methods in complex networks theory.
Parameter Setting
The population sizes NP of all DEs and Particle Swarm Optimizations (PSOs) are set as 20 and the search range in each dimension is set to(0,N(see Materials and Methods). The
maximum fitness evaluation fe, max is set as fe, max~NPTD,
whereT~250 is a constant andD~2l is the size of problem dimension. If a large T is given, the accuracy of the solutions might be refined and the computation consumption is increased linearly and vice visa. Evolutionary computation algorithms will be repeated 10 times independently for eliminating random discrepancy. Algorithms will be terminated when they achieve fe, max.
Comparison of JaDE with Evolutionary Computation Methods
The best valueBand the mean valueM of the solutions in ten runs are listed in Table 1. The number of driver nodes is increased from 6 to 48 with a stepsize 6. B is used to describe the best solution of algorithms found in 10 times and M is used to represent the mean value of solutions in 10 times. Note that both the best value and the mean value of solutions are of great significance for measuring the reliability of algorithms, hence we use [43]
Q~pffiffiffiffiffiffiffiffiffiffiffiBM, ð1Þ
where bothBandMare involved. Obviously,Qshould be made as small as possible. Therefore, we also sortQof five algorithms in an ascending way under differentland their ordersPi. The mean
order of each algorithm is calculated as follows
Qm~
1 8
X8
i~1
Pi,(l[f6,12,18,24,30,36,42,48g), ð2Þ
and is also listed in Table 1. Based on the mean orderQm, the final
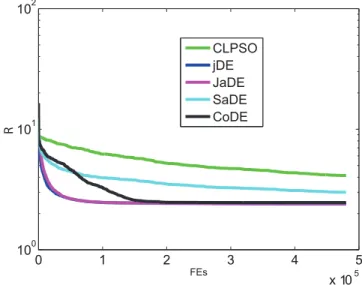
rank of five algorithms is obtained in Table 1 (See ‘‘Score’’). Table 1 and Fig. 1 show that JaDE, CoDE and jDE perform better than the other two algorithms in terms of both search speed and convergence rate. From Table 1, JaDE ranks first and has good reliability of finding potential optimum with a satisfactory convergence speed. It is worth mentioning that JaDE is equipped with an elitism approach. Therefore, JaDE is able to find the global optimum whenfe, max??. In reality, it is unreasonable to
run an algorithm with infinite generations. However, the performance of JaDE is confirmed by our simulation results (Table 1 and Fig. 1). Furthermore, a series of scientific experiments in [38] reveal that JaDE is a powerful and efficient algorithm for handling real-world optimization problems. In the following, JaDE is adopted to all the following simulations.
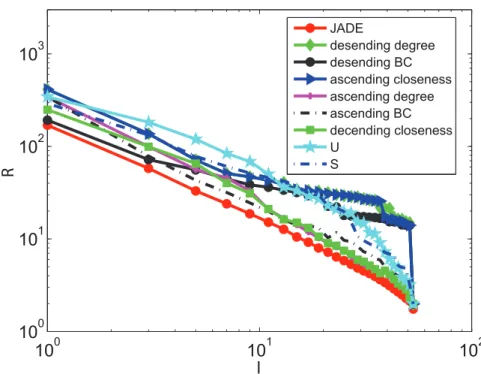
Comparison of JaDE with Network-based Methods JaDE is compared with some other schemes (See Materials and Methods) from complex networks in terms of enhancement of controllability of the cortical network. The best solutions in 10 runs of JaDE under differentlare used to produce the following results. It is worth pointing out that one can run JaDE for one time due to its reliability, as confirmed above.
Figs. 2 and 3 show that JaDE always performs better than the other methods. Whenl is large, the degree descending strategy, the BC descending strategy and the closeness ascending strategy are getting worse. Conversely, the degree ascending strategy, the BC ascending strategy and the closeness descending strategy are becoming better. TheU andS-based strategies are intermediate among all the algorithms.
when applying JaDE, implying that it is easy to enhance controllability in the cortical network in terms of s. This phenomenon supports the finding in [44,45], in which the imaginary part of the eigenvalues of network connection matrix can be neglected to measuring synchronizability of complex networks. When minimizing R and increasing l, the controlla-bility of the cortical network is becoming better using all the methods. However, when minimizing s and increasing l, the controllability of the cortical network is getting better when only using JaDE, which is strongly different from the case of only minimizing R.
Controllability of the Cortical Network - a Microscopic Way
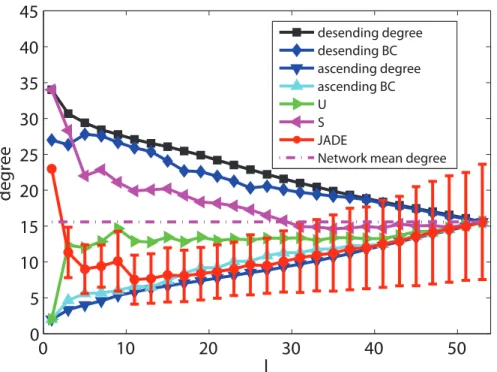
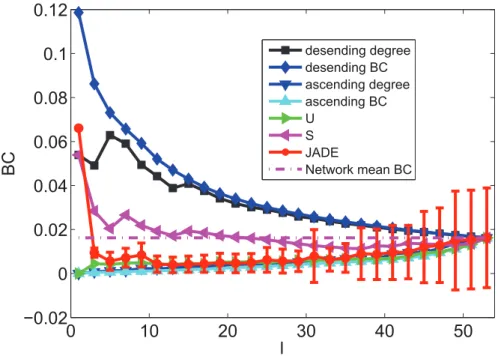
When only minimizingR, Figs. 4, 5, 6, 7, 8 and 9 depicts the mean values of degree, BC and closeness of driver nodes by various methods. Figs. 4, 6 and 8 show that, the driver nodes selected by JaDE are the nodes with a large degree, a small closeness and a large BC at the very beginning. Then, the driver nodes selected by JaDE abruptly change to the nodes with a small degree, a small BC and a large closeness, when increasing l.
Specially, when p~ l
N100% is near 20%, the mean value of degree of the controlling nodes selected by JaDE achieves its minimum value. After the mean value of degree of driver nodes reaches its minimum value, it increases gradually and finally attains the mean value of degree of the cortical network. As a whole, Fig. 4 shows that the mean values of degree of driver nodes display a concave shape as a function ofl. The standard deviation also becomes gradually larger when increasingl. The observed phenomenon indicates that, whenlis not large, driver nodes are usually selected from the nodes with a small degree and nearly no nodes with a large degree are chosen. Some similar phenomena are observed when the BC and closeness of the driver nodes are shown (Figs. 6 and 8). This finding is consistent with the work in [29], in which the nodes with a large degree should be avoided choosing as driver nodes. It is worth mentioning that there exists a major difference with the finding in [29], i. e., whenlis very small, the nodes with a large degree should be considered as driver nodes, as illustrated in Fig. 4.
Different from optimizingR, when minimizings, Figs. 5, 7 and 9 show that the mean values (degree, BC and closeness) of driver nodes selected by JaDE fluctuate around the mean values (degree, BC and closeness) of the network. The standard deviations (degree, BC and closeness) of driver nodes selected by JaDE keep stable whenl increases. All the findings indicate that one should select the nodes to make the mean values (degree, closeness and BC) of driver nodes around those of the network.
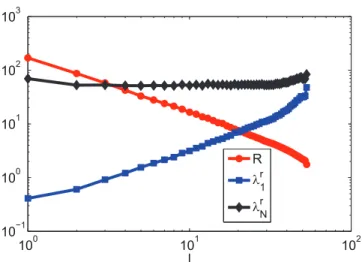
Finally, the relationship betweenR,lr1,lrNandl(See Materials and Methods) is investigated in terms of minimizingR. Fig. 10 shows thatR(l)!l{c, which can help to predictRwhen knowing
Table 1.Comparison among five algorithms for differentlof driver nodes of the cortical network with sizeN~53, see Fig. 1.
CLPSO jDE SaDE CoDE JaDE
Mean 29.062 28.1897 28.0292 28.0522 28.2284
l = 6 Best 28.0472 27.9476 27.9219 27.9043 27.9205
Q 28.5501 28.0684 27.9755 27.9782 28.074
order 5 3 1 2 4
Mean 14.3663 14.6584 13.8698 13.6785 13.9635
l = 12 Best 13.6478 13.9661 13.4678 13.4074 13.5064
Q 14.0025 13.9648 13.6673 13.5423 13.733
order 5 4 2 1 3
Mean 9.0286 9.1186 9.1235 8.6427 8.8656
l = 18 Best 8.7532 8.8488 8.7087 8.4847 8.5209
Q 8.8898 8.8572 8.9137 8.5634 8.6916
order 4 3 5 1 2
Mean 6.4847 6.283 6.5348 6.2908 6.1799
l = 24 Best 6.2396 6.1598 6.2228 6.0923 6.0876
Q 6.361 6.1699 6.3769 6.1908 6.1336
order 4 2 5 3 1
Mean 5.4265 4.7714 5.1642 4.9089 4.7174
l = 30 Best 4.9943 4.6826 5.041 4.6569 4.675
Q 5.2059 4.7 5.1023 4.7812 4.6961
order 5 2 4 3 1
Mean 4.8641 3.8225 4.2491 3.9336 3.8081
l = 36 Best 4.3501 3.7998 4.0914 3.7856 3.7968
Q 4.5999 3.8039 4.1695 3.8589 3.8025
order 5 2 4 3 1
Mean 4.2617 3.0524 3.5074 3.084 3.0436
l = 42 Best 3.8142 3.0412 3.3905 3.0244 3.0324
Q 4.0318 3.0424 3.4485 3.0541 3.038
order 5 2 4 3 1
Mean 4.13 2.3967 2.9995 2.4638 2.4119
l = 48 Best 3.8012 2.3825 2.8596 2.3702 2.3826
Q 3.9622 2.3972 2.9287 2.4166 2.3972
order 5 1 4 3 1
Qm 4.75 2.375 3.625 2.375 1.75
Score 5 2 4 2 1
The measurements ofQandQmare provided in (1) and (2). ‘‘Order’’ is obtained by sortingQand ‘‘Score’’ is obtained by sortingQmin an ascending way. doi:10.1371/journal.pone.0041375.t001
Figure 1. Performance of five evolutionary computation algorithms for controllability of the cortical network with different numbers l of driver nodes, when minimizing R
according to (8). The ‘‘FEs’’ here means the numbers of fitness evaluations of objective (8) or (9), whenl~48.
l. Moreover, in order to minimizeRunder a smalll,lrNshould be suppressed near a constant value and lr1 should be enlarged as much as possible. As l increases, both lrN and lr1 grow exponentially and the growth of the amplitude of lr1 is larger than that of lrN. Fig. 10 illustrates that the shape of R largely depends onlr1. The observed phenomena indicate thatlr1plays a more important role in minimizingRthanlrN does. Whenl~N, it is shown thatlr1&lrN, which makesR&1. In summary, when
minimizingR, enlarginglr1is more important than reducinglrN.
This finding is similar to our finding in [43], where only undirected complex networks are studied.
Controlling Nodes of the Cortical Network - a Macroscopic Way
By means of JaDE, we control the cortical network under differentlin terms of minimizingRands, respectively. Denote Figure 2. OptimizingRwith different pinning schemes under differentl.
doi:10.1371/journal.pone.0041375.g002
Figure 3. Optimizingswith different pinning schemes under differentl.
TR,i~ XN
l~1
dM(i), when minimizingR,
And
Ts,i~ XN
l~1
dM(i), when minimizings,
wheredM(i)can be referred to Materials and Methods.TR,iand
Ts,i indicate the times of each node selected as driver nodes in
terms of minimizingRands, respectively. The nodes with large TR,iandTs,iplay a vital role in controlling the cortical network.
Figure 4. The mean values of degree information of driver nodes with variouslunder different schemes when minimizingR.
doi:10.1371/journal.pone.0041375.g004
Figure 5. The mean values of degree information of driver nodes with variouslunder different schemes when minimizings.
doi:10.1371/journal.pone.0041375.g005
The controlling nodes of the cortical network are identified forN different times. Then, TR,i and Ts,i are sorted in a descending
way. The results are shown in Figs. 11, 12 and Table 2. Fig. 11 shows that when minimizingR, the standard deviation ofTR,iis
large, which means that some nodes in the cortical network, such as VPc, 2 and AMLS, are of great importance to be controlled. Some areas are negligible to be selected as driver nodes, such as 20a, CGp and 5AI. When minimizings, the standard deviation of Ts,i is small and nearly all the areas in the cortical network are
important for minimizing s. Hence, the controlling nodes are
different from the usual hubs, which are generally selected from nodes with a large degree [22]. In addition, the controlling nodes in the case of minimizingRare different from those in the case of minimizing s (Table 2). In order to show what factors have impacts on selection of controlling nodes,Dk~kin{koutof each
area in the cortical network is depicted in Table 2, wherekinand
koutcan be referred to Materials and Methods. Table 2 shows that,
when optimizing R, most of the controlling nodes are selected from the nodes with a largekin and a smallkout. Therefore, the
areas withDkw0should be considered as controlling nodes when Figure 6. The mean values of BC information of driver nodes with variouslunder different schemes when minimizingR.
doi:10.1371/journal.pone.0041375.g006
Figure 7. The mean values of BC information of driver nodes with variouslunder different schemes when minimizings.
minimizingR. Whereas the situation is more complicated, when minimizing s and there exist other factors which influence the selection of controlling nodes.
Controlling Communities of the Cortical Network - a Mesoscopic Way
In the following, we show which module/community is significant to be controlled in a mesoscopic way. According to Table 2, we sort and choose the nodes withTR,iandTs,iin the
first ½1,floor(1
3N) as controlling nodes (CN), ½floor(1
3N)z1,floor( 2
3N)as intermediate controlling nodes (ICN) and½floor(2
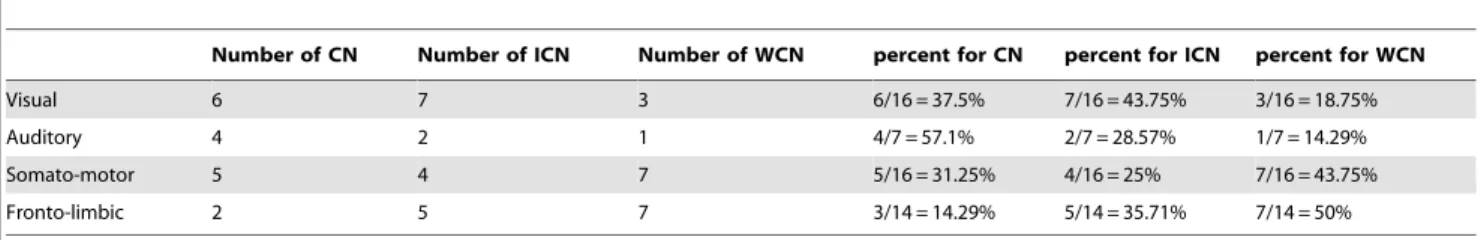
3N)z1,Nas weak controlling nodes (WCN), respectively. The number of CN, ICN and WCN in each community are presented in Tables 3 and 4. We also calculate the proportions of the locations of CN, ICN and WCN in each Figure 8. The mean values of closeness information of driver nodes with variouslunder different schemes when minimizingR.
doi:10.1371/journal.pone.0041375.g008
Figure 9. The mean values of closeness information of driver nodes with variouslunder different schemes when minimizings.
community, respectively. Tables 3 and 4 show that most of the areas in the community Auditory serve as CN. Specifically, when minimizingR, most of the areas in the community Visual work as CN and ICN, most of the areas in the community Somato-motor belong to ICN and WCN and most of the areas in the community Fronto-limbic serve as ICN and WCN. When minimizings, most of the areas in the community Visual work as ICN and WCN, most of the areas in the community Somato-motor belong to CN and ICN and most of the areas in the community Fronto-limbic serve as WCN. From the above observations, when minimizingR, the importance of each community is listed in a descending order: Auditory]Visual]Somato{motor]Fronto{limbic. When minimizing s, the importance of each community is listed in a descending order: Auditory]Somato{motor]Visual]
Fronto{limbic. Hence, although the community Auditory is sparsely connected with other communities and is the smallest community, it is the most important one to control the cortical network. The observed phenomenon indicates that community with sparse connection to other communities should be paid special attention to control the network efficiently.
Figure 10. The relationship betweenlog10R,log10l r 1,log10l
r
Nand
log10l by JaDE.
doi:10.1371/journal.pone.0041375.g010
Figure 11.TR,i of each node in cortical networks of cat.
Discussion
The cortical hubs are believed to play pivotal roles in the coordination of information processing in cortical networks. In previous studies, the identification and classification of hub regions have been analyzed in terms of node degree, structural motif, path length, clustering coefficient distributions and synchronization [20,22]. In these works, the intrinsic relationship between structural and functional connectivity is analyzed by using ensembles of neurons coupled by a cortical network of cats’ brain. By means of statistical methods, the crucial importance of nodes and clusters are revealed to analyze the separation and integration of sensory information in the cerebral cat cortex [24,46].
Additionally, one of the major challenges for human is to control natural systems or networks efficiently. As a typical natural network, identifying controlling nodes of a realistic anatomical network of cat cortical connectivity is of crucial significance to provide insights into avoiding abnormal synchronization in typical neural diseases [8,9,12]. In the light of previous studies, the problem of identification of controlling nodes of cortical networks remains open.
In this study, we have investigated the identification of controlling nodes in a network representing the connectivity among cortical areas in cats’ brain. The issue regarding controllability of the cortical network is converted into a combinatorial optimization problem [43]. A representative evolu-tionary computation method, JaDE, which is a self-adaptive and efficient algorithm to solve real-world optimization problems [38], is used to identify controlling nodes with an appropriate encoding scheme. The comparison with some well-known network-based methods and evolutionary computation methods is presented, revealing JaDE performs best among all the algorithms.
The controlling nodes of the cortical network are detected in microscopic, mesoscopic and macroscopic ways. Using such various scales will help us to understand the controllability of neuronal networks in depth. We have shown a close relationship of the number of driver nodes and the locations of the driver nodes, indicating a concave shape of the mean degree of driver nodes as an increase of the number of driver nodes. For low values of the number of driver nodes, the areas with a large degree govern the coordination dynamics of the network. As a whole, the nodes with a small degree are important to be selected as controlling regions, which is in contrast to the work in [22] and supports the finding in Figure 12.Ts,i of each node in cortical networks of cat.
[29,32]. More importantly, the most prominent community in the cortical network of cats is the community Auditory, which has sparse connections with other communities. The comparative results of two quantities for measuring controllability of complex networks are also investigated in detail.
The model and methods can be extended and improved in several ways. Firstly, it is meaningful to propose more efficient optimization methods to deal with controllability of cortical networks. Secondly, we have only focused on the highest level of cortical networks and thus large subnetworks [14,47,48] with other biologically realistic features [11,49,50] should be considered. Finally, the results should be applied to other realistic natural systems to illustrate controlling rules. The achievements would require further developments in neuroscience, in the theory of dynamical complex networks, in optimization methods as well as in control science.
Materials and Methods
Notations
Throughout this paper, l[½1,Ndenotes the number of driver
nodes of a network.dM(:)denotes the characteristic function of
the setM, i.e., dM(i)~1ifi[M; otherwise,d
M(i)~0. Define a
graph byG~½V,E, where V~f1, ,Ngdenotes the vertex set andE~fe(i,j)gthe edge set.
Cortico-cortical Network of Cats’ Brain
The cortico-cortical network of cats’ brain is a biological network that describes the anatomical connectivity of cats’ brain [18,19]. Here, we use a version of a dataset in [21]. The cat cerebral cortex can be divided into 53 cortical areas, linked by about 830 fibres of different densities into a weighted and directed complex network. It consists of four topological clusters that broadly agree with four functional cortical sub-divisions: visual cortex (16 areas), auditory (7 areas), somato-motor (16 areas) and fronto-limbic (14 areas). We also refer to the topological clusters as communities or modules. The community Auditory is sparsely connected while the communities Visual, Somato-Motor and Fronto-Limbic are densely connected among each other [16].
Model and Problem Formulation
We consider a reference evolution/state as follows:
da(t)
dt ~f(a(t)):
Table 2.Controlling times,Dkand their communities of each node when optimizingRands.
R S
Name TR,i Community Dk Name Ts,i Community Dk
VPc 50 Auditory 4 5Bm 43 Somato-motor 26
2 50 Somato-motor 7 20b 40 Visual 0
AMLS 48 Visual 7 AII 39 Auditory 1
21b 48 Visual 4 AI 37 Auditory 21
PS 48 Visual 7 PS 36 Visual 7
21a 47 Visual 5 5Am 36 Somato-motor 28
ALLS 45 Visual 4 PMLS 35 Visual 2
Sb 45 Frontolimbic 8 VPc 34 Auditory 4
Hipp 45 Frontolimbic 2 61 34 Somato-motor 0
AAF 44 Auditory 3 3a 33 Somato-motor 2
Tem 42 Auditory 2 6 m 33 Somato-motor 24
P 40 Auditory 3 Cga 33 Frontolimbic 213
SIV 40 Somato-motor 5 7 32 Visual 21
3a 39 Somato-motor 2 Tem 32 Auditory 2
1 39 Somato-motor 5 1 32 Somato-motor 5
DLS 38 Visual 1 20a 31 Visual 26
SII 38 Somato-motor 3 PFCI 31 Frontolimbic 210
PSb 38 Frontolimbic 3 ALLS 30 Visual 4
4 36 Somato-motor 3 SII 30 Somato-motor 3
PLLS 33 Visual 5 SSAi 30 Somato-motor 25
AII 33 Auditory 1 PFCMiI 30 Frontolimbic 23
RS 32 Frontolimbic 22 CGp 30 Frontolimbic 210
PMLS 30 Visual 2 36 30 Frontolimbic 9
20b 30 Visual 0 5AI 29 Somato-motor 210
VLS 29 Visual 22 5BI 28 Somato-motor 210
PFCMiI 29 Frontolimbic 23 3b 27 Somato-motor 1
Enr 29 Frontolimbic 21 4 g 27 Somato-motor 21
19 27 Visual 3 2 26 Somato-motor 7
3b 27 Somato-motor 1 4 26 Somato-motor 3
17 25 Visual 1 21b 25 Visual 4
SSAo 25 Somato-motor 25 SIV 25 Somato-motor 5
18 22 Visual 2 Ia 25 Frontolimbic 23
4 g 21 Somato-motor 21 Ig 25 Frontolimbic 5
AI 20 Auditory 21 AES 24 Visual 21
PFCI 20 Frontolimbic 210 AAF 24 Auditory 3
36 20 Frontolimbic 9 P 24 Auditory 3
61 19 Somato-motor 0 19 23 Visual 3
7 18 Visual 21 RS 23 Frontolimbic 22
SSAi 16 Somato-motor 25 Enr 23 Frontolimbic 21
5Bm 14 Somato-motor 26 21a 22 Visual 5
Ig 14 Frontolimbic 5 35 22 Frontolimbic 7
6 m 12 Somato-motor 24 17 21 Visual 1
PFCMd 11 Frontolimbic 26 VLS 21 Visual 22
AES 10 Visual 21 EPp 21 Auditory 26
Ia 9 Frontolimbic 23 AMLS 20 Visual 7
EPp 8 Auditory 26 PFCMd 20 Frontolimbic 26
5BI 7 Somato-motor 210 18 19 Visual 2
Table 2.Cont.
R S
Name TR,i Community Dk Name Ts,i Community Dk
Cga 6 Frontolimbic 213 DLS 18 Visual 1
35 5 Frontolimbic 7 SSAo 18 Somato-motor 25
5Am 4 Somato-motor 28 Sb 17 Frontolimbic 8
20a 3 Visual 26 PLLS 13 Visual 5
CGp 2 Frontolimbic 210 PSb 13 Frontolimbic 3
5AI 1 Somato-motor 210 Hipp 11 Frontolimbic 2
This equation is general, since many real-world systems such as social networks, biological systems and other natural systems can be modeled as differential equations [30].
Then, the following model of a diffusively coupled array of identical systems is considered as a general complex network:
dxi(t)
dt ~f(xi,t){k
XN
j~1
gijh(xj(t)),i[V, ð5Þ
where xi(t)~½xi1(t),xi2(t), ,xin(t)T[Rn(i~1,2 ,N) is the state vector of the ith node and f(xi,t)~½f1(xi,t), ,fn(xi,t)T
is a continuous vector function. k is the coupling gain of the network. In the coupling term, the node is connected through a generic output function h(xi(t)). The matrix G stands for the
connectivity about the cortical network topology. The graphGis supposed to be directed, weighted and simple (without self-loops and multiple edges). Let weighted and directed matrix G~½gijNi,j~1be the adjacency matrix of graphG, which is defined
as follows: for any pair i=j,gijv0if e(i,j)[E; otherwise,gij~0. gii~{PNj~1,j=igij(i~1,2, ,N). The adjacency matrixGcan
be converted into the Laplacian matrix L by neglecting the weights over the networks. For any pairi=j,lij~{1ife(i,j)[E;
otherwise,lij~0.lii~{PNj~1,j=ilij,(i~1,2, ,N). The output
degreekout(i)~{PNj~1,i=jlijof a nodeiis the number of efferent
connections that it projects to other nodes, and its input degree kin(i)~{PjN~1,i=jlji, is the number of the afferent connections it
receives. Denote by mi~mr
izjmmi(j~ ffiffiffiffiffiffiffiffi
{1 p
),i[V, the set of
eigenvalues of G and assume that they are ordered in such a way thatmr
1ƒmr2ƒ ƒmrN.
To control such a cortical network to the reference evolution a(t), feedback controllers are added to (5):
dxi(t)
dt ~f(xi,t){k
XN
j~1
gijh(xj(t))
{kdM(i)ci(h(a(t)){h(xi(t))),i[V, ð6Þ
where ci are control gains or coupling strengths. Suppose that
1ƒPNi~1dM(i)ƒN. We aim to lead the cortical network (5) toward the desired reference evolution a(t), i. e., x1(t)~x2(t)~ ~xN(t)~a(t).
By linear manipulations, the stability analysis of (6) can be transformed into the dynamics of N independent blocks in the parametersei~kli,i~1,2, ,N[26,51,52],
dji
dt ~½Jf(a(t)){eiJ(h(a(t)))ji,i~2, ,N, ð7Þ
whereJf(a(t))andJ(h(a(t)))are the Jacobians of the functionsf andhcalculated around the time varying reference evolutiona. li~lrizjl
m
i,i[V are the eigenvalues of the N-dimensional
structural matrix
W~
W11 g12 . . . g1N g21 W22 . . . g2N
. . . . . . P . . .
gN1 gN2 . . . WNN
0 B B B B @ 1 C C C C A ,
where Wii~giizdM(i)ci,i[V. Without loss of generality, we
assume thatlriare sorted aslr1ƒlr2ƒ ƒlrN.
As pointed out in [25,26], through above transformation, the problem of controllability of complex networks is converted into synchronizability of networks. Similar to the analysis method of checking synchronizability of networks, the enhancement of controllability can be characterized by reducing the eigenratio.
R~l
r N
lr1,
and make
Table 3.The proportions of controlling nodes in four communities when minimizingR.
Number of CN Number of ICN Number of WCN percent for CN percent for ICN percent for WCN
Visual 6 7 3 6/16 = 37.5% 7/16 = 43.75% 3/16 = 18.75%
Auditory 4 2 1 4/7 = 57.1% 2/7 = 28.57% 1/7 = 14.29%
Somato-motor 5 4 7 5/16 = 31.25% 4/16 = 25% 7/16 = 43.75%
Fronto-limbic 2 5 7 3/14 = 14.29% 5/14 = 35.71% 7/14 = 50%
doi:10.1371/journal.pone.0041375.t003
Table 4.The proportions of controlling nodes in four communities when minimizings.
Number of CN Number of ICN Number of WCN percent for CN percent for ICN percent for WCN
Visual 5 3 8 5/16 = 31.25% 3/16 = 18.75% 8/16 = 50%
Auditory 4 1 2 4/7 = 57.1% 2/7 = 14.29% 1/7 = 28.57%
Somato-motor 6 9 1 6/16 = 37.5% 9/16 = 56.25% 1/16 = 6.25%
Fronto-limbic 2 5 7 2/14 = 14.29% 5/14 = 35.71% 7/14 = 50%
s~maxflmig,
as small as possible [25,44], i. e., the smaller theRandsare, the easier the network is controllable. Previous works have shown that s can be neglected, since usuallys is very small and has only minor effects on synchronizability/controllability of networks [45]. We also considersand illustrate the impact ofson controllability, sincesis important when one considers some special graphs, e. g., normalized Laplacian graph.
It should be noted that the selection of driver nodes is a typical combinatorial optimization problem [43], where the locations of driver nodes are discrete variables, and the design of control gains is a continuous optimization problem. Taking the locations of driver nodes and their control gains into account together, the controllability of networks can be viewed as a multimodal optimization problem.
Here, minimizingRands by determining locations of driver nodesdM(i)and designingci(i[M)can be formulated as follows:
min dM(i),ciR
~l
r N
lr1,(i[M): ð8Þ
min dM(i),cis
~maxflmig,(i[M)
: ð9Þ
From the above equations, we study the controllability of cortical networks by minimizingRands, respectively. Evolution-ary computation methods are employed to study the controllability and identify controlling regions.
The Strategies for Determining the Locations of Driver Nodes
Several well-known strategies for determining the locations of driver nodes or controlling nodes are illustrated as follows [43].
(1) Degree-based strategies. Degree-based pinning schemes are the most popular methods to select potential driver nodes, in which the locations of driver nodes are chosen according to degree information of networks in a decreasing or an ascending way [25,30,53]. Here, the two schemes are called ascending and descending degree-based strategies, respective-ly. The output degree kout is used to provide degree
information.
(2) Betweenness centrality (BC)-based strategies. Similar with the degree-based scheme, we consider descending and ascending BC-based strategies.
(3) Closeness-based strategies. Two kinds of closeness-based strategies, i. e. descending and ascending closeness-based strategies are taken into account.
(4) Node importance-based strategies. Since the controlla-bility of the cortical network is mainly related to its eigenvalues, it is interesting to determine the locations of driver nodes by considering their importance in the network [54]. We analyze two measures of node importance for the
cortical network. The first one is to minimizem
r N
mr 2
ofGupon
sequential removal of nodes, which is calledU~m
r N
mr 2
-based
strategy. The other one is to minimizeS~maxfmm igofG
upon sequential removal of nodes, which is calledS-based strategy. It should be noted thatUandSare usually used to measure synchronizability performance of complex networks [44].
(5) Evolutionary algorithm-based strategies. Using an appropriate encoding scheme, differential evolution (DE) is used to select driver nodes and design control gains. Evolutionary algorithms have been successfully used in the synchronization of two coupled systems in [55], the coordination of unmanned aircraft vehicle [43] and networks topology with optimal synchronizability [56]. Here, adaptive differential evolution is adopted to identify the controlling nodes [38].
In the degree-based, the BC-based, the closeness-based and the node importance-based strategies, control gains in all the nodes are considered to be identical and one can tune the control gains of driver nodes in the cortical network gradually with a step size 0.1, like [25,26].
Differential Evolution and its Encoding Scheme
In order to determine the locations of driver nodes in the cortical network and design their control gains, an appropriate encoding scheme is used according to [43]. In addition, equipped with this encoding scheme, JaDE [38] is used to detect the controlling nodes/areas/regions of the cortical network of cats’ brain in microscopic, mesoscopic and macroscopic ways, respec-tively.
Author Contributions
Conceived and designed the experiments: YT HJG JK. Performed the experiments: YT HJG. Analyzed the data: YT WZ. Contributed reagents/ materials/analysis tools: YT WZ JK. Wrote the paper: YT HJG JK.
References
1. Pikovsky A, Rosenblum M, Kurths J (2001) Synchronization: A Universal Concept in Nonlinear Sciences. Cambridge University Press, Cambridge, England.
2. Zou W, Zhan M (2009) Partial time-delay coupling enlarges death island of coupled oscillators. Physical Review E 80: 065204(R).
3. Zou W, Tang Y, Li L, Kurths J (2012) Oscillation death in asymmetrically delay-coupled oscillators. Physical Review E 85: 046206.
4. Go´mez-Garden˜es J, Go´mez S, Arenas A, Moreno Y (2011) Explosive synchronization transitions in scale-free networks. Phys Rev Lett 106: 128701. 5. Ravoori B, Cohen A, Sun J, Motter A, Murphy T, et al. (2011) Robustness of
optimal synchro- nization in real networks. Phys Rev Lett 107: 034102. 6. Zhang W, Tang Y, Fang J, Zhu W (2011) Exponential cluster synchronization of
impulsive delayed genetic oscillators with external disturbances. Chaos 21: 043137.
7. Engel A, Fries P, Singer W (2001) Rapid feature selective neuronal synchronization through correlated latency shifting. Nat Rev Neurosc 2: 704– 716.
8. Uhlhaas P, Singer W (2006) Neural synchrony in brain disorders: Relevance for cognitive dysfunctions and pathophysiology. Neuron 52: 155–168.
9. Uhlhaas P, Pipa G, Lima B, Melloni L, Neuenschwander S, et al. (2009) Neural synchrony in cortical networks: history, concept and current status. Frontiers Int Neurosc 3: 17.
10. Schinkel S, Zamora G, Dimigen O, Sommer W, Kurths J (2011) Functional network analysis reveals differences in the semantic priming task. Journal of Neuroscience Methods 197: 333–339.
11. Kopell N, Ermentrout B (2004) Chemical and electrical synapses perform complementary roles in the synchronization of interneuronal networks. Proc Natl Acad Sci(USA) 101: 15482–15487.
13. Rubinov M, Sporns O (2010) Complex network measures of brain connectivity: Uses and interpretations. NeuroImage 52: 1059–1069.
14. Zhou C, Zemanova´ L, Zamora-Lo´pez G, Hilgetag C, Kurths J (2006) Hierarchical organization unveiled by functional connectivity in complex brain networks. Phys Rev Lett 97: 238103.
15. Zemanova´ L, Zhou C, Kurths J (2006) Structural and functional clusters of complex brain networks. Physica D 224: 202–212.
16. Zhou C, Zemanova´ L, Hilgetag C, Kurths J (2007) Structurefunction relationship in complex brain networks expressed by hierarchical synchroniza-tion. New J Phys 9: 178.
17. Mu¨ller-Linow M, Hilgetag C, Hu¨tt M (2008) Organization of excitable dynamics in hierarchical biological networks. PLoS Comput Biol 4: e1000190. 18. Scannell J, Young M (1993) The connectional organization of neural systems in
the cat cerebral cortex. Curr Biol 3: 191–200.
19. Scannell J, Blakemore C, Young M (1995) Analysis of connectivity in the cat cerebral cortex. J Neurosc 15: 1463–1483.
20. Go´mez-Garden˜es J, Zamora-Lo´pez G, Moreno Y, Arenas A (2010) From modular to centralized organization of synchronization in functional areas of the cat cerebral cortex. PLoS ONE 5: e12313.
21. Hilgetag C, Burns G, O’Neill M, Scannell J, Young M (2000) Anatomical connectivity defines the organization of clusters of cortical areas in the macaque monkey and the cat. Phil Trans R Soc London B 355: 91–110.
22. Sporns O, Honey C, Kotter R (2007) Identification and classification of hubs in brain networks. PLoS ONE 10: e1049.
23. Morgan R, Soltesz I (2008) Nonrandom connectivity of the epileptic dentate gyrus predicts a major role for neuronal hubs in seizures. Proc Natl Acad Sci(USA) 105: 6179–184.
24. Zamora-Lo´pez G, Zhou C, Kurths J (2010) Cortical hubs form a module for multisensory integration on top of the hierarchy of cortical networks. Frontiers in Neuroinformatics 4: 1–12.
25. Sorrentino F, Bernardo M, Garofalo F, Chen G (2007) Controllability of complex networks via pinning. Phys Rev E 75: 046103.
26. Sorrentino F (2007) Effects of the network structural properties on its controllability. Chaos 17: 033101.
27. Lu J, Ho D, Wang Z (2009) Pinning stabilization of linearly coupled stochastic neural networks via minimum number of controllers. IEEE Trans on Neural Networks 20: 1617–1629.
28. Ren W, Beard R (2008) Distributed Consensus in Multi-vehicle Cooperative Control, Communications and Control Engineering Series. Springer-Verlag, London.
29. Liu Y, Slotine J, Baraba´si A (2011) Controllability of complex networks. Nature 473: 167.
30. Egerstedt M (2011) Degrees of control. Nature 473: 158–159.
31. Wang X, Chen G (2002) Pinning control of scale-free dynamical networks. Physica A 310: 521–531.
32. Gutie´rrez R, Sendin˜a-Nadal I, Zanin M, Papo D, Boccaletti S (2008) Targeting the dynamics of complex networks. Scientific reports 2: 396.
33. Go´mez S, Jensenn P, Arenas A (2009) Analysis of community structure in networks of correlated data. Physical Review E 80: 016114.
34. Reichardt J, Alamino R, Saad D (2011) The interplay between microscopic and mesoscopic structures in complex networks. PLoS ONE 6: e21282.
35. Fortunato S (2010) Community detection in graphs. Physics Reports 486: 75– 174.
36. Go´mez-Garden˜es J, Moreno Y, Arenas A (2011) Evolution of microscopic and mesoscopic synchronized patterns in complex networks. CHAOS 21: 016105. 37. Granell C, Go´mez S, Arenas A (2011) Mesoscopic analysis of networks:
Applications to exploratory analysis and data clustering. CHAOS 21: 016102. 38. Zhang JQ, Sanderson AC (2009) Jade: adaptive differential evolution with
optional external archive. IEEE Trans on Evolutionary Computation 13: 945– 958.
39. Liang J, Suganthan P, Baskar S (2006) Comprehensive learning particle swarm optimizer for global optimization of multimodal functions. IEEE Trans on Evolutionary Computation 10: 281–295.
40. Brest J, Greiner S, Boskovic B, Mernik M, Zumer V (2006) Self-adapting control parameters in differential evolution: A comparative study on numerical benchmark problems. IEEE Trans on Evolutionary Computation 10: 646–657. 41. Qin A, Huang V, Suganthan P (2009) Differential evolution algorithm with strategy adaptation for global numerical optimization. IEEE Trans on Evolutionary Computation 13: 398–417.
42. Wang Y, Cai Z, Zhang Q (2011) Differential evolution with composite trial vector generation strategies and control parameters. IEEE Trans on Evolution-ary Computation 15: 55–66.
43. Tang Y, Gao H, Kurths J, Fang J (2012) Evolutionary pinning control and its application in UAV coordination. IEEE Trans On Industrial Informatics, accepted.
44. Hwang DU, Chavez M, Amann A, Boccaletti S (2005) Synchronization in complex networks with age ordering. Phys Rev Lett 94: 138701.
45. Son S, Kim B, Hong H, Jeong H (2009) Dynamics and directionality in complex networks. Phys Rev Lett 103: 228702.
46. Zhou C, Motter A, Kurths J (2006) Universality in the synchronization of weighted random networks. Phys Rev Lett 96: 034101.
47. Gao J, Buldyrev S, Havlin S, Stanley H (2011) Robustness of a network of networks. Phys Rev Lett 107: 195701.
48. Sun X, Lei J, Perc M, Kurths J, Chen G (2011) Burst synchronization transitions in a neuronal network of subnetworks. Chaos 21: 016110.
49. Volman V, Perc M, Bazhenov M (2011) Gap junctions and epileptic seizures -two sides of the same coin? PLoS ONE 6: e20572.
50. Wang Q, Chen G, PercM(2011) Synchronous bursts on scale-free neuronal networks with attractive and repulsive coupling. PLoS ONE 6: e15851. 51. Pecora LM, Carroll TL (1998) Master stability functions for synchronized
coupled systems. Phys Rev Lett 80: 2109–2112.
52. Barahona M, Pecora L (2002) Synchronization in small-world systems. Phys Rev Lett 80: 054101.
53. Wang X, Chen G (2002) Synchronization in scale-free dynamical networks: Robustness and fragility. IEEE Trans Circuits Syst I: Regular Papers 49: 54–62. 54. Restrepo J, Ott E, Hunt B (2006) Characterizing the dynamical importance of
network nodes and links. Phys Rev Lett 97: 094102.
55. Tang Y, Wang ZD, Wong WK, Kurths J, Fang J (2011) Multiobjective synchronization of coupled systems. Chaos 21: 025114.