CPD
9, 245–267, 2013Vegetation responses to interglacial warming
A. V. Lozhkin and P. M. Anderson
Title Page
Abstract Introduction
Conclusions References
Tables Figures
◭ ◮
◭ ◮
Back Close
Full Screen / Esc
Printer-friendly Version
Interactive Discussion
Discussion
P
a
per
|
Dis
cussion
P
a
per
|
Discussion
P
a
per
|
Discussio
n
P
a
per
|
Clim. Past Discuss., 9, 245–267, 2013 www.clim-past-discuss.net/9/245/2013/ doi:10.5194/cpd-9-245-2013
© Author(s) 2013. CC Attribution 3.0 License.
Climate of the Past Discussions
This discussion paper is/has been under review for the journal Climate of the Past (CP). Please refer to the corresponding final paper in CP if available.
Vegetation responses to interglacial
warming in the Arctic, examples from
Lake El’gygytgyn, northeast Siberia
A. V. Lozhkin1and P. M. Anderson2 1
Northeast Interdisciplinary Scientific Research Institute, Far East Branch, Russian Academy of Sciences, 16 Portovaya Street, Magadan, 685000, Russia
2
Earth & Space Sciences and Quaternary Research Center, University of Washington, Seattle, 98195-1310, USA
Received: 28 August 2012 – Accepted: 3 September 2012 – Published: 15 January 2013
Correspondence to: P. M. Anderson ([email protected])
CPD
9, 245–267, 2013Vegetation responses to interglacial warming
A. V. Lozhkin and P. M. Anderson
Title Page
Abstract Introduction
Conclusions References
Tables Figures
◭ ◮
◭ ◮
Back Close
Full Screen / Esc
Printer-friendly Version
Interactive Discussion
Discussion
P
a
per
|
Dis
cussion
P
a
per
|
Discussion
P
a
per
|
Discussio
n
P
a
per
|
Abstract
Palynological data from Lake El’gygytgyn reveal responses of plant communities to a range of climatic conditions that can help assess the possible impact of global warm-ing on arctoboreal ecosystems. Vegetation associated with climatic optima suggests two types of interglacial responses: one is dominated by deciduous taxa (the post-5
glacial thermal maximum (PGTM) and marine isotope stage (MIS5)) and the second
by evergreen conifers (MIS11, MIS31). The MIS11 forests show a similarity to
Picea-Larix-Betula-Alnus forests of Siberia. While dark coniferous forest also characterizes
MIS31, the pollen taxa show an affinity to the modern boreal forest of the lower Amur
valley in the Russian Far East. Despite vegetation differences during the thermal
max-10
ima, all four glacial-interglacial transitions are alike, being dominated by deciduous
woody taxa. InitiallyBetula shrub tundra established and was replaced by tundra with
tree-sized shrubs (PGTM),Betula woodland (MIS5), or Betula-Larix (MIS11, MIS31)
forest. The consistent occurrence of deciduous forest and/or high shrub tundra in all interglaciations as they approach or achieve maximum warmth underscores the sig-15
nificance of this biome for modeling efforts. The El’gygytgyn data also suggest the
possible elimination or massive reduction of arctic plant communities under extreme warm-earth scenarios.
1 Introduction
Marine and ice cores contain vital data that document fluctuations in past climate and 20
provide insight into the possible causes of the observed paleoclimatic variability. How-ever, such records cannot provide information on the responses of biotic systems to those changes. Most paleo-biotic records do not have the longevity, continuity, or tem-poral resolution of ocean and ice cores, which limits the comparison of long-term trends in biological and climatic data. Lake El’gygytgyn (Lake E), whose basin was created 25
CPD
9, 245–267, 2013Vegetation responses to interglacial warming
A. V. Lozhkin and P. M. Anderson
Title Page
Abstract Introduction
Conclusions References
Tables Figures
◭ ◮
◭ ◮
Back Close
Full Screen / Esc
Printer-friendly Version
Interactive Discussion
Discussion
P
a
per
|
Dis
cussion
P
a
per
|
Discussion
P
a
per
|
Discussio
n
P
a
per
|
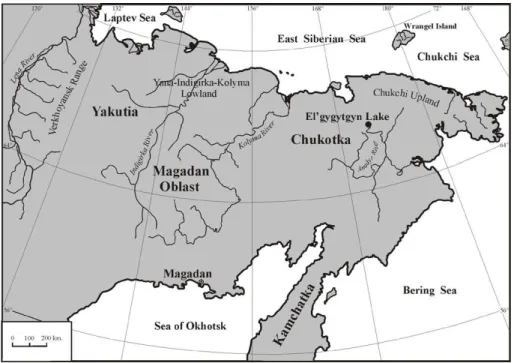
continuous sedimentary record dating back∼2.8 Ma (Melles et al., 2012). The
loca-tion of the lake in arctic Chukotka (Fig. 1) provides a unique look into the response of terrestrial ecosystems at northern high latitudes to a broad range of warm and cold conditions.
Several biological proxies have been examined in cores from Lake E (Brigham-Grette 5
et al., 2007; Melles et al., 2012); we present here interpretations of past vegetation based on palynological data. Previous research has shown that cool, dry intervals are clearly marked in the Lake E record by a dominance of herb pollen (particularly
Poaceae) and usually higher values of Selaginella rupestris spores (Lozhkin et al.,
2007; Matrosova, 2009). These spectra contrast to interglacial assemblages where 10
arboreal pollen is at a maximum, herbaceous taxa are low, and spores are often
dom-inated by Sphagnum. Continued research on a newly raised core shows that
inter-glacial assemblages display vegetation and climatic variability both within and between isotope stages. For example, marine isotope stage (MIS) 11.3 and MIS31 have been
described as “super interglaciations” with maximum summer temperatures∼4◦to 5◦C
15
warmer than either MIS5.5 or the postglacial thermal maximum (PGTM; Melles et al., 2012).
These warmer-than-present intervals are of particular interest for understanding pos-sible responses and feedbacks related to increasing global temperatures (e.g., Harri-son et al., 1995; Kaplan et al., 2003). Both conceptual and quantitative models have 20
considered two types of vegetation responses at northern high latitudes; one suggests the expansion of evergreen conifer forest northward across North America and much of Eurasia (e.g., Claussen, 1996; Kaplan et al., 2003), whereas the second postulates a dominance of broadleaf deciduous forest in current areas of tundra (e.g., Bonan et al., 1990; Chapin and Starfield, 1997). Paleobotanical data are one means by which 25
these alternative scenarios may be evaluated. Although analysis continues on Lake E,
sufficient palynological data are available to compare the vegetation responses during
CPD
9, 245–267, 2013Vegetation responses to interglacial warming
A. V. Lozhkin and P. M. Anderson
Title Page
Abstract Introduction
Conclusions References
Tables Figures
◭ ◮
◭ ◮
Back Close
Full Screen / Esc
Printer-friendly Version
Interactive Discussion
Discussion
P
a
per
|
Dis
cussion
P
a
per
|
Discussion
P
a
per
|
Discussio
n
P
a
per
|
2 Methods
One to two cm3 sediment samples were processed for palynological analysis
follow-ing standard procedures used in preparfollow-ing organic-poor samples (PALE, 1994). Sam-ples for MIS1-MIS2 and MIS4-MIS6 are from core PG1352, whereas core D1 provided samples from MIS11-MIS12, and MIS 31. Pollen sums for interglacial spectra gener-5
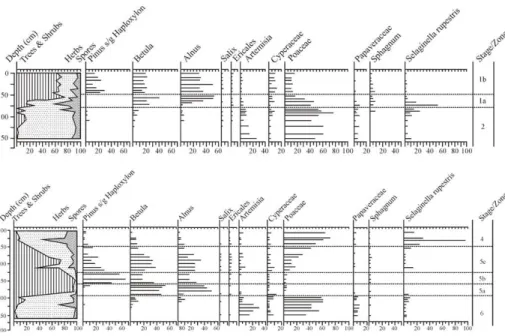
ally exceed 500 identified pollen grains. Percentages of individual taxa are based on a sum of all arboreal, nonarboreal, and unidentified pollen grains. Subsum percent-ages on the left of the diagrams (Figs. 2–4) are calculated from a total of pollen and spores. Pollen zonation was done subjectively using changes in percentages of major
taxa. Although many palynologists have differentiated tree and shrubBetulabased on
10
morphology and/or size, blind tests in our laboratories of modern reference materials suggest that these criteria are inconsistent and unreliable; thus we do no separate the Betulapollen.Picea obovatapollen is classified withinPiceasect. Eupicea,Picea aja-nensiswithinPiceasect. Omorica,Pinus sylvestris withinPinussubg. Diploxylon, and Pinus pumila and Pinus sibirica within Pinus subg. Haploxylon. Following traditional 15
palynological usage,Duschekia fruticosais referred to as shrub Alnus. All other plant
taxonomy follows Cherepanov (1995).
The age model for the El’gygytgyn record is based on paleomagnetic stratigraphy and tuning of additional proxy data to the marine isotope stratigraphy and to variations in regional insolation (see Melles et al., 2012). Because pollen zones do not always 20
CPD
9, 245–267, 2013Vegetation responses to interglacial warming
A. V. Lozhkin and P. M. Anderson
Title Page
Abstract Introduction
Conclusions References
Tables Figures
◭ ◮
◭ ◮
Back Close
Full Screen / Esc
Printer-friendly Version
Interactive Discussion
Discussion
P
a
per
|
Dis
cussion
P
a
per
|
Discussion
P
a
per
|
Discussio
n
P
a
per
|
3 Modern setting
Lake E (67.5◦N, 172◦E; ∼500 m a.s.l.) has a diameter of ∼12 km and a maximum
depth of 170 m (Melles et al., 2012). The local vegetation is a mix of discontinuous and
continuous herb-lichen tundra (Kozhevnikov, 1993). Shrubs (Salix krylovii, S.
alaxen-sis, Betula exilis) are not abundant and limited to protected sites in valleys and saddles 5
within the crater walls and along the outlet valley. The vegetation in the Lake E catch-ment is more barren than in the surrounding Chukchi Uplands, because of unusual soil qualities associated with the meteor impact crater. The Uplands are dominated
by shrub tundra that includes Betula exilis, Duschekia fruticosa (shrubAlnus), Pinus
pumila, Salix, and Ericales.Larix gmelinii treeline is located∼150 to the southwest of
10
the lake, but the main body of the forest is found at∼300 km distance. Modern pollen
studies indicate that the pollen rain in Lake E is more indicative of regional than
lo-cal vegetation with up to 60 % of the pollen (Alnus, Betula, Pinus pumila) being blown
in from the Chukchi Upland (Lozhkin et al., 2001). The over-representation of Upland vegetation, which reflects regional conditions, strengthens the use of the Lake E pollen 15
record for paleoclimatic interpretations. Estimated mean climatic values are: annual
temperature−13.5 to−14◦C; July temperature 8.8 to 9◦C; January temperature −31
to−32◦C; annual precipitation 255 mm (Melles et al., 2012).
4 Interglacial vegetation of Lake E and the Chukchi Uplands
While interglaciations share similarities in boundary conditions (e.g., high summer in-20
CPD
9, 245–267, 2013Vegetation responses to interglacial warming
A. V. Lozhkin and P. M. Anderson
Title Page
Abstract Introduction
Conclusions References
Tables Figures
◭ ◮
◭ ◮
Back Close
Full Screen / Esc
Printer-friendly Version
Interactive Discussion
Discussion
P
a
per
|
Dis
cussion
P
a
per
|
Discussion
P
a
per
|
Discussio
n
P
a
per
|
4.1 PGTM
High percentages ofBetulaandAlnuscharacterize the late glacial and Early Holocene
pollen assemblages at Lake E (Fig. 2; pollen zone 1a), an assemblage that is com-mon across Northeast Siberia (Lozhkin et al., 1993). Statistical comparisons to mod-ern pollen and related climatic parameters reveal mean July temperatures were per-5
haps 2–4◦C warmer than present between ∼8600 and 10 70014C yr BP (Lozhkin et
al., 2007). Analog analysis also indicates warm January temperatures and increased July precipitation as compared to modern. These conclusions are based on “possible pollen analogs” to southern Beringia shrub tundra. Macrofossil evidence from the Yana-Indigirka-Kolyma Lowland (Fig. 1) and northern Chukotka documents the occurrence 10
of tree or tree-sized shrubs ofSalix andAlnus beyond present-day treeline (Lozhkin,
1993). Using both pollen and plant macrofossils to enhance understanding of plant functional types, Edwards et al. (2005) concluded that an unusual biome of decidu-ous forest and forest-tundra characterized Beringia during the PGTM. In the Chukchi Uplands, vegetation was probably a mosaic of forest and tundra communities including 15
gallery forests of treeBetulaand perhapsSalix, and possibly stands of deciduous trees
in protected sites within the interfluves. Other areas likely supported high shrub tundra.
4.2 MIS5
Because MIS5 vegetation has been described elsewhere (Lozhkin et al., 2007), we focus here on MIS5.5. Like the PGTM, the MIS5 climatic optimum (Fig. 2; pollen zone 20
5a) is characterized by high percentages ofBetula and Alnuspollen. The dominance
of these woody taxa suggests that the regional vegetation during MIS5.5 was also a mix of deciduous forest and high shrub tundra. The reduced herb percentages as
compared to the PGTM indicate a more extensive and/or denser population ofBetula,
Alnus,and possiblySalix in the regional vegetation. The spectra may also indicate a 25
CPD
9, 245–267, 2013Vegetation responses to interglacial warming
A. V. Lozhkin and P. M. Anderson
Title Page
Abstract Introduction
Conclusions References
Tables Figures
◭ ◮
◭ ◮
Back Close
Full Screen / Esc
Printer-friendly Version
Interactive Discussion
Discussion
P
a
per
|
Dis
cussion
P
a
per
|
Discussion
P
a
per
|
Discussio
n
P
a
per
|
Plant macrofossils of last interglacial age have been found throughout Northeast
Siberia (Lozhkin and Anderson, 1995). Although chronological control is insufficient to
assign sites specifically to MIS5.5, current understanding of the valley stratigraphies
suggest they are from MIS5. The reconstructions vary from openBetulaforest (Anadyr
basin; Fig. 1), to Larix forest with tree Betula, tree Alnus, and Pinus pumila
(north-5
ern Chukotka, upper Kolyma and Indigirka basins; Yana-Indigirka-Kolyma Lowland) to Larixforest withPicea(upper Kolyma and Indigirka basins; northern Lowlands;
north-ern Okhotsk sea coast). AlthoughPiceamay have extended almost to the coast of the
East Siberian Sea, the Lake E record raises the possibility that these sites may actu-ally be from MIS11 (see below). Nonetheless, the preponderance of woody remains 10
and nature of the MIS5.5 pollen spectra at Lake E strongly indicate the extensive pres-ence of forest in Northeast Siberia and likely establishment of deciduous forest in the Chukchi Uplands. Analog-based analyses of the pollen data indicate the prevalence of warmer and wetter conditions as compared to modern (Lozhkin et al., 2007; Melles et al., 2012).
15
4.3 MIS11
Three vegetation types characterize MIS11 (Fig. 3), and all types indicate greater sum-mer warmth and annual precipitation as compared to modern (Melles et al., 2012). However, the history of MIS11 diverges dramatically from the vegetation succession
seen in MIS5 and MIS1 (i.e.,Betula-Alnus-Pinus pumila).
20
The earliest climatic amelioration in MIS11 is indicated by high percentages of
Be-tula and decreasing percentages of Poaceae pollen (pollen zone 11a). In contrast to
the MIS6/MIS5 and MIS2/MIS1 transitions, Betula dominated vegetation appears to
persist for a longer time in MIS11 prior to the arrival of Alnus. Lower zone 11a,
rep-resenting the earliest effects of warming, was likely characterized by Betula shrub
25
tundra with Salix and Ericales. Possibly shrubs achieved large growth forms as
oc-curred in the PGTM.Betula pollen increases to 45–60 % in the mid-to-upper levels of
CPD
9, 245–267, 2013Vegetation responses to interglacial warming
A. V. Lozhkin and P. M. Anderson
Title Page
Abstract Introduction
Conclusions References
Tables Figures
◭ ◮
◭ ◮
Back Close
Full Screen / Esc
Printer-friendly Version
Interactive Discussion
Discussion
P
a
per
|
Dis
cussion
P
a
per
|
Discussion
P
a
per
|
Discussio
n
P
a
per
|
(Anderson et al., 2002; Lozhkin et al., 2002). These values more closely approximate modern surface samples from Kamchatka (Lozhkin and Anderson, unpublished data)
where forests ofBetula ermanii are common. In Alaska, highest Betula percentages
(>40 %) also occur in interior forests, whereBetula papyriferais found in valleys and lower mountain slopes (Anderson and Brubaker, 1993). Inasmuch as we can draw from 5
modern analogs, these data suggest thatBetulashrub tundra probably was replaced
byBetula woodland. The presence of Larix pollen, even in only a single sample, fur-ther suggests the establishment of deciduous woodland. The decreasing percentages
of graminoid and Ericales and increases inBetulapollen likely indicate a greater
pres-ence of wooded landscapes by upper zone 11a. 10
Zone 11b, representing the climatic optimum and corresponding to MIS11.3, in-cludes some variation within the pollen assemblage. The pollen spectra between 1855–
1905 cm: (1) are dominated by Picea sect. Eupicea, Alnus, and Betula; (2) show a
consistent appearance of Larix; and (3) have decreased percentages of herb taxa,
particularly Poaceae.Pinus subg. Haploxylon pollen appears initially in low amounts
15
but increases in later spectra (1827–1855 cm). This pollen type may represent either Pinus pumilaorPinus sibirica(see below). The increase inPinuspollen is associated
with a slight decline inBetulaandAlnuspollen.
The abrupt increase inPiceapollen at the zone 11a-11b boundary suggests a rapid
replacement of deciduous woodland byPicea obovata-Larix-Betula-Alnus forest. The
20
expansion ofPicea obovata to Lake E represents a range extension northeastward of
∼2000 km (Kolosova, 1980).Chosenia macrolepis possibly was present in this forest
(see below), but its pollen can not be differentiated from shrub Salix. Herb pollen is
virtually absent, which is characteristic of modern spectra from closed dark coniferous
forest. Although other coniferous taxa (e.g.,Piceasect. Omorica,Pinussubg.
Diploxy-25
lon) andCorylusappear, these grains likely represent long-distance transport, and the
pollen is not indicative of a local presence. Shrub communities of Betula,Alnus, and
CPD
9, 245–267, 2013Vegetation responses to interglacial warming
A. V. Lozhkin and P. M. Anderson
Title Page
Abstract Introduction
Conclusions References
Tables Figures
◭ ◮
◭ ◮
Back Close
Full Screen / Esc
Printer-friendly Version
Interactive Discussion
Discussion
P
a
per
|
Dis
cussion
P
a
per
|
Discussion
P
a
per
|
Discussio
n
P
a
per
|
occupied higher elevations, but the regional vegetation was dominated by dark conifer-ous forest.
The inferred vegetation for early MIS11.3 (1855–1905 cm) is reminiscent of that found today in the middle reaches of the Yama and Maimandzha Rivers, which is
lo-cated∼150 km to the east of Magadan (Fig. 1) and thought to be a relict forest from
5
a previous warm interval (Rheutt, 1970). Its plant communities contrast to the regional
vegetation of light coniferous forest dominated byLarix gmelinii and Pinus pumila. In
the Yama-Maimandzha lowlands, the forest is a mix ofPicea obovata, Larix, tree
Al-nus (Alnus hirsuta), and tree Betula (B. platyphylla, B. lanata). Populus suaveolens andChosenia macrolepisare limited to floodplains.Piceagrows to 20+m heights, and 10
Larix and Alnus hirsutahave diameters of 30–50 cm (Lozhkin, personal observation).
The percentages ofPinuspollen occurring between 1855 and 1905 cm are sufficiently
low to suggestPinusshrubs or trees were likely absent or at best minor components of
the ancient vegetation. This pattern is consistent with the modern Yama-Maimandzha Picea forest, where Pinus sibirica is absent and Pinus pumila is restricted to other 15
areas of the drainage.
Dark coniferous forest continues to dominate the landscape during later MIS11.3
(1827–1855 cm). Pollen percentages indicate that Picea obovata, Alnus hirsuta, and
Betularemain important elements in the forest communities, although the abundance of the latter two species perhaps decreased from earlier in the zone. The most sig-20
nificant shift in the pollen assemblage of late MIS11.3 is the rise inPinussubg.
Hap-loxylon pollen. As mentioned above, this pollen type represents bothPinus pumilaand
Pinus sibirica. Modern range distributions of Picea obovata and Pinus pumila do not
overlap in Northeast Siberia (Pinus pumila only) or to the west of the Lena drainage
(Picea obovata only; Kolosova, 1980). However, the two conifers do co-occur in the 25
middle and upper reaches of the Lena catchment, extending southward to the Amur
drainage. Here mean July temperatures are usually≤12◦C (Mock, 2002). In contrast,
Pinus sibiricais found from south Eastern Siberia to northern sectors of the Western
CPD
9, 245–267, 2013Vegetation responses to interglacial warming
A. V. Lozhkin and P. M. Anderson
Title Page
Abstract Introduction
Conclusions References
Tables Figures
◭ ◮
◭ ◮
Back Close
Full Screen / Esc
Printer-friendly Version
Interactive Discussion
Discussion
P
a
per
|
Dis
cussion
P
a
per
|
Discussion
P
a
per
|
Discussio
n
P
a
per
|
July temperatures can be as high as 20◦C. The three species ranges overlap in the
area of Lake Baikal, where their distribution reflects altitudinal gradients.
Larix-Picea-Pinusforest is found along large flat areas between∼1100–1900 m, andPinus pumila
is part of a subalpine tundra zone beyond 1900 m (Suslov, 1961).
These modern distributions suggest three alternative paleovegetation interpreta-5
tions. If the pollen is exclusively fromPinus pumila, its increase suggests that thePicea
forest: (1) became sufficiently open to allow for the establishment ofPinus shrubs in
the understory; and/or (2) the shrubs formed a mid-elevation shrub zone beyond alti-tudinal treeline. As compared to early MIS11, this vegetation change would perhaps suggest a slight summer cooling (to open the forest or lower treeline) and/or increased 10
depth/duration of snow fall (required to protectPinus pumila from winter desiccation;
Khokhyrakov, 1985). However, the persistence of low percentages of herb pollen does
not suggest a significant opening of the forests or decrease inPiceacover on mountain
slopes. If the pollen represents Pinus sibirica, then the Lake E record marks a range
extension of∼2500 km (Kolosova, 1980) and possibly an extensive forest cover across
15
northern Chukotka. The addition ofPinus sibiricawould not require changes in summer
conditions as it shares similar requirements withPicea obovata, raising questions as
to whyPinus sibirica was absent in early MIS11.3. If bothPinusspecies are present,
then the regional and/or local vegetation probably had a strong altitudinal component
with increased snow fall to aid establishment ofPinus pumila.
20
Quantitative paleoclimatic reconstructions indicate little systematic change in
sum-mer temperatures (ranging from∼12–16◦C) between early and late MIS11.3 (Melles et
al., 2012). The absence ofPinus sibiricaduring early MIS11.3 probably was not caused
by insufficient summer temperatures, especially given the establishment ofPicea
obo-vataat the time. Possibly delayed migration from an unknown but distant population
25
may account for the tree’s absence. Mean annual precipitation is estimated to be at its highest during late MIS11.3 (>600 mm yr−1 vs.∼350 mm yr−1 during early MIS11.3). If this trend reflects greater seasonal and/or annual snow fall, then this shift in
CPD
9, 245–267, 2013Vegetation responses to interglacial warming
A. V. Lozhkin and P. M. Anderson
Title Page
Abstract Introduction
Conclusions References
Tables Figures
◭ ◮
◭ ◮
Back Close
Full Screen / Esc
Printer-friendly Version
Interactive Discussion
Discussion
P
a
per
|
Dis
cussion
P
a
per
|
Discussion
P
a
per
|
Discussio
n
P
a
per
|
conclusion, if correct, would indicate that early MIS11.3 experienced drier cool-seasons or seasonal transitions as compared to late MIS11.3. This interpretation would also
suggest thatPinus pumilawas the mainPinusspecies present during late MIS11.3.
Pollen zone 11c represents the final stages of MIS11 and is marked by the sharp
decrease in Picea pollen, a more gradual decline in Alnus pollen, and increases in
5
herb pollen (primarily from Cyperaceae and Poaceae). Areas of graminoid meadows or tundra were more common than previously, suggested by the higher percentages
of herb pollen, slightly greater amounts of Ericales and Salix pollen, and to a lesser
extent the occurrence of higher Sphagnum values. Trees were limited on both local
and regional landscapes. The loss ofLarixpollen late in the zone suggests that tundra
10
dominated in the latter part of MIS11.
The forest-tundra of zone 11c perhaps was similar to areas found today in Eastern
Siberia (e.g., lower Lena River valley), wherePiceaand Larix form latitudinal treeline
with isolated stands ofLarix scattered northward across the tundra.Pinus pumilamay
have persisted from zone 11b, having a similar role as seen in the contemporary veg-15
etation. However, paleoclimatic reconstructions show a sharp decline in mean annual
precipitation (Melles et al., 2012), a potentially adverse factor in the survival ofPinus
pumila.Decreased summer temperatures as indicated by the quantitative climate
esti-mates would have been sufficiently severe to eliminatePinus sibirica,if it was present
on the zone 11b landscapes. 20
4.4 MIS 31
Of all warm periods discussed in this paper, MIS31 presents the most unusual pollen
spectra (Fig. 4). While dominated by typical boreal taxa (Picea, Larix, Abies, Betula,
Al-nus), the MIS3 assemblages also contain small numbers of more temperate deciduous
taxa (e.g.,Corylus, Carpinus, Acer, Quercus). Not surprisingly given the 1.1 Ma age,
25
these assemblages seem to lack exact analogs in the modern landscapes. Although
the pollen diagram is somewhat skeletal, the data are sufficient to determine general
CPD
9, 245–267, 2013Vegetation responses to interglacial warming
A. V. Lozhkin and P. M. Anderson
Title Page
Abstract Introduction
Conclusions References
Tables Figures
◭ ◮
◭ ◮
Back Close
Full Screen / Esc
Printer-friendly Version
Interactive Discussion
Discussion
P
a
per
|
Dis
cussion
P
a
per
|
Discussion
P
a
per
|
Discussio
n
P
a
per
|
The MIS32/MIS31 transition (pollen zone 31a) is similar to that of MIS6/MIS5 (Fig. 2;
pollen zone 5a) with spectra dominated byBetula andAlnuspollen and with very low
numbers of herb types. However, differences do exist between the two transitions,
in-cluding the minor presence ofLarixpollen and occasional occurrence of the warm taxa
Corylus, Carpinus, andMyricain zone 31a. As during pollen zone 5a, the regional veg-5
etation during early MIS31 probably was dominated by deciduous trees possibly with
tree-sized shrubs including Betula, Alnus, and Salix. Unlike MIS5, Larix was
estab-lished in the Lake E watershed and likely across the Upland. The low percentages of herb pollen suggest that a relatively dense deciduous forest rather than open woodland was established at this time. Although pollen from other deciduous trees is the result 10
of long-distance, wind transport, occurrence of these taxa suggests that temperate forests were in closer proximity to north-central Chukotka as compared to today.
The zone 31b assemblage represents the thermal maximum within MIS31 and is
characterized by several Picea and Pinus species, Larix, Abies, Betula, Alnus, and
<5 % herb pollen. Several partial analogs to this assemblage can be found in
Asi-15
atic Russia. The northernmost is the dark coniferous forest of the lower Yenisei
val-ley (northern sector of the Western Siberia Plain), where todayPicea obovata, Pinus
sibirica, andPinus sylvestris are found. A southern variant of this forest occurs in the
upper Yenisei drainage between ∼51 to 54◦N, an area that is transitional between
the Siberian dark coniferous taiga and Mongolian steppes. In this region, taiga dom-20
inates in the mountains and forests between∼1000 and 2000 m and includes Larix
sibirca, Picea obovata, Abies sibirica, Pinus sibirica, and occasional Pinus sylvestris.
A third possible analog is from the western shores of the Sea of Okhotsk (from∼51◦N
southward to the lower Amur valley), where the taiga is a mix ofPicea glehnii, Abies
nephrolepis, Larix gmelinii, and Betula ermanii. Pinus pumila is limited to protected 25
sites where it can grow in dense thickets achieving over 2 m height (Suslov, 1961). The
more temperate taxaCorylus mandshurica, Quercus mongolica, Carpinus cordata,and
CPD
9, 245–267, 2013Vegetation responses to interglacial warming
A. V. Lozhkin and P. M. Anderson
Title Page
Abstract Introduction
Conclusions References
Tables Figures
◭ ◮
◭ ◮
Back Close
Full Screen / Esc
Printer-friendly Version
Interactive Discussion
Discussion
P
a
per
|
Dis
cussion
P
a
per
|
Discussion
P
a
per
|
Discussio
n
P
a
per
|
from the Siberian dark coniferous forest and the Okhotsk taiga, as no modern vegeta-tion type totally corresponds to taxa represented in the pollen assemblage.
The combined percentages ofBetulaandAlnuspollen, as in zone 31a, dominate the
MIS31b spectra and demonstrate that deciduous forest remained an important
land-scape component. The presence of Corylus in two samples in minor but significant
5
amounts (2–3 %) suggests that the plant was probably present within the region. Today
the nearest Corylus population (Corylus mandshurica) is found in the lower reaches
of the Amur drainage and its establishment near Lake E would represent a∼2400 km
range extension (Kolosova, 1980). Inasmuch as we can draw on the Okhotsk taiga as analog, then it is likely that during zone 31b the vegetation in the Lake E crater and 10
neighboring Uplands was characterized by a marked altitudinal zonation.
Betula-Larix-Alnusforest likely dominated river valleys and lower slopes. Possibly theSalix pollen
represents Chosenia macrolepis, a common floodplain tree in modern landscapes.
Transitioning to mountain slopes, deciduous forest was replaced by conifer
communi-ties of Picea, Pinus,and Abies. Betula ermanii is common today inPicea-Abies
for-15
est, sometimes forming pure stands. ThisBetulaspecies occupies rockier and steeper
slopes. Corylus was likely an understory shrub that grew on warmer, south-facing
slopes. Other temperate taxa (e.g., Acer, Carpinus), if present, would be restricted
to the warmest sites. Pinus sylvestris, if the Pinus subg. Diploxylon pollen is not the
result of long-distance transport, was not abundant. As in the case of MIS11, the
Pi-20
nussubg. Haploxylon pollen may be interpreted in two ways. If fromPinus pumila,the
species likely grew in protected, open areas within the forest and possibly formed high shrub tundra beyond altitudinal treeline. As in zone 11b, low percentages of herb taxa suggest closed forests that extended far up mountain slopes, making the occurrence of aPinus pumilabelt less likely. If the pollen representsPinus sibirica,then the taxon 25
would be a member of the coniferous forest.
Within pollen zones 31c and 31d, the pollen spectra indicate steady vegetation changes implying gradual climatic cooling and increasing aridity. Pollen from
CPD
9, 245–267, 2013Vegetation responses to interglacial warming
A. V. Lozhkin and P. M. Anderson
Title Page
Abstract Introduction
Conclusions References
Tables Figures
◭ ◮
◭ ◮
Back Close
Full Screen / Esc
Printer-friendly Version
Interactive Discussion
Discussion
P
a
per
|
Dis
cussion
P
a
per
|
Discussion
P
a
per
|
Discussio
n
P
a
per
|
consistent appearance ofLarixpollen. Deciduous forest probably became the most
ex-tensive vegetation type both locally and regionally. The increase in Ericales, Poaceae,
and total herb pollen and Sphagnum spores indicates an opening of the forest and
establishment of tundra communities by late zone 31c and zone 31d.
5 Discussion and conclusions
5
The palynological data presented here and in previous papers (Lozhkin and Anderson, 2007; Matrosova, 2009) are in many senses a preview of the exciting paleoenviron-mental information contained within the Lake E archive. For example, our focus on only a small part of the vegetation history has revealed interglaciations with an unex-pected magnitude of warming (Melles et al., 2012). The pollen data described herein 10
further indicate that there are at least two types of vegetation responses to interglacial conditions. The vegetation in the first type of thermal optimum is dominated by decid-uous tree and shrub species and corresponds to the two most recent warming events (PGTM, MIS5.5): the second type, or “super” interglaciation (MIS11.3, MIS31),
indi-cates climax vegetation dominated by evergreen conifers, particularly Picea. These
15
exceptional climatic events experienced warmer summers (+4.5◦C) and greater
an-nual precipitation (∼300 mm) as compared to the PGTM and MIS5.5 (Melles et al.,
2012), which themselves are characterized by summers that are warmer and wetter
than present (increases of ∼2◦C and up to 20 mm for mean July temperature and
precipitation, respectively; Lozhkin et al., 2007). 20
Despite the classification into types, the interglaciations share some commonalities. One of the characteristics of the interglacial intervals at Lake E is that they show greater variability in vegetation types as compared to glaciations. These latter periods display great uniformity in their pollen assemblages both through time as in the Lake E record and also in space, at least in the cases of the latest glaciation when the most pale-25
CPD
9, 245–267, 2013Vegetation responses to interglacial warming
A. V. Lozhkin and P. M. Anderson
Title Page
Abstract Introduction
Conclusions References
Tables Figures
◭ ◮
◭ ◮
Back Close
Full Screen / Esc
Printer-friendly Version
Interactive Discussion
Discussion
P
a
per
|
Dis
cussion
P
a
per
|
Discussion
P
a
per
|
Discussio
n
P
a
per
|
compared to interglacial times; and (2) once a “threshold” of coolness and/or dryness is surpassed the vegetation response is limited to herb-dominated tundra or steppe tun-dra. The variability in vegetation response may also suggest that interglacial forests ex-erted a greater influence on the climate through such feedbacks as changes in albedo and fluxes of sensible heat (e.g., Foley et al., 1994; Levis et al., 1999; Eugster et al., 5
2000) as compared to that associated with rather uniform glacial tundra.
In each of the glacial to interglacial transitions the rapid establishment of plant com-munities dominated by woody taxa occurred. The earliest interglacial vegetation was Betulashrub tundra (note: this is not evident in early MIS31, but we expect additional pollen counts will show a parallel trend to the other interglaciations) that quickly was 10
replaced by deciduous forest or woodland. For the PGTM and MIS5, the establishment ofBetulawoodland/high shrub tundra andBetula-Larix forest/high shrub tundra during the PGTM and MIS5, respectively, represents maximum summer warming. However,
during the older warm periods, Betula-Larix (MIS11) or Betula-Alnus-Larix (MIS31)
forests were transitional as interglacial climates continued to become warmer and wet-15
ter. Edwards et al. (2005) noted that the widespread establishment of deciduous forest
in Beringia during the PGTM represented a novel biome that differed structurally and
functionally from evergreen coniferous forest and tundra that dominate arctoboreal set-tings today. They also commented that deciduous boreal forest should be included in
modeling efforts that explore likely biosphere-atmosphere feedbacks and possible
im-20
pacts caused by global warming. The new Lake E data underscore the importance of this proposition, as deciduous forest seems to play an essential role in interglacial vegetation history, whether it was as transitional or as climax vegetation.
The different interglacial “modes” also suggest the need to explore the potential
im-pact of a range of forcing mechanisms and feedbacks involved in “warm” and “warmer” 25
CPD
9, 245–267, 2013Vegetation responses to interglacial warming
A. V. Lozhkin and P. M. Anderson
Title Page
Abstract Introduction
Conclusions References
Tables Figures
◭ ◮
◭ ◮
Back Close
Full Screen / Esc
Printer-friendly Version
Interactive Discussion
Discussion
P
a
per
|
Dis
cussion
P
a
per
|
Discussion
P
a
per
|
Discussio
n
P
a
per
|
If Lake E is indicative of vegetation responses across northern high latitudes during these “warmer” intervals, then arctic plant communities during “super” interglaciations constricted to such an extent that they no longer existed as a major biome with conse-quent feedbacks related to shifts in albedo, sensible heat flux, etc. In sum, the Lake E record provides a set of natural experiments within which scientists might gage the 5
range of vegetation responses, the degree to which the distribution and composition of arctoboreal communities may alter, and the scope of expansion or contraction of con-temporary biomes as means to further improve predictions of possible biotic responses in arctic regions to projected global warming.
Acknowledgements. This work was supported by the Far East Branch of the Russian
10
Academy of Sciences (12-III-A-09-198, 12-II-CO-08-024), US National Science Foundation (EAR 0602471), Russian Foundation for Fundamental Investigations-(12-05-00286a), and the Civilian Research and Development Foundation (RUG1-2987-MA-10). We thank E. F. Gorod-nichaya, Ju. A. Korzun, T. B. Solomatkina, and E. D. Takmazyan for their great help in the analysis and preparation of the data.
15
References
Anderson, P. and Brubaker, L.: Holocene vegetation and climate histories of Alaska, in: Global Climates Since the Last Glacial Maximum, edited by: Wright Jr., H., Kutzbach, J., Webb III, T., Ruddiman, W., Street-Perrot, F., and Bartlein, P., University of Minnesota Press, Minneapolis, 386–400, 1993.
20
Anderson, P., Lozhkin, A., Belaya, B., and Stetsenko, T.: Modern spore-pollen spectra from the mountain regions of the Kolyma and Indigirka rivers from lacustrine sediments, in: Qua-ternary Paleogeography of Beringia, edited by: Simakov, K., NEISRI, FEB, RAS, Magadan, Russia, 28–39, 2002 (in Russian).
Bonan, G., Shugart, H., and Urban, D.: The sensitivity of some high-latitude boreal forests to
25
climatic parameters, Climatic Change, 16, 9–29, 1990.
CPD
9, 245–267, 2013Vegetation responses to interglacial warming
A. V. Lozhkin and P. M. Anderson
Title Page
Abstract Introduction
Conclusions References
Tables Figures
◭ ◮
◭ ◮
Back Close
Full Screen / Esc
Printer-friendly Version
Interactive Discussion
Discussion
P
a
per
|
Dis
cussion
P
a
per
|
Discussion
P
a
per
|
Discussio
n
P
a
per
|
Northeast Asia and Beringia before the Last Glacial Maximum, edited by: Madsen, D., The University of Utah Press, Salt Lake City, UT, USA, 29–62, 2004.
Brigham-Grette, J., Melles, M., and Minyuk, P. (Eds.): Arctic Record of the Last 250 ka from El’gygytgyn Crater Lake, NE Russia, J. Paleolimnol., 37, 162 pp., 2007.
Claussen, M.: Variability of global biome patterns as a function of initial and boundary conditions
5
in a climate model, Clim. Dynam., 12, 371–379, 1996.
Chapin III, F. and Starfield, A.: Time lags and novel ecosystems in response to transient climatic change in arctic Alaska, Climatic Change, 35, 449–461, 1997.
Czerepanov, S.: Vascular Plants of Russia and Adjacent States (the Former USSR), Cambridge University Press, Cambridge, UK, 516 pp., 1995.
10
Edwards, M., Brubaker, L., Lozhkin, A., and Anderson, P.: Structurally novel biomes: a response to past warming in Beringia, Ecology, 86, 1696–1703, 2005.
Eugster, W., Rouse, W., Pielke, R., McFadden, J., Baldocchi, D., Kittel, T., Chapin, F., Liston, G., Vidale, P., Vaganov, E., and Chambers, S.: Land-atmosphere energy exchange in arctic tundra and boreal forest: available data and feedbacks to climate, Global Change Biol., 6,
15
84–115, 2000.
Foley, J., Kutzbach, J., Coe, M., and Levis, S.: Feedbacks between climate and boreal forests during the Holocene epoch, Nature, 371, 52–52, 1994.
Harrison, S., Kutzbach, J., Prentice, I., Behling, P., and Sykes, M.: The response of northern hemisphere extratropical climate and vegetation to orbitally induced changes in insolation
20
during the last interglaciation, Quaternary Res., 43, 174–184, 1995.
Kaplan, J., Bigelow, N., Prentice, I., Harrison, S., Bartlein, P., Christensen, T., Cramer, W., Matveyeva, N., McGuire, A., Murray, D., Razzhivin, V., Smth, B., Walker, D., Anderson, P., Andreev, A., Brubaker, L., Edwards, M., and Lozhkin, A.: Climate change and arctic ecosys-tems: 2. Modeling, paleodata-model comparisons, and future projections, J. Geophys. Res.,
25
108, 8171, doi:10.1029/2002JD002559, 2003.
Khokhyrakov, A.: Flora of Magadan Oblast, IBPB, FEB, USSR Academy of Sciences, Vladivos-tok, Russia, 48 pp., 1985 (in Russian).
Kolosova, L. (Ed.): Geographic Atlas, Central Office of Geodesy and Cartography of the Soviet Ministry of the USSR, 4th Edn., Moscow, Russia, 1980 (in Russian).
30
CPD
9, 245–267, 2013Vegetation responses to interglacial warming
A. V. Lozhkin and P. M. Anderson
Title Page
Abstract Introduction
Conclusions References
Tables Figures
◭ ◮
◭ ◮
Back Close
Full Screen / Esc
Printer-friendly Version
Interactive Discussion
Discussion
P
a
per
|
Dis
cussion
P
a
per
|
Discussion
P
a
per
|
Discussio
n
P
a
per
|
Levis, S., Foley, J., and Pollard, D.: Potential high-latitude vegetation feedbacks on CO2-induced climate change, Geophys. Res. Lett., 26, 747–750, 1999.
Lozhkin, A.: Geochronology of late Quaternary events in northeastern Russia, Radiocarbon, 35, 429–433, 1993.
Lozhkin, A. and Anderson, P.: The last interglaciation in northeast Siberia, Quaternary Res.,
5
43, 147–158, 1995.
Lozhkin, A., Anderson, P., Eisner, W., Ravako, L., Hopkins, D., Brubaker, L., Colinvaux, P., and Miller, M.: Late Quaternary lacustrine pollen records from southwestern Beringia, Quaternary Res., 39, 314–324, 1993.
Lozhkin, A., Anderson, P., Vartanyan, S., Brown, T., Belaya, B., and Kotov, A.:
Reconstruc-10
tions of late Quaternary paleo-environments and modern pollen data from Wrangel Island (northern Chukotka), Quaternary Sci. Rev., 20, 217–233, 2001.
Lozhkin, A., Anderson, P., Belaya, B., and Stetsekno, T.: Reflections on modern pollen rain of Chukotka from bottom lake sediments, in: Quaternary Paleogeography of Beringia, edited by: Simakov, K., NEISRI FEB RAS, Magadan, Russia, 40–50, 2002 (in Russian).
15
Lozhkin, A., Anderson, P., Matrosova, T., and Minyuk, P.: The pollen record from El’gygytgyn Lake: implications for vegetation and climate histories of northern Chukotka since the late middle Pleistocene, J. Paleolimnol., 37, 135–153, 2007.
Matrosova, T.: Reconstruction of vegetation and climate in northern Chukotka during the last 350 thousand years (according to palynological evidence from El’gygytgyn Lake), Vesnik, 1,
20
23–30, 2009 (in Russian).
Melles, M., Brigham-Grette, J., Minyuk, P., Nowaczyk, N., Wennirch, V., DeConto, R., Anderson, P., Andreev, A., Coletti, A., Cook, T., Haltia-Hovi, E., Kukkonen, M., Lozhkin, A., Rosen, P., Tarasov, P., Vogel, H., and Wagner, B.: 2.8 million years of arctic climate change from Lake El’gygytgyn, NE Russia, Science, 337, 315–320, 2012.
25
Mock, C. J.: Regional climates of Russia, in: Late Quaternary Vegetation and Climate of Siberia and the Russian Far East (Palynological and Radiocarbon Database), edited by: Anderson, P. and Lozhkin, A., NOAA and Russian Academy of Science, Far East Branch, Magadan, 17–26, 2002.
PALE Steering Committee: Research Protocols for PALE: Paleoclimatic of Arctic Lakes and
Es-30
CPD
9, 245–267, 2013Vegetation responses to interglacial warming
A. V. Lozhkin and P. M. Anderson
Title Page
Abstract Introduction
Conclusions References
Tables Figures
◭ ◮
◭ ◮
Back Close
Full Screen / Esc
Printer-friendly Version
Interactive Discussion
Discussion
P
a
per
|
Dis
cussion
P
a
per
|
Discussion
P
a
per
|
Discussio
n
P
a
per
|
Reutt, A.: Vegetation, in: North of the Far East, edited by: Shilo, N., Nauka, Moscow, Russia, 257–299, 1970 (in Russian).
CPD
9, 245–267, 2013Vegetation responses to interglacial warming
A. V. Lozhkin and P. M. Anderson
Title Page
Abstract Introduction
Conclusions References
Tables Figures
◭ ◮
◭ ◮
Back Close
Full Screen / Esc
Printer-friendly Version
Interactive Discussion
Discussion
P
a
per
|
Dis
cussion
P
a
per
|
Discussion
P
a
per
|
Discussio
n
P
a
per
|