Co Inter
Multi-Personal C
Model: Applicatio
I. E. Suleimenov, D. B. Shal
Abstract–Possibility of application of Ba to forecasting of development of Internet shown that a quantitative description of th based on the Bass diffusion model, in certa particularly) is expedient to consider communications of orders, higher than personal communications). In this case equation describing the dynamics of sales i the degree higher than the second. Commu orders can be interpreted from the standp coercion phenomenon, i.e. a combination members of society to consume goods or se
Keywords–Bass Diffusion Model, Intern Communications, Cultural Coercion.
I. I
NTRODUCTIONBass diffusion model [1] is well-kn prediction and analysis of sales dynamic or services (innovations). There is amp that the model adequately describes the marketing of innovations, but at the sam that the actual curves may differ from obtained on the base of the model. I emphasize that theories similar to [1] m some tools for market investigations; ho in this paper, their significance is actually particular, the analysis of the marketin (notably, this applies to new telecommu makes it simple to obtain important info structure of the concrete society.
In numerous studies, particularly, [ attempts to make adjustments to th However, main assumptions that forme model were left almost unchanged.
Namely, it was assumed that th innovation in the market is determined informational impact on the consumer. determined by the influence of advertisin by the transmission of information d consumer to another («Word-in-mouth») Bass’sequation using in the classical for terms, that reflect the mentioned infor and the equation’s solution(logistic curv in respect to the inflection point.
However, a more detailed analysis information in society shows that the cla not reflect the features of the informa completely. Actual society has a rather of communication channels, also at least innovations the phenomenon of cultu significantly affects the dynamics of the p
Copyright © 2013 IJECCE, All right reserved 1744
ternational Journal of Electronics Communication an Volume 4, Issue 6, ISSN (Online): 2249–071X,
al Communications in Bass D
ation to Forecasting of Devel
Internet
haltykova, S. V. Panchenko, P. V. Obukhova, K.
Bass diffusion model net is analyzed. It is the dynamics of sales ertain cases (Internet, er the influence of n the second (multi-ase, the differential es includes terms with munications of higher dpoint of the cultural on of factors forcing services
ternet, Multi-Personal
N
-known method of ics of new products mple evidence [2-5] the dynamics of the ame time it is noted rom the predictions l. It is necessary to ] mainly are used as however, as shown ally much greater. In eting of innovations munication systems) nformation about the , [2-5], there were the Bass’s model. ed the basis of the the promotion of ed by two types of er. One of them is tising, and the other -directly from one »). Accordingly, the form consists of two formational impacts, urve) is symmetrical is of the spread of classical view does mation transmission er complex structure ast in some types of ltural coercion [6] e process.
The phenomenon of cultural by an example of innovation in it is seen more clearly that the service depends not only on individual, but also on how well in society. A typical example is Internet; to be more precise, w market even the conservative initially refused to purchase cell forced to use their services.
The same factors of cultural c of the "prestige", "modern", e other types of goods and servic manner.
The classical model of Bass a consider such factors. In this p consideration can be achieved tools. Moreover, the quantita phenomenon provides relevant structure of society and gives precise predictions of market of
II. O
BSERVEDFigure 1 shows the curve of th market of mobile phones in the curve is typical of any market generally such dependencies a solution resulting from the B curve. As shown below, in th described by the Bass equation be symmetrical. The phase dependence of a function’s de the function. Applying to a log parabola.
Fig.1. The dynamics of mobile market by years, accordin
and Computer Engineering 1X, ISSN (Print): 2278–4209
ss Diffusion
velopment of
va, K. I. Suleimenova
al coercion may be explained in telecommunications. Here he need for a new product or on the preferences of the well the product is distributed is mobile communications or , with the expansion of their ive part of consumers, who cell phones or Internet, were al coercion (including an idea , etc.) are also applicable to vices, though in a less visible s and its modifications do not is paper it is shown that their ed by comparatively simple ntitative analysis of this nt data on the informational es possibility to give more t of Internet services.
ED
R
ESULTSf the dynamics of the Russian the 1997-2009 years. Such a et for an innovative product; s are well described by the Bass’s model, i.e. logistic the case where the curve tion, its phase portrait should se portrait represents the derivative from the value of logistic curve it should be a
Co Inter
The curve in Figure 2 shows the phase 1. It is obtained by numerical differentia from Figure 1 with subsequent nu Approximation of the phase portrait dependence is shown in the same figure, It is seen that the phase portrait of th close to the parabolic. However, the co accurately approximated by a cubic po the initial part of the curve (where the m do not appear) the accuracy of the appr high (Fig. 2, curve 2). As shown in the polynominal dependence allows to take above mentioned factors (the existence informational structure of the society and coercion).
III. C
ULTURALC
OMPULSIONI
NFORMATIONALS
TRUCTUREO
Model [1] can be formulated in terms equation, which takes into account t impact of the above mentioned types on sales.
N
N
N
N
N
dt
dN
0
0where coefficients
and characte of informational influences that determin the marketing of an innovation, N0 - m this product or service, N
t - the numbea moment t. Traditionally, the term prop
associated with interpersonal communproportional to - with the impact of th advertisement.
Fig.2. Phase portrait of the sales curve The solution of this equation can be wr
1
1 0/ exp
1 с t N
N N t
N
,
whereN1/ ,
0 1
1
N N N
аconstant
c
is determined from the initia Equation (1) can be considered as an phase portrait of the empirical curves; d found with the numerical differentiation curve (Fig.2.).
Copyright © 2013 IJECCE, All right reserved 1745
ternational Journal of Electronics Communication an Volume 4, Issue 6, ISSN (Online): 2249–071X,
ase portrait of Figure entiation of the data numerical filtering. ait by a parabolic re, curve 1.
f the curve is really considered curve is polynomial, and for market fluctuations proximation is very e next section, such take into account the e of rather complex and factor of cultural
ON AND THE URE
O
FS
OCIETYs of the differential t the informational on the dynamics of
N
(1)
acterize the intensity ine the dynamics of market potential for
ber of consumers at roportional to
is unication, the term f the mass media and
ve shown in Fig. 1 written as:
(2)
N0 ,
itial conditions. an equation for the s; derivatives can be tion of experimental
For the purpose of this wor equation (1) considers two influence (mass influence of influence of information, tr communications). Such a clas firstly, society is character informational structure [7], phenomenon as cultural coercio in [6], as it was mentioned abov Existence of the cultural coe next example connecter with c known that a sufficiently large g in CIS countries), mostly of adu refused to use mobile phones. Ho the cellular, they were forced to
Mathematical description of cultural coercion can be eas consideration of two competin term nature. Examples of such s of mobile connections, as w provided by different web-sites
Starting from the formal ana next two equations similar to dynamics of sales of the service to virtual services) should be s that reflect competition in the fo
0 1 2
1
01
1 N N N N
dt dN
1 12 2
21N N
0 1 2
2
02
2 N N N N
dt dN
1 12 2
21N N
where N1,2 - sales (or the num
first and second product, respe
characterizing the informational each other, ij - coefficients tha mass media.
In particular, in (3) and (4) ba
with the equation of Bass, app
which describes the transition project 2 by information that use
If we consider the most extre that meets the condition of ma the purpose of clarity, we exclu impact of advertising and other
2 1
0 N N
N . Equation (5) expresses that i the market the average total num services (users of both sites) re the number of users of one of th reducing the number of us corresponds to the most extreme the parameters under consider through competition between th Then, equations (3) and (4) ta 12 1 2 21
1 N N N
dt dN
and Computer Engineering 1X, ISSN (Print): 2278–4209
ork it is significant that the o types of informational of advertisement, and mass transferred in individual lassification is approximate: terized as a complicated , secondly, there is such cion, considered, for example,
ove.
oercion is evident in case of ith cellular phones. It is well e group of people (especially dult age, who for a long time . However, with the spread of to adopt the technology.
of the phenomenon of the easily developed based on ting services with the long-h services could be - services well as virtual services, ites (search services, etc.).
nalogy with the Bass model, r to (1), that describe the ice (or the dynamics of visits e supplemented by members following form.
01
N0N1N2
1 2 12 1 2 21
1 N N N N
N
(3)
02
N0N1N2
1 2 12 1 2 21
1 N N N N
N
(4)
number of site visitors) of the spectively, ij - coefficients nal influence of consumers at
that characterize the effect of
based on the formal analogy ppears a member 21N2N1, n of users from project 2 to users 1 report to users 2. treme case of the competition market saturation, and if, for clude from consideration the er sources of information.
(5)
t in the case of saturation of number of users that consider remains constant. Increasing f them can take place only by users of the other. This me case in which a change of eration can take place only the services.
take the following form. 1
2 2N N
Copyright © 2013 IJECCE, All right reserved 1746
International Journal of Electronics Communication and Computer Engineering Volume 4, Issue 6, ISSN (Online): 2249–071X, ISSN (Print): 2278–4209
1 2 12 1 2 21
2 N N N N
dt dN
(7)
In the case when actual consumer properties of products 1 and 2 are similar, the coefficients
12 and
21 must be equal with the high accuracy. An additional argument in favor of this conclusion is the fact that the average communication skills of consumers in both projects are obviously the same. (They are members of the same society.)In these circumstances equations (6) and (7) degenerate.
0 1 dt dN
(8)
0 2 dt dN
(9) In other words, the formal analogy with the Bass’s model gives obviously inadequate result, contrary to observations. Usually one of the two original products completely displaces the other. It can be seen, in particular, in examples of the spread of Web search engines in the Internet.
The way to overcome the observed difficulty is to take into account that it is unnecessary more than two people may be involved in communication. (The communication with n participants will be called the n-degree communication.)
Considering the 3-rd degree communications equations (8) and (9) take the next form.
1 2 2 12 2 2 1 21
1 N N N N
dt dN
(10)
1 2 2 12 2 2 1 21
2 N N N N
dt dN
(11)
where coefficients
ij characterizes the informationalfusion of consumers to each other in the 3-rd degree communications .
In this case term
21N
12N
2 defines the change of 2nd service user’s opinion influenced by the information reported to him by two 1st service users and memberN
N
2212
- the reverse effect. It is easy to see that any other communications of third degree does not really affect the sales dynamics.Considering this result, the equations describing the dynamics of competing services should be written as follows .
1 2
21 2 12 1 21
1 N N N N N N
dt dN
(12)
1 2
21 2 12 1 21
2 N N N N N N
dt dN
(13)
Note that in this study the competition between the services is primarily considered for best clarity. Specifically, this example shows the importance of communication of a degree higher than second.
It is also clear that the communications of higher degree may be important not only in the case of two competing services. In particular, the analog of Bass’s equation should be written in the next form.
20 0
0 N N N N N N N
N dt dN
(14)This form meets the cubic approximation of the phase portrait, considered in section 2.
It should be emphasized that the probability of the communication of a higher-than-second degree in most cases is relatively low (the simplest example is the conversation of three or more people at a time.) There is even lower probability that in such communication two consumers of a particular service (goods and services) will enter simultaneously.
This probability becomes significant only if the particular service (product, service) really gets the mass distribution (the evident example is Internet as whole). That is why it can be argued that the terms of higher degrees describe the phenomenon of cultural coercion. In a certain sense, they reflect the influence of the environment on the dynamics of consumption.
Further, equation (14) can be formally generalized, because along with the third-degree communications there is a probability that communications of 4th and higher orders will appear. In the case of such communication, efficiency of informational influence increases. In particular, if a certain person hears positive feedback on the product or service from three or more interlocutors at once, he will more likely develop a positive opinion on it. So we have.
N N
Ndt dN
n
n
n
0 0
.
(15) At first glance, such a generalization has a purely formal nature; however, it can be used to predict the dynamics of sales or, more broadly, the dynamics of promoting innovation.
IV. P
OSSIBILITIES OF USING THEM
ATHEMATICALD
ESCRIPTION OF THEP
HENOMENON OFC
ULTURALC
OERCION TOS
OLVEF
ORECASTINGP
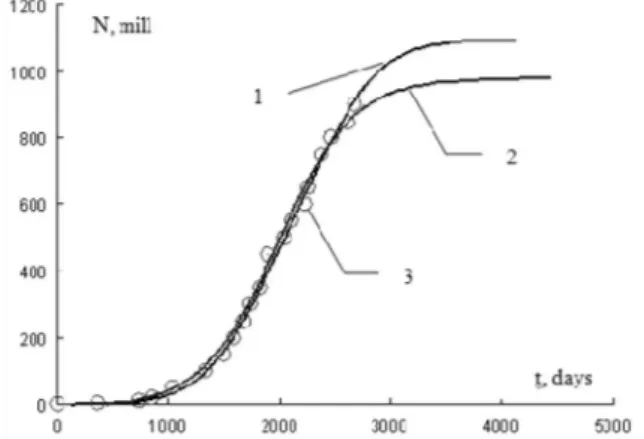
ROBLEMSIn order to demonstrate the use of the decomposition (15) to solve prognostic problems, we will use next example having evident interest for Internet researches. Figure 3 shows the number of users of Facebook in time (curve 1), site data [7].
The same figure shows the smoothed curve (curve 2) obtained on the basis of observations by the method of splines.
By the numerical differentiation of the smoothed curve we obtained the phase portrait of studying dependence, presented in Figure 4. The second and fourth degree polynomial approximation of the phase portrait is shown in the same figure (curves 1 and 2, respectively). You can see that a polynomial of degree 4 describes the phase portrait built on the basis of the field observations data, with higher accuracy.
Co Inter
be close to the parabola. More precisely, should reflect the existence of only two cross the x-axis at two points. Cub doesn’t always meet this condition, in should go to the approximation of the 4th
Fig.3. The growing number of users 1-raw data, http://www.justsocial.com/facebo html/, 2 - smoothed approximation
Fig.4. Phase portrait of the curve 1-point on the basis of experimental data, 2-q approximation, 3 - by the 4th degree polynom
It is seen that polynomial of the contrast to the second-degree polyno describes the phase portrait obtained experimental data.
These differences significantly affe obtained on the basis of the Bass’sdiffus
Figure 5 presents extrapolations of Facebook users, derived from the phase curves 2 and 3, respectively. It can forecast obtained directly on the Bas essentially different results than the simila takes into account the higher-degree interpreted through the cultural factor of Equations were used with follo coefficients.
10 2 . 9 10 99 . 0 10 5 . 4
0306 . 0 0029 . 0 10 3
06 3
08 4
12 2 06
x x
x dt
dN
x x
dt dN
Copyright © 2013 IJECCE, All right reserved 1747
ternational Journal of Electronics Communication an Volume 4, Issue 6, ISSN (Online): 2249–071X,
ly, the phase portrait wo stable states, i.e. ubic approximation in which case you
4th degree.
ers of Facebook. book-updated-stats.
ve 2, Figure 3 2-quadratic polynomial
omial.
e fourth degree, in nomial, adequately ed on the basis of ffect the forecasts fusion model.
of the number of se portraits, figure 4, n be seen that the ass’s model, gives milar forecast, which ee communications, of coercion.
following numeric
0034 . 0 0041 . 0 2
6
x x
Fig.5. Extrapolation of the num the Bass Model (2) and improv data
V. C
ONCLThus, the existence of the coercion makes it reasonable to degree communications whe diffusion model and its analo degree higher than the second more than 2 people at the same by additional terms in the dif from the Bass,s Model.
Taking into account this ty essential when the commodity distribution as it is evident for forecasting based on the class modification proposed in this differ from each other.
REFEREN
[1] Bass F. M., A new product grow
Mgmt Sci., 15, 215-227 (1969). [2] Parker P. M., Aggregate d marketing: a critical review,I
(1994).
[3] Chatterjee, R. and J. Eliashb Process in a Heterogeneous Approach.Management Scienc
[4] Skiadas C. H., Giovanis A. N., diffusion model for studying th consumption in Greece,Applied analysis, 13, 85-101 (1997). [5] C. H. Skiadas, A. N. Giovani
stochastic growth model derive J. Janssen and C. H. Skiadas
and Data Analysis, World Scie 870.
[6] Baudrillard J. For a Critique Sign, 1981.
[7] http://www.justsocial.com/face
and Computer Engineering 1X, ISSN (Print): 2278–4209
umber of Facebook users by roved model (1), (3)–initial
ta
NCLUSION
the phenomenon of cultural to take into account higher-hen considering the Bass alogs. Communications of a ond (i.e., those that involve e time) can be accounted for differential equation derived type of communication is dity (service) goes to mass for Internet. In this case the lassical Bass’s model and its his study may significantly
ENCES
rowth model for consumer durables, 9).
diffusion forecasting models in ,Int.J.Forecasting, 10, 353-380, shberg. The Innovation Diffusion us Population: A Micromodeling
nce, 36(9), 1057-1079 (1990). ., A stochastic Bass innovation the growth of electricity
lied stochastic models and data
anis and J. Dimoticalis, A sigmoid ived from the revised exponential, in as (eds),Applied Stochastic Models
cientific, Singapore, 1993, pp. 864