Use of Viremia to Evaluate the Baseline Case
Fatality Ratio of Ebola Virus Disease and
Inform Treatment Studies: A Retrospective
Cohort Study
Oumar Faye1☯, Alessio Andronico2☯, Ousmane Faye1☯, Henrik Salje2,3☯, Pierre-Yves Boëlle4,5, N’Faly Magassouba6, Elhadj Ibrahima Bah7, Lamine Koivogui8, Boubacar Diallo9, Alpha Amadou Diallo10, Sakoba Keita10, Mandy Kader Konde11, Robert Fowler12, Gamou Fall1, Simon Cauchemez2‡
*, Amadou Alpha Sall1‡
1Arbovirus and Viral Hemorrhagic Fever Unit, Institut Pasteur de Dakar, Dakar, Senegal,2Mathematical Modelling of Infectious Diseases Unit, Institut Pasteur, Paris, France,3Department of Epidemiology, Johns Hopkins Bloomberg School of Public Health, Baltimore, Maryland, United States of America,4INSERM, UMR-S 1136, Institut Pierre Louis d’Epidémiologie et de Santé Publique, Paris, France,5Sorbonne Universités, UPMC Univ Paris 06, UMR-S 1136, Institut Pierre Louis d’Epidémiologie et de Santé Publique, Paris, France,6Laboratoire de Fièvres Hémorragiques de Guinée, Hôpital Donka, Conakry, Guinea,
7Service des Maladies Infectieuses, Médecins Sans Frontières, Conakry, Guinea,8National Public Health Institute, Conakry, Guinea,9World Health Organization, Conakry, Guinea,10 Ministry of Health, Conakry, Guinea,11 Centre d’Excellence de Formation & Recherche sur le Paludisme & les Maladies Prioritaires en Guinée, Conakry, Guinea,12 University of Toronto, Toronto, Ontario, Canada
☯These authors contributed equally to this work. ‡These authors are joint senior authors on this work. *[email protected]
Abstract
Background
The case fatality ratio (CFR) of Ebola virus disease (EVD) can vary over time and space for reasons that are not fully understood. This makes it difficult to define the baseline CFRs needed to evaluate treatments in the absence of randomized controls. Here, we investigate whether viremia in EVD patients may be used to evaluate baseline EVD CFRs.
Methods and Findings
We analyzed the laboratory and epidemiological records of patients with EVD confirmed by reverse transcription PCR hospitalized in the Conakry area, Guinea, between 1 March 2014 and 28 February 2015. We used viremia and other variables to model the CFR. Data for 699 EVD patients were analyzed. In the week following symptom onset, mean viremia remained stable, and the CFR increased with viremia,V, from 21% (95% CI 16%–27%) for low viremia (V<104.4copies/ml) to 53% (95% CI 44%–61%) for intermediate viremia
(104.4
V<105.2copies/ml) and 81% (95% CI 75%–87%) for high viremia (
V105.2
copies/ml). Compared to adults (15–44 y old [y.o.]), the CFR was larger in young children (0–4 y.o.) (odds ratio [OR]: 2.44; 95% CI 1.02–5.86) and older adults (45 y.o.) (OR: 2.84;
OPEN ACCESS
Citation:Faye O, Andronico A, Faye O, Salje H, Boëlle P-Y, Magassouba N, et al. (2015) Use of Viremia to Evaluate the Baseline Case Fatality Ratio of Ebola Virus Disease and Inform Treatment Studies: A Retrospective Cohort Study. PLoS Med 12 (12): e1001908. doi:10.1371/journal.pmed.1001908
Academic Editor:Lorenz von Seidlein, Mahidol-Oxford Tropical Medicine Research Unit, THAILAND
Received:June 8, 2015
Accepted:October 19, 2015
Published:December 1, 2015
Copyright:© 2015 Faye et al. This is an open access article distributed under the terms of the
Creative Commons Attribution License, which permits unrestricted use, distribution, and reproduction in any medium, provided the original author and source are credited.
Data Availability Statement:To protect patient privacy, personally identifiable information has been aggregated and is available in the Supporting Information.
278433-95% CI 1.81–4.46) but lower in children (5–14 y.o.) (OR: 0.46; 95% CI 0.24–0.86). An order of magnitude increase in mean viremia in cases after July 2014 compared to those before coincided with a 14% increase in the CFR. Our findings come from a large hospital-based study in Conakry and may not be generalizable to settings with different case profiles, such as with individuals who never sought care.
Conclusions
Viremia in EVD patients was a strong predictor of death that partly explained variations in CFR in the study population. This study provides baseline CFRs by viremia group, which allow appropriate adjustment when estimating efficacy in treatment studies. In randomized controlled trials, stratifying analysis on viremia groups could reduce sample size require-ments by 25%. We hypothesize that monitoring the viremia of hospitalized patients may inform the ability of surveillance systems to detect EVD patients from the different severity strata.
Introduction
An epidemic of Ebola virus disease (EVD) of unprecedented magnitude has been ongoing in West Africa since December 2013 [1]. As of 23 September 2015, 28,295 confirmed, probable, and suspected EVD cases and 11,295 deaths have been reported to the World Health Organiza-tion [2].
Currently, most treatments used in Ebola treatment centers (ETCs) rely on supportive care, but several experimental therapies are being assessed for EVD following promising in vitro and limited in vivo findings [3–5]. The magnitude of the humanitarian and health crisis and high case fatality ratio (CFR) have led to debate on optimal methodologies for evaluating potential treatments [6–11]. While randomized controlled trials (RCTs) generally provide the most solid evidence on efficacy [6–9], randomization to active treatment or placebo has been considered unethical by some when any preclinical or clinical data suggest a treatment effect [10,11]. In the absence of a concurrent randomly allocated control group, Sissoko et al. [4] and Adebamowo et al. [10] recommended comparing the CFR in treated patients to the baseline CFR of patients who did not receive the treatment, with the baseline value being esti-mated from historical data collected during the current epidemic or during past EVD outbreaks.
Of course, an important limitation of using historical controls is that, in the absence of ran-domization, the CFR in the treatment group could differ from the baseline CFR for reasons independent of treatment. Indeed, the CFR of Ebola has varied historically, over time and space [1,12,13]. Factors that might drive these variations include patient care, the ability of sur-veillance systems to detect EVD patients from the different severity strata, time to hospitaliza-tion, and strain pathogenicity. Whatever the underlying causes, these variations make it difficult to define baseline CFRs and properly adjust for differences between the study popula-tion and historical controls. Irrespective of the study design, there are also important concerns about the statistical power of any treatment study, since recruitment of cases may become diffi-cult in the declining epidemic.
Here, we investigate the relationship between patients’viremia (viral load) and their proba-bility of death, and we assess how this relationship may be used to explain temporal trends in reported CFRs and inform different treatment study designs.
PREDEMICS, Institut Pasteur Dakar. RF’s work was supported by a personnel award from the Heart and Stroke Foundation, Ontario Provincial Office. The funders had no role in study design, data collection and analysis, decision to publish, or preparation of the manuscript.
Competing Interests:The authors have declared that no competing interests exist.
Methods
We analyzed the laboratory results of a large number of EVD patients from Conakry and sur-rounding prefectures (Fig 1). These patients were tested by the laboratory run by the Institut Pasteur de Dakar (IPD) and the Laboratoire des Fièvres Hémorragiques de Guinée (LFHP) in Conakry.
Ethical Considerations
We did not seek institutional review board approval for data collection in this study because data were collected as part of routine case management under an emergency response mandate from the government of Guinea. As part of routine practice, patients orally agreed to be tested for Ebola virus infection.
Laboratory Work
In the IPD-LFHP laboratory in Conakry, diagnosis of EVD was performed using real-time RT-PCR [14,15]. The algorithm for testing is as follows. A blood sample is collected from all suspected EVD patients, and an RT-PCR test is performed systematically. If the test is positive, the case is confirmed. Otherwise, the decision tree for subsequent testing depends on the time
dfrom symptom onset to sample collection: (i) if 3d10 d, the negative result is definitive; (ii) ifd2 d, a second sample is collected 3 d after the first sample, and a new RT-PCR test performed, with the results of this second test being final; (iii) ifd>10 d, cases are confirmed
using a serological test [14,15]. In this paper, analyses were restricted to cases confirmed by RT-PCR for whom viremia was available. Viremia was derived from theCtvalue obtained for
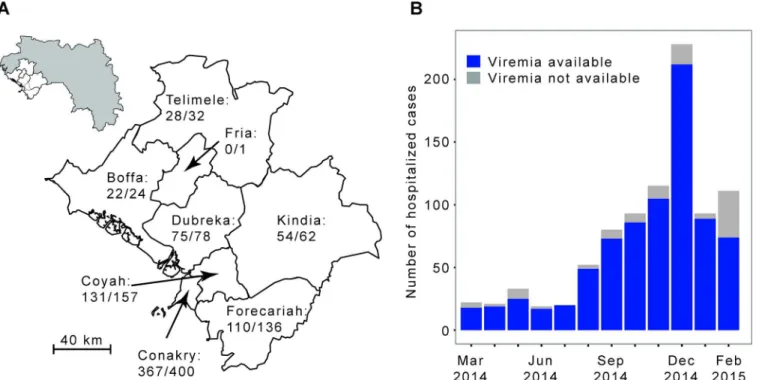
Fig 1. The Ebola virus disease epidemic in the Conakry area, Guinea, March 2014 to February 2015.(A) Map of the study area, which consists of Conakry and the surrounding prefectures of Boffa, Coyah, Dubreka, Forecariah, Fria, Kindia, and Telimele (for which diagnoses were mostly performed by the IPD-LFHP laboratory) (the administrative boundaries were taken from the GADM database;http://www.gadm.org/). (B) Number of cases by month of symptom onset. The total number of probable and confirmed cases in the study area that were hospitalized is indicated in grey. The number of those that were diagnosed by reverse transcription PCR (RT-PCR) by the IPD-LFHP laboratory is in blue.
each sample tested. We had access to the laboratory dataset, where all the laboratory results were recorded, as available on 3 March 2015.
Epidemiological Data
The epidemiological line list has already been described in detail elsewhere [1]. In short, a stan-dard case investigation form was used to collect clinical and demographic data for all con-firmed, probable, and suspected EVD cases identified through contact tracing and clinical care in Guinea. The following variables were used for our analyses: age, gender, EVD status (con-firmed/probable/suspected), prefecture of residence, date of symptom onset, outcome (dead/ discharged alive), hospitalization status (hospitalized/not hospitalized), date of hospitalization (if any), date of death (if any), and date of sample collection.
Inclusion in the Study
Our analysis was restricted to EVD patients from the epidemiological line list who (i) had EVD confirmed by an RT-PCR test performed by the IPD-LFHP laboratory in Conakry, (ii) resided in Conakry or in the surrounding prefectures of Boffa, Coyah, Dubreka, Forecariah, Fria, Kin-dia, or Telimele (in which diagnoses were mostly performed by the IPD-LFHP laboratory), (iii) had symptom onset between 1 March 2014 and 28 February 2015, and (iv) were hospitalized. Patients were excluded from the analysis if (i) sample collection was done after the day of death or more than 30 d after symptom onset or (ii) one of the following variables was missing or unclear: age, prefecture of residence, date of symptom onset, outcome, date of hospitalization, date of death if died, or date of sample collection. In a sensitivity analysis, we explored the robustness of our findings when different eligibility criteria were used (see Section 4 ofS1 Appendix).
Statistical Analysis
We calculated mean viremia (as measured on a log10scale) as a function of age, gender, and
time from symptom onset to sample collection.
We modeled outcome (dead/discharged alive) as a function of viremiaVin those diagnosed within 1 wk of symptom onset. A univariable logistic regression model with polynomial terms in log10Vup to degree 5 was used, with best fit selection according to the Akaike information
criterion. We also discretizedVinto three groups (low:V<v1, intermediate:v1V<v2and
high:Vv2) and selected the best threshold valuesv1andv2(v1<v2) at maximum likelihood
(see Section 2 ofS1 Appendixfor more details).
We then modeled outcome in all patients in a multivariable logistic regression that included viremia (using the best polynomial term identified above) and the following other predictors of death: age in four classes (young children: 0–4 y.o., children: 5–14 y.o., adults: 15–44 y.o., older adults:45 y.o.) and time from symptom onset to sample collection in three classes (<4, 4–7, >7 d).
Finally, as with all assays, the measurement of viremia (viral load) is not without uncer-tainty. It has been estimated that the standard deviation of the assay is around 0.48Ct[15]. To
explore the impact of assay uncertainty on our results, we randomly added measurement uncertainty to each viremia measurement and recalculated the relationship between viremia and probability of death over repeated simulations. Details of the simulation study can be found in Section 6 ofS1 Appendix. An aggregated dataset is available inS1 Dataset.
Use of Viremia in Treatment Studies
We compared the number of patients to include in an RCT for a new treatment against Ebola depending on whether viremia was/was not used for stratification of the analysis. We used the Cochran-Mantel-Haenszel test for the stratified analysis and the Chi-squared test for the unstratified analysis. We computed sample sizes using the viremia-level groups identified in this study, with their corresponding CFRs. Sample size formulas are reported in Section 7 ofS1 Appendix.
Results
Between 1 March 2014 and 28 February 2015, a total of 1,209 confirmed and probable cases were reported in the study area. Of the 885 (73%) confirmed and probable cases that were hos-pitalized, 855 (97%) were confirmed, of which 787 (89%) were confirmed by RT-PCR by the IPD-LFHP laboratory and had a viremia measurement available (Fig 2). Eighty-eight cases were excluded from the analysis because of missing or unclear information (n= 71), sample collection after death (n= 11), or long delays from symptom onset to sample collection/death (n= 6) (Fig 2). Our final dataset therefore consisted of 699 cases. Their mean age was 31 y (interquartile range [IQR] 20–42 y), and 47% (n= 332) were female (Table 1). Mean times
Fig 2. STROBE figure of patients included in this study.
from symptom onset to hospitalization, sample collection, and death were 4.8 (IQR 2–6), 5.6 (IQR 3–7), and 9.3 (IQR 6.5–11.0) d, respectively (Table 1).
Fig 3Apresents mean viremia as a function of time from symptom onset to sample collec-tion. From day 0 to day 7 after symptom onset, mean viremia was roughly constant, with values around 104.45(95% CI 104.32–104.57), and it generally declined sharply among patients still alive after day 7. Mean viremia was comparable in males and females (Fig 3B;p= 0.95). It was signif-icantly higher in young children (104.84; 95% CI 104.27–105.40) than in other age groups (104.13; 95% CI 104.00–104.26;p= 0.02) (Fig 3C).
We restricted the univariable analysis of viremia and outcome to the 548 (78%) patients whose samples were collected within 7 d of symptom onset, a time period when viremia appeared to be stable (Fig 3A). Among these patients, there were a total of 261 deaths (48%). The probability of death was best explained by a logistic regression model with (log10V)2as a
single explanatory variable (see Section 3 ofS1 Appendix). The odds ratio (OR) for a unit increase in (log10V)2was 1.12 (95% CI 1.10–1.14). This simple model provided an excellent fit
to the data (Fig 3D). The probability of death increased with viremia, from 21% (95% CI 16%–
27%; 51 deaths out of 243 individuals) in patients with low viremia (V<104.4) to 53% (95% CI
44%–61%; 70 deaths out of 133 individuals) in those with intermediate viremia (104.4
V<105.2) and 81% (95% CI 75%–87%; 140 deaths out of 172 individuals) in those with high
viremia (V105.2) (Fig 3D). The proportion of patients in the low, intermediate, and high viremia groups was 44% (95% CI 40%–49%;n= 243), 24% (95% CI 21%–28%;n= 133), and 31% (95% CI 28%–35%;n= 172), respectively. Our results were found to be robust to the level of measurement error expected from the viral load assay (see Section 6 inS1 Appendix).
We performed a multivariable analysis incorporating (log10V)2, age, and time from
symp-tom onset to sample collection using data from all 699 EVD patients. We found that the OR for a unit increase in (log10V)2was unchanged (1.12; 95% CI 1.10–1.14). We also found that
late sample collection (>7 d) (OR: 3.04; 95% CI 1.78–5.20) was associated with a significantly
increased probability of death compared to those tested<4 d after symptom onset (Table 2).
Compared to adults, the probability of death was significantly higher in young children (OR: 2.44; 95% CI 1.02–5.86) and older adults (OR: 2.84; 95% CI 1.81–4.46) and significantly lower in children (OR: 0.46; 95% CI 0.24–0.86) (Table 2), which is consistent with a previous study [10]. This multivariable logistic regression model successfully explained variations in the prob-ability of death by time from symptom onset to sample collection and by viremia group (Fig 3E).
In the study population, the CFR increased from 35% (95% CI 26%–45%) in March–July 2014 to 49% (95% CI 45%–53%) after August 2014 (Fig 4A) (p= 0.014). This rise coincided with an order of magnitude increase in mean viremia (Fig 4B) and a surge in the proportion of patients in the high viremia group (Fig 4C) (change in mean viremia in March–July versus
Table 1. Characteristics of patients included in the study.
Characteristic Value
Number of patients 699
Age (years), mean (IQR) 31.3 (20.0–42.0)
Female,n(proportion) 332 (0.47)
Dead,n(proportion) 332 (0.47)
Time from symptom onset to hospitalization (days), mean (IQR) 4.8 (2.0–6.0) Time from symptom onset to sample collection (days), mean (IQR) 5.6 (3.0–7.0) Time from symptom onset to death for those who died (days), mean (IQR) 9.3 (6.5–11.0)
Fig 3. Viremia and the probability of death.(A) Mean viremia as a function of the time from symptom onset to sample collection. (B) Mean viremia by gender. (C) Mean viremia by age group. (D) Probability of death as a function of viremia, when viremia was measured in the week following symptom onset. Three viremia groups are defined: low (V<104.4copies/ml), intermediate (104.4
V<105.2copies/ml), and high (
V105.2copies/ml) viremia. The probability
of death according to viremia group is represented as dotted line. The grey line corresponds to the predictions of the univariable logistic regression model. (E) Probability of death (dot: observed mean; thick line: 95% CI) as a function of the time from symptom onset to sample collection and the viremia group. Mean predicted values obtained with the multivariable logistic regression (triangle) and the bootstrap prediction intervals (thin lines) are also provided.
doi:10.1371/journal.pmed.1001908.g003
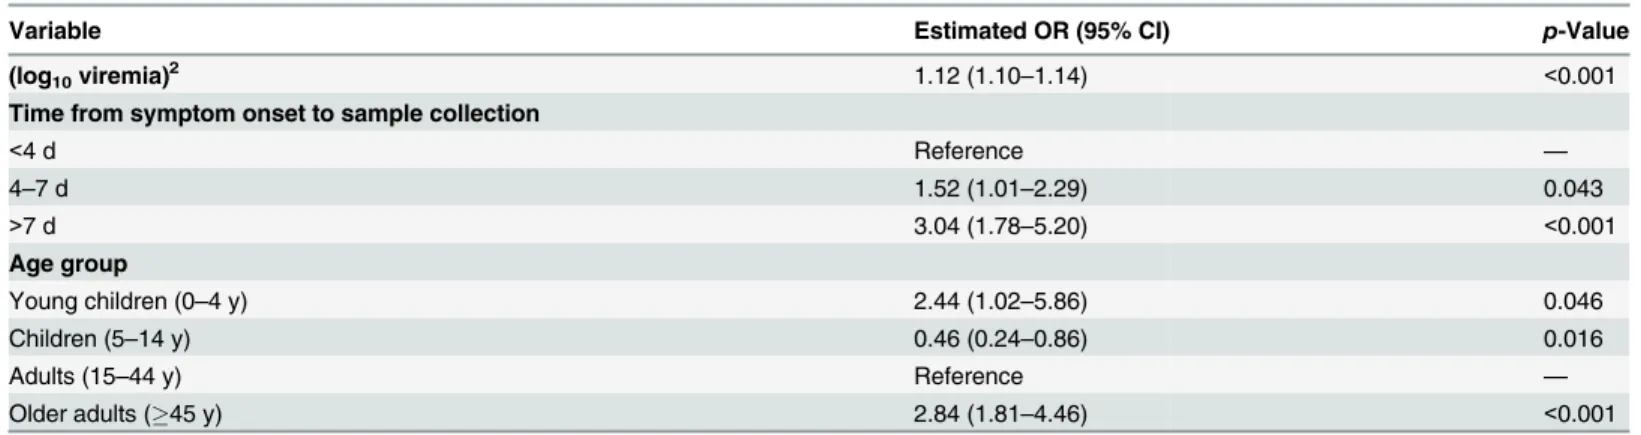
Table 2. Odds ratios for death in a multivariate logistic regression performed on all of the 699 cases included in the study.
Variable Estimated OR (95% CI) p-Value
(log10viremia)2 1.12 (1.10–1.14) <0.001
Time from symptom onset to sample collection
<4 d Reference —
4–7 d 1.52 (1.01–2.29) 0.043
>7 d 3.04 (1.78–5.20) <0.001
Age group
Young children (0–4 y) 2.44 (1.02–5.86) 0.046
Children (5–14 y) 0.46 (0.24–0.86) 0.016
Adults (15–44 y) Reference —
Older adults (45 y) 2.84 (1.81–4.46) <0.001
after August,p<0.01). Our multivariable logistic regression model performed well in
predict-ing individual outcomes (area under the curve [AUC] of 0.81; see Section 5 ofS1 Appendix), and it showed a similar trend in CFR (Fig 4A). A simpler univariable logistic regression model that relied only on viremia showed similar performance (Fig 4A). Finally, a model informed using data from March to September 2014 only (29% of all the data) performed similarly to one trained on the entire dataset (Section 5 ofS1 Appendix).
As Ebola viremia is a strong predictor of mortality, comparing patient outcomes within the same viremia category (stratified comparison) will be the most efficient for testing the efficacy of a new treatment. With the mix of viremia levels across patients observed here (low: 44%, intermediate: 24%, high: 31%) and corresponding CFRs, the total number of patients to include in an RCT would be reduced by 25% with a stratified comparison relative to an unstratified comparison (see Section 7 ofS1 Appendix). For example, to detect a 20% reduction in CFR as a treatment effect, an RCT would need 438 patients (or 68 for a 50% reduction), while a stratified RCT would need only 324 patients (or 52 for a 50% reduction).
Discussion
Here, we analyzed a large dataset of laboratory results for 699 EVD patients in order to charac-terize how the probability of death changed with viremia, while adjusting for age and time between symptom onset and sample collection. We found that viremia was a strong predictor of outcome for individual EVD patients, with the probability of death increasing from 21% in those with low viremia to 81% in those with high viremia. This is important because it confirms the significance of viremia as a predictor of EVD outcome suggested in small case series [16,17] and it provides an important potential measure of risk adjustment in clinical evaluations of Ebola-specific treatments. Important variations in the CFR of the study population (namely, a 14% increase from the first to the second epidemic wave) coincided with an order of magnitude increase in mean viremia (Fig 4B). This general trend for increasing CFR was well captured by a model that adjusted for viremia (Fig 4A).
This finding suggests that heterogeneity in historical CFR estimates among patients, ETCs, and over time may at least partly be explained by variations in viremia and underscores that more valid estimates of the influence of other factors, including treatment effects, might be obtained by adjusting for differing levels of viremia among patients. This finding is particularly important for observational studies that aim to assess the efficacy of treatments as it shows that adjusting for viremia level should reduce confounding. We also provided CFRs for the different viremia groups that could be used as baselines in historical comparisons. Although adjusting for viremia may reduce biases due to an important confounder, it will not account for biases due to other confounders, and the strength of evidence from nonrandomized treatment studies will always be more limited than that obtained with an RCT design.
We showed that analyses stratified by viremia could lead to a 25% reduction in the sample size requirements of RCTs. This calculation was performed under the simple assumption that treatment would have the same impact in the different viremia groups. In practice, this may not be the case, and it will be particularly interesting to assess how efficacy may vary with vire-mia. It would be straightforward to calculate sample size requirements under other scenarios in which treatment efficacy could be a function of viremia.
Fig 4. Variation of CFR and viremia over time.(A) Observed CFR by month (black) and predictions obtained from multivariable logistic regression (orange) and from the simple univariable logistic regression model that relies only on viremia (violet). Lines provide 95% CI. The shaded area indicates the bootstrap prediction interval. (B) Mean viremia by month. (C) Proportion of patients in the low (red;V<104.4copies/ml), intermediate (green; 104.4
V<105.2copies/
ml), and high (blue;V105.2copies/ml) viremia groups by month.
We presented estimates of CFR for EVD patients who were hospitalized in the region of Conakry and who had an RT-PCR positive blood sample collected before their date of death. This subset of EVD patients seems a natural candidate to become a historical control group in the context of ongoing treatment studies. However, it should be clear that the CFR in this sub-set of patients is different (and generally lower) than that of typical probable and confirmed EVD cases. EVD cases that died before they reached the hospital or before a sample could be collected or that were not hospitalized were indeed excluded from our study. To put our esti-mates in the wider context of the ongoing epidemic, we provide estiesti-mates of CFRs for other groups. From the line list, we estimate that the CFR for all probable and confirmed cases with symptom onset between 26 December 2013 and 3 March 2015 in Guinea was 70% (95% CI 68%–72%), consistent with previously reported figures [1,12]. However, it was lower in the Conakry area (64%; 95% CI 61%–67%) than in the rest of the country (74%; 95% CI 72%–
75%). In particular, the CFR for hospitalized cases was 51% (95% CI 48%–54%) in the Conakry area compared to 64% (95% CI 61%–66%) elsewhere. Potential explanations for these differ-ences include differdiffer-ences in patient characteristics, time to presentation, capacity for admission to ETCs, severity of EVD in patients who reached ETCs, and/or the early aggressive supportive care treatment approach in the Conakry area from the earliest part of the outbreak [18]. Differ-ent eligibility criteria could have been applied to select the final set of patiDiffer-ents to be included in the study. In a sensitivity analysis presented in Section 4 ofS1 Appendix, we show that the results of our univariable and multivariable analyses were robust to this choice.
The increase in mean viremia and CFR in the study population in the months after July 2014 compared to those before is an interesting observation that requires careful consideration. A number of mechanisms could explain this trend. A first possibility is that disease severity increased during this epidemic. This could have occurred, for example, if the virus evolved to become more virulent. However, such rapid adaptive evolution is not supported by the analysis of the currently available genetic sequences from the outbreak [19,20], although functional analyses would be required to definitely rule out this possibility. Further, it seems unlikely that any increased virulence would be restricted to the Conakry area (where we observed an increase in CFR) and not observed across the whole country (where CFR stayed stable). A sec-ond more plausible scenario is that disease severity remained stable over time, but that the abil-ity to detect and hospitalize patients with different levels of disease severabil-ity (probabilabil-ity of death) changed. The surge in mean viremia could indicate increased difficulties in detecting and hospitalizing patients with less severe EVD, for example because of resistance from local populations to going to the ETC unless they have very severe illness. It could also be that later in the outbreak, response teams were more successful at detecting severe cases before they died or that the increased number of cases during the peak of the outbreak favored the detection of severe cases. Keeping in mind that we considered only patients who provided a blood sample, a last possibility is that the propensity to perform RT-PCR tests even in EVD patients who were just about to die increased over time. However, in the Conakry area, testing was done systemat-ically when cases arrived to the ETC. Although we cannot be definitive on the mechanism explaining the observed rise in mean viremia, our analysis suggests that, if testing protocols and the virus remain stable over time, monitoring viremia might inform the ability of lance systems to detect different levels of disease severity and might be used to compare surveil-lance systems.
hospitalized cases. Our results may not be generalizable to community cases, as the distribution of viremia may be different in these individuals, for example if they represent cases that died before they could seek care or that had only minor symptoms. The route of infection, which is unknown in our cases, may be linked with differential mortality risk [21]. If such differences exist and are not accompanied by changes in viremia, this could bias our results.
In summary, in a very large and consecutive sample of patients with confirmed EVD, we have shown that viremia is a strong predictor of death that may in part explain previously observed heterogeneity in CFR estimates. Viremia may also provide an important mechanism for risk adjustment among patients in studies aiming to estimate associations of treatment with outcome, and a mechanism to stratify patients into different risk groups within clinical trials.
Supporting Information
S1 STROBE Checklist.
(DOC)
S1 Appendix. Technical details, further results, and sensitivity analyses.
(DOCX)
S1 Dataset. Summary dataset.Column 1 gives the number of EVD patients with a specific profile, where the profile is given by the month of hospitalization (column 2), outcome (col-umn 3), age (col(col-umn 4), and viremia group (col(col-umn 5).
(CSV)
Acknowledgments
We thank the Coordination Nationale de Lutte contre la Maladie à Virus Ebola (CNLEB), Médecins Sans Frontières, WHO, surveillance teams from various partners involved in EVD outbreak responses and control, Barré Soropogui, Hadja Aissatou Bah, Amadou Doré, Fodé Kourouma, Moussa Condé, Eugène Kolié, Mamadou Lamine Keita, and Alpha Mamadou Baldé for excellent technical expertise.
Author Contributions
Conceived and designed the experiments: AAS. Performed the experiments: OumF OusF NFM EIB LK BD AAD SK MKK RF GF AAS. Analyzed the data: AA HS PYB SC. Wrote the first draft of the manuscript: AA HS PYB SC AAS. Contributed to the writing of the manuscript: OumF AA OusF HS PYB NFM EIB LK BD AAD SK MKK RF GF SC AAS. Agree with the manuscript’s results and conclusions: OumF AA OusF HS PYB NFM EIB LK BD AAD SK MKK RF GF SC AAS. All authors have read, and confirm that they meet, ICMJE criteria for authorship.
References
1. WHO Ebola Response Team. Ebola virus disease in West Africa—the first 9 months of the epidemic and forward projections. N Engl J Med. 2014; 371:1481–1495. doi:10.1056/NEJMoa1411100PMID: 25244186
2. World Health Organization. Ebola situation report. 23 September 2015. Available:http://apps.who.int/ iris/bitstream/10665/185279/1/ebolasitrep_23Sept2015_eng.pdf?ua=1. Accessed 28 September 2015.
4. Sissoko D, Anglaret X, Malvy D, Folkesson E, Abdoul M, Shepherd S, et al. Favipiravir in patients with Ebola virus disease: early results of the JIKI trial in Guinea [abstract]. Conference on Retroviruses and Opportunistic Infections 2015; 23–26 Feb 2015; Seattle, Washington, US. Available:http://www. croiconference.org/sessions/favipiravir-patients-ebola-virus-disease-early-results-jiki-trial-guinea. Accessed 12 May 2015.
5. Hampton T. Largest-ever outbreak of Ebola virus disease thrusts experimental therapies, vaccines into spotlight. JAMA. 2014; 312:987–989. doi:10.1001/jama.2014.11170PMID:25162140
6. Cox E, Borio L, Temple R. Evaluating Ebola therapies—the case for RCTs. N Engl J Med. 2014; 371:2350–2351. doi:10.1056/NEJMp1414145PMID:25470568
7. Joffe S. Evaluating novel therapies during the Ebola epidemic. JAMA. 2014; 312:1299–1300. doi:10. 1001/jama.2014.12867PMID:25211645
8. Joffe S. Ethical testing of experimental Ebola treatments—reply. JAMA. 2014; 313:422. doi:10.1001/ jama.2014.17262
9. Shaw D. Randomisation is essential in Ebola drug trials. Lancet. 2014; 384:1667. doi: 10.1016/S0140-6736(14)61735-9PMID:25441188
10. Adebamowo C, Bah-Sow O, Binka F, Bruzzone R, Caplan A, Delfraissy JF, et al. Randomised con-trolled trials for Ebola: practical and ethical issues. Lancet. 2014; 384:1423–1424. doi: 10.1016/S0140-6736(14)61734-7PMID:25390318
11. Folayan MO, Haire B, Peterson K. Ethical testing of experimental Ebola treatments. JAMA. 2014; 313:421.
12. WHO Ebola Response Team, Agua-Agum J, Ariyarajah A, Aylward B, Blake IM, Brennan R, et al. West African Ebola epidemic after one year—slowing but not yet under control. N Engl J Med. 2015; 372:584–587. doi:10.1056/NEJMc1414992PMID:25539446
13. Lefebvre A, Fiet C, Belpois-Duchamp C, Tiv M, Astruc K, Aho Glélé LS. Case fatality rates of Ebola virus diseases: a meta-analysis of World Health Organization data. Med Mal Infect. 2014; 44:412–416. doi:10.1016/j.medmal.2014.08.005PMID:25193630
14. Ksiazek TG, Rollin PE, Williams AJ, Bressler DS, Martin ML, Swanepoel R, et al. Clinical virology of Ebola hemorrhagic fever (EHF): virus, virus antigen, and IgG and IgM antibody findings among EHF patients in Kikwit, Democratic Republic of the Congo, 1995. J Infect Dis. 1999; 179 (Suppl 1):S177– S187. doi:10.1086/514321PMID:9988182
15. Weidmann M, Muhlberger E, Hufert FT. Rapid detection protocol for filoviruses. J Clin Virol. 2004; 30:94–99. doi:10.1016/j.jcv.2003.09.004PMID:15072761
16. Schieffelin JS, Shaffer JG, Goba A, Gbakie M, Gire SK, Colubri A, et al. Clinical illness and outcomes in patients with Ebola in Sierra Leone. N Engl J Med. 2014; 371:2092–2100. doi:10.1056/
Nejmoa1411680PMID:25353969
17. Towner JS, Rollin PE, Bausch DG, Sanchez A, Crary SM, Vincent M, et al. Rapid diagnosis of Ebola hemorrhagic fever by reverse transcription-PCR in an outbreak setting and assessment of patient viral load as a predictor of outcome. J Virol. 2004; 78:4330–4341. doi:10.1128/Jvi.78.8.4330–4341.2004 PMID:15047846
18. Bah EI, Lamah MC, Fletcher T, Jacob ST, Brett-Major DM, Sall AA, et al. Clinical presentation of patients with Ebola virus disease in Conakry, Guinea. N Engl J Med. 2015; 372:40–47. doi:10.1056/ NEJMoa1411249PMID:25372658
19. Gire SK, Goba A, Andersen KG, Sealfon RS, Park DJ, Kanneh L, et al. Genomic surveillance elucidates Ebola virus origin and transmission during the 2014 outbreak. Science. 2014; 345:1369–1372. doi:10. 1126/science.1259657PMID:25214632
Editors' Summary
Background
During the current outbreak of Ebola virus disease (EVD) in West Africa, which started in December 2013, there have been more than 28,000 confirmed, probable, and suspected cases of EVD and more than 11,000 deaths from the disease. Ebola virus is transmitted to people from wild animals and spreads in human populations through direct contact with the bodily fluids (including blood, saliva, and urine) or organs of infected people or through contact with bedding and other materials contaminated with bodily fluids. The symptoms of EVD, which start 2–21 days after infection, include fever, headache, vomit-ing, diarrhea, and internal and external bleeding. Infected individuals are not infectious until they develop symptoms but remain infectious as long as their bodily fluids contain virus. There is no proven treatment or vaccine for EVD, although several treatments are now being assessed in people following promising laboratory studies. Supportive care—
given under strict isolation conditions to prevent the spread of the disease to other patients or to healthcare workers—improves survival.
Why Was This Study Done?
Ideally, the efficacy of a potential treatment for any disease is assessed in a randomized controlled trial, a study that compares outcomes among people chosen at random to receive the treatment with outcomes among people given a placebo (dummy treatment). However, because EVD is frequently fatal, randomized controlled trials of potential treat-ments are considered unethical. Instead, studies evaluating treattreat-ments for EVD usually compare the case fatality ratio (CFR; the number of deaths caused by a disease divided by the number of cases of that disease; a CFR of 100% indicates that everyone who develops the disease dies) among treated patients with a baseline CFR estimated from historical data. But the CFR of EVD varies markedly over time and space for poorly understood rea-sons (for example, changes in patient care or variations in the detection of people with dis-ease of different severity might change the CFR). Thus, the CFR in the treatment group could differ from the baseline CFR for reasons that are independent of the treatment. To find a way around this problem, in this retrospective cohort study, the researchers investi-gate whether there is a relationship between viremia (the amount of virus in the blood) and the CFR among patients with EVD.
What Did the Researchers Do and Find?
was 14% higher after July 2014 than in the months of March–July 2014, an increase that coincided with a ten-fold increase in the average level of viremia in the population.
What Do These Findings Mean?
These findings suggest that viremia is a strong predictor of death that can partly explain variations in the CFR of EVD. Because these findings are based on data collected from hos-pitalized patients, they may not be generalizable to other settings. Importantly, however, these findings provide estimates of CFR by viremia group that can now be used to adjust risk when undertaking clinical evaluations of EVD-specific treatments. That is, by allowing for differing levels of viremia, it will be possible to assess the efficacy of treatments for EVD more accurately in nonrandomized clinical trials. Moreover, the researchers calculate that stratification of patients by viremia group could reduce the sample size needed in any randomized trials that are undertaken (for example, comparisons of two potential treat-ments) by 25%. Finally, the researchers suggest that monitoring viremia among patients hospitalized for EVD might provide information about the ability of different surveillance systems to detect patients with different levels of disease severity (probability of death).
Additional Information
This list of resources contains links that can be accessed when viewing the PDF on a device or via the online version of the article athttp://dx.doi.org/10.1371/journal.pmed.1001908.
• The World Health Organization (WHO) provides information aboutEVD, information aboutpotential EVD therapies, and regularupdates on the current EVD epidemic; a summary of the discussion of a WHO Ethics Working Group Meeting on theethical issues related trials of EVDtreatments is available; the WHO website also provides
information about efforts to control Ebola in the fieldandpersonal stories from people who have survived EVD
• The UK National Health Service Choices website provides detailed information onEVD
• The US Centers for Disease Control and Prevention also provides information about