www.arch-anim-breed.net/59/461/2016/ doi:10.5194/aab-59-461-2016
© Author(s) 2016. CC Attribution 3.0 License. Archives Animal Breeding
PSAP
gene variants and haplotypes reveal significant
effects on carcass and meat quality traits in Chinese
Simmental-cross cattle
Pengcheng Guo1, Zhihui Zhao1, Shouqing Yan1, Junya Li2, Hang Xiao1, Dongxue Yang1, Yaolu Zhao1,
Ping Jiang1, and Runjun Yang1
1College of Animal Science, Jilin University, Xi’An Road 5333, Changchun, 130062 Jilin, China
2Institute of Animal Sciences, Chinese Academy of Agricultural Sciences, 100193 Beijing, China
Correspondence to:Runjun Yang ([email protected])
Received: 3 August 2016 – Revised: 25 October 2016 – Accepted: 3 November 2016 – Published: 14 November 2016
Abstract. Prosaposin (PSAP) is the precursor protein of four small lysosomal glycoproteins and plays vital roles in muscle growth and development of beef cattle. The aim of this study is to evaluate the association between
PSAPgene polymorphisms with carcass composition and meat quality traits of Chinese Simmental-cross cattle.
In the present study, six SNPs were identified within intron 10 and exon 11 of thePSAPgene from 380 beef
cattle by direct DNA sequencing, and 47 traits of carcass composition and meat quality were measured in the
studied population. Then, the relationship between variants ofPSAPgene with economic traits was analyzed
using statistical methods. The result revealed that I10-65G >A, I10-313C>T, E11-87C>T, and E11-93C>G were significantly associated with carcass traits, such as dressing percentage, fat coverage rate, carcass depth, and hind leg width, and I10-162C>T and I10-274C>T were significantly associated with marbling score traits. In addition, the individuals with GCCCGC haplotype showed significant higher dressed weight, dressing percentage
and rib eye area (p <0.01), and the individuals with ACCTCC haplotype showed a significant association with
the pH of beef and backfat thickness in the cattle population (p <0.05). Our results indicate that these SNPs and
haplotypes of thePSAPgene are possible important genetic factors that influence carcass composition and meat
quality traits, and they may be useful markers in future marker-assisted selection (MAS) programs in beef cattle breeding and production.
1 Introduction
Despite advances in the identification of genetic variants that affect economic traits of livestock, identifying DNA poly-morphisms that contribute to meat quality and carcass traits in cattle remains a challenge (Gill et al., 2009). A better un-derstanding of DNA polymorphisms that have an effect on carcass and meat quality could lead to important applica-tions, permitting us to adapt bovine carcass and meat qual-ity traits to consumer and market demands through marker-assisted selection (MAS) programs.
The bovine prosaposin (PSAP) gene is located on
chro-mosome 10 and contains 15 exons, in which exon 8 has the shortest length of only nine base pairs (Zhao and Morales, 2000). Prosaposin, a 65–70 kDa glycoprotein, is the
precur-sor for four sphingolipid activator proteins: saposins A, B, C, and D (Morales et al., 1995, 1998; Zhao et al., 1998).
PSAPmRNA can be transcribed into two major isoforms,
which differ in the inclusion of exon 8, encoding three ex-tra amino acids, Gln-Asp-Gln, within the saposin B domain (Zhao et al., 1997). And tissue-specific alternative splicing
in thePSAPmRNA is conserved from fish to human
(Co-hen et al., 2004). Studies have foundPSAP mRNA in the
462 P. Guo et al.: Association ofPSAPvariants with economic traits in cattle
lysosome (Hirabayashi et al., 1983); the other acts as an im-portant secretory protein that is not processed into saposins, and exists in various bodily fluids such as breast milk, cere-brospinal fluid, and sperm (Kishimoto et al., 1992). More-over the latter has important functions in the nervous sys-tem (Hiraiwa et al., 1999), oxidative stress (Panigone et al., 2001), improving the ability of bull sperm (Amann et al., 1999), male reproductive system (Morales et al., 2000), and oncogenic processes (Morales et al., 2000; Campana et al., 1996). Interestingly, sphingolipid catabolism generates lipophilic intermediates (ceramide, sphingosine, and sphin-gosine 1-phosphate, among others), which are involved in the transmission of extracellular signals to intracellular regu-latory systems (Hannun and Obeid, 2008). For example, ce-ramide mediates anti-mitogenic effects such as cell differen-tiation, cell cycle arrest, and cell senescence (Hannun and Obeid, 2008; Haimovitz-Friedman et al., 1997). Although numerous studies have implicated that prosaposin is essential for many metabolic processes, no evidence indicates that the
PSAPgene is associated with cattle carcass and meat quality
traits. The investigation ofPSAPgene polymorphisms is of
great interest because it might be associated with carcass and meat quality traits.
As thePSAPgene was hypothesized as a candidate gene,
the objectives of this study were to determine the correlation
betweenPSAPgene polymorphisms and meat quality traits
in Chinese Simmental-cross cattle population. And the re-sults may provide a basis for MAS in the processes of pure breeding, crossbreeding, and preserving important genetic resources.
2 Materials and methods
In the experiment, 380 Chinese Simmental-cross cattle that were crossbred with Simmental-bull frozen semen were ran-domly selected from 15 cattle farms in Wulagai animal hus-bandry management district of Xilin Gol league in Inner Mongolia. All economic traits (carcass traits and meat qual-ity traits) of beef cattle were performed at the Inner Mongo-lian Baolongshan beef cattle slaughterhouse and the Chinese Academy of Agricultural Sciences meat laboratory (Tian et al., 2013). Animal experiments were performed in strict ac-cordance with the guide for care and use of laboratory ani-mals by the Jilin University animal care and use committee (permit number: SYXK, 2012-0010/0011).
2.1 Blood collection and DNA sample preparation
For this study, the blood samples (10 mL each) of 28-month-old Chinese Simmental-cross cattle were collected from the jugular vein with anticoagulant (acid citrate dextrose; ACD)
and stored at −70◦C. Genomic DNA was extracted from
leukocytes of whole blood using AxyPrep™Blood Genomic
DNA Miniprep Kit according to the manufacturer’s protocol.
2.2 Trait analyses
All standardized carcass and meat quality assessments were performed at the Chinese Academy of Agricultural Sciences meat laboratory and molecular genetic laboratory of Jilin University (Fang et al., 2014).
The carcasses were stored in refrigerated rooms at a
tem-perature between 0 and 4◦C for 24 h. Then, all the carcass
and meat traits were assessed based on the GB/T17238-1998 cutting standard of fresh and chilled beef criterion of China (China Standard Publishing House).
For analysis, the dressed weight (DW), dressing percent-age (DP), net weight of bone (NWB), kidney fat weight (KFW), pH value of carcasses (PH), carcass length (CL), carcass depth (CD), carcass brisket depth (CBD), hind leg circumference (HLC), hind leg width (HLW), thigh meat thickness (TMT), thickness of loin (TL), backfat thickness (BFT), fat coverage rate of the carcass (FCR), marbling score (MBS), rib eye area (REA), muscle color score (MCS), and fat color score (FCS) were recorded.
2.3 PCR amplification, sequencing and SNP detection
A primer pair was designed from the published bovinePSAP
gene sequence (GenBank accession number: AC_000185.1) by using the Oligo 6 program. The primer sequences are as
follows: forward, 5′-TTACTGCGAGGTGTGCGAGTT-3′;
reverse, 5′-CCTCGGCATCACACGGACT-3′. Polymerase
chain reaction (PCR) was performed in a 50 µL total
vol-ume of the following mixture: 100 ng mL−1 bovine
ge-nomic DNA, 2 µL; 10 pmol L−1of each primer, 1 µL each;
and 2×Taq PCR Green Mix (Beijing Dingguo Changsheng
Biotechnology Co. Ltd.), 25 µL. Fragment amplification was performed as follows: initial denaturation at 94◦C for 5 min; 30 cycles of 94◦C for 30 s, annealing at 63◦C for 30 s, and 72◦C for 40 s; and a final extension at 72◦C for 10 min.
The PCR products were purified and sequenced in the au-tomated ABI PRISM 3100 Genetic Analyzer sequencer (Ap-plied Biosystems, Foster City, California, USA). The SNPs
in thePSAPgene were identified through sequences aligned
by SeqMan (DNASTAR, Inc., Madison, Wisconsin, USA).
2.4 Statistical analysis
Allelic and genotypic frequency values, genetic indices of polymorphism information contents (PICs), were calculated. The Hardy–Weinberg equilibrium of the polymorphisms was
determined by the chi-squared (χ2) test. The association
betweenPSAP gene polymorphisms and carcass and meat
quality traits was analyzed by two-way analysis of variance (ANOVA) using SPSS 13.0 for Windows. The fixed model was
Yij k=u+ysi+mj+eij k,
whereYij k is the observed value of thekth individual from
the Simmental breed of genotypej in theith-year season,
Figure 1.DNA sequencing for the individual Chinese Simmental-cross cattle population.
u is the lowest square mean of the observed values, ysi is
the effective value of theith-year season,mjis the effective value of genotypej, and eij k is the random residual effect corresponding to the observed value. Based on the six SNPs, haplotypes, and their frequencies were inferred using the al-gorithm developed by Stephens et al. (2001).
3 Results
3.1 Polymorphisms identified byPSAPgene sequencing
The PCR products were consistent with the target fragment and had good specificity. By direct DNA sequencing, four
SNP tags were identified in intron 10 of thePSAPgene:
I10-65G>A (Ensembl rs42143937), I10-162C>T (Ensembl
rs381104888), I10-274C>T (Ensembl rs385887193),
I10-313C>T (Ensembl rs209315330); and two SNPs were
iden-tified in exon 11: E11-87C>T, which induced a synonymous
mutation, and E11-93C>G (Ensembl rs133441330), which
induced a missense mutation of Ser (AGC) to Arg (AGG). All the SNPs are found in the NCBI dbSNP database,
ex-cept for E11-87C>T, which is different from the SNP of
rs432651539 that induces a stop-gain mutation. DNA se-quencing maps are shown in Fig. 1.
3.2 Genetic diversity of thePSAPgene in Chinese Simmental population
After six SNPs were selected for genotyping, the allele fre-quency, genotype frefre-quency, homozygosity, heterozygosity, and effective allele numbers were analyzed in the population (Table 1). According to the data, the frequencies of wild type alleles were all higher than of the mutant alleles. Statistical
analysis revealed that the ranges (from SNP I10-65G>A to
E11-93C>G) of homozygosity, heterozygosity, and
effec-tive allele numbers of six SNPs were 0.579 to 0.976, 0.024 to 0.421, and 1.025 to 1.727, respectively.
The values of genetic diversity and characteristics,
includ-ing PICs and χ2 values, are shown in Table 1. The PICs
ranged from 0.0234 to 0.3409, indicating that I10-313C>T
and E11-87C>T (PIC<0.25) had low polymorphism, the
other four SNPs (0.25<PIC<0.5) had intermediate
poly-morphism. According toχ2tests, four SNPs fit the Hardy–
Weinberg equilibrium in the population (P >0.05), whereas
two SNPs did not (p <0.05) (Fig. 2).
3.3 Linkage disequilibrium and haplotype construction
anal-464 P. Guo et al.: Association ofPSAPvariants with economic traits in cattle
Table 1.Genotypes, allele frequencies, and population genetic indexes of sixPSAPgene polymorphisms in 380 Chinese Simmental-cross
cattle. PIC is the polymorphism information content. HWE is the Hardy–Weinberg equilibrium.
Loci Allele Genotype Homozygosity Heterozygosity Effective PIC HWE
frequency frequency allele numbers χ2 p
I10-65 G>A G(0.679) GG(0.468) GA(0.421) 0.579 0.421 1.727 0.3409 0.444 0.505 A(0.321) AA(0.111)
I10-162 C>T C(0.782) CC(0.589) CT(0.384) 0.616 0.384 1.623 0.2828 5.967 0.015 T(0.218) TT(0.026)
I10-274 C>T C(0.795) CC(0.613) CT(0.363) 0.637 0.363 1.570 0.2728 4.860 0.028 T(0.205) TT(0.024)
I10-313 C>T C(0.832) CC(0.689) CT(0.284) 0.716 0.284 1.397 0.2405 0.081 0.775 T(0.168) TT(0.026)
E11-87 C>T C(0.988) CC(0.976) CT(0.024) 0.976 0.024 1.025 0.0234 0.055 0.815 T(0.012) TT(0.000)
E11-93 C>G C(0.811) CC(0.663) CG(0.295) 0.705 0.295 1.418 0.2596 0.620 0.431 G(0.189) GG(0.042)
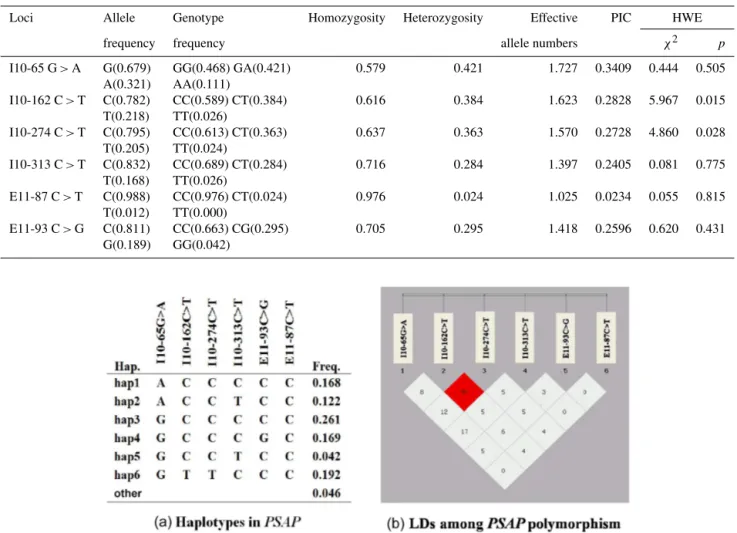
Figure 2.Gene haplotype and linkage disequilibrium (LD) coefficients inPSAP gene.(a)Haplotypes ofPSAP. Haplotypes with a
fre-quency greater than 0.03 are presented. Others contain rare haplotypes.(b)Linkage disequilibrium coefficient (D′andr2) amongPSAP
polymorphisms. The numbers arer2values (%).
ysis (Fig. 2a). Linkage disequilibrium between polymor-phism pairs and haplotype structure analysis of SNPs in the studied population are shown in Fig. 2b. From the analy-sis result of linkage disequilibrium (LD), it is a tight LD (r2>0.33) between I10-162C>T and I10-274C>T, and
other pairs of SNPs are weak LDs (r2<0.33) with each
other.
3.4 Association analyses ofPSAPpolymorphisms with carcass and meat quality traits
The relationships among the genotypes of 380 individuals and 18 carcass and meat quality traits were analyzed (Ta-ble 2). According to the statistical analysis, the SNPs I10-65G>A, I10-313C>T, E11-87C>T, and E11-93C>G were significantly associated with carcass traits, and the SNPs I10-162C>T and I10-274C>T were significantly as-sociated with carcass and meat quality traits. The HLC, BFT,
and FCR (p <0.01), and DW (p <0.05) were found to be
significantly associated with the I10-65G>A in the present population. Cattle with the genotype GA have higher HLC, BFT, FCR, and DW than cattle with the GG and AA
geno-types. As a tag SNP marker, I10-162C>T was found to
be significantly associated with CD (p <0.01) and NWB,
PH, CL, CBD, HLW, TL, FCR, and FCS (p <0.05) in the
present population. In detail, cattle with the genotype CC have higher NWB, PH, CBD, HLW, and FCS than cattle
with the CT genotype (p <0.05), moreover, the genotype CT
have higher TL than those with the CC genotype (p <0.05).
For I10-274C>T, significant correlation was found with the
TL, BFT, and FCR (p <0.01), and NWB and CD (p <0.05)
in the present population. Cattle with the genotype CT tended to have higher BFT and FCR than those with the
geno-types TT (p <0.01) and CC (p <0.05), and the genotype
CT tended to have a higher TL than those with the geno-type CC (p <0.01). In contrast, cattle with the genotype CC
Guo
et
al.:
Association
of
PSAP
var
iants
with
economic
tr
aits
in
cattle
465
SNP Genotype DW (kg) DP (%) NWB (kg) KFW (kg) CL (cm) CD (cm) CBD (cm) HLC (cm) HLW (cm)
SNP1 AA 249.079±32.034a 51.676±2.353 19.873±2.674 4.400±2.308 140.393±8.297 64.560±3.808 65.060±3.519 48.536±3.519 43.571±2.624A
I10-65 G>A GA 261.049±37.885b 52.337±2.084 20.241±2.968 4.936±2.787 139.447±8.024 64.509±3.216 65.622±3.643 49.299±4.199 45.017±2.777B
GG 253.924±39.863a,b 51.971±2.616 20.122±3.291 4.622±2.934 139.970±7.984 64.396±3.095 65.094±3.606 48.778±3.386 44.467±2.619A,B
p 0.126 0.230 0.710 0.389 0.831 0.842 0.252 0.394 0.006
SNP2 CC 256.904±37.593 52.102±2.237 20.44O±3.138a 4.681±2.858 140.5279±8.263a 64.828±3.359A 65.628±3.624a 49.039±3.914 44.847±2.752a
I10-162 C>T CT 256.180±39.376 52.081±2.599 19.622±2.935b 4.815±2.751 138.836±7.410b 63.870±2.840B 64.846±3.556b 48.919±3.605 44.253±2.6210b
TT 247.89O±44.227 52.03O±2.411 21.157±3.352a,b 4.588±2.787 137.450±9.929a,b 64.900±4.313A,B 65.050±3.775a,b 48.200±2.648 44.100±2.951a,b
p 0.511 0.698 0.048 0.478 0.141 0.036 0.196 0.717 0.097
SNP3 CC 255.927±37.943 52.060±2.218 20.371±3.112a 4.675±2.871 140.374±8.225 64.768±3.407a 65.533±3.628 48.965±3.875 44.759±2.760
I10-274 C>T CT 257.701±38.764 52.139±2.642 19.666±2.988b 4.861±2.729 138.964±7.442 63.902±2.716b 64.928±3.574 49.052±3.647 44.370±2.613
TT 248.211±46.898 52.221±2.475 21.619±3.200a,b 4.142±2.551 137.611±10.517 65.111±4.519a,b 65.500±3.708 47.889±2.607 44.000±3.112
p 0.839 0.744 0.075 0.439 0.262 0.080 0.471 0.748 0.319
SNP4 CC 255.416±38.882 52.048±2.48509 20.074±3.068 4.690±2.770 139.623±8.034 64.441±3.102 65.226±3.443 48.730±3.889 44.514±2.707
I10-313 C>T CT 258.654±37.959 52.176±2.175 20.312±3.144 4.816±2.927 140.167±7.976 64.486±3.396 65.644±3.965 49.433±3.444 44.803±2.674
TT 257.400±31.236 52.353±1.754 20.179±3.272 4.826±2.807 140.350±8.838 64.750±4.590 64.000±3.909 50.300±3.318 44.650±3.544
p 0.793 0.896 0.760 0.958 0.630 0.928 0.289 0.149 0.652
SNP5 CC 256.999±38.292 52.149±2.357A 20.170±3.099 4.749±2.804 139.797±7.994 64.465±3.232 65.335±3.611 48.995±3.772 44.594±2.710
E11-87 C>T T 231.222±35.354 49.770±2.321B 19.113±2.542 3.934±3.078 139.778±9.602 64.333±2.958 64.389±3.773 48.000±3.509 44.833±3.142
p 0.136 0.009 0.192 0.662 0.375 0.674 0.275 0.591 0.777
SNP6 CC 255.048±38.8915a 52.018±2.424a 20.113±3.053a 4.684±2.784 139.874±8.001 64.299±3.262 65.051±3.472 48.980±3.890 44.507±2.702A,b
E11-93 C>G CG 256.504±36.714a,b 52.108±2.332a,b 19.950±2.940a,b 4.768±2.830 139.647±7.627 64.777±3.201 65.737±3.773 48.866±3.540 44.554±2.653b
GG 276.700±38.337c 53.151±1.823b 21.997±4.141c 5.178±3.192 139.625±11.123 64.813±2.689 66.469±4.326 49.563±3.420 46.375±2.952B,c
p 0.027 0.081 0.047 0.294 0.919 0.379 0.103 0.745 0.027
TMT (cm) TL (cm) BFT (cm) FCR (%) REA (cm2) MCS FCS PH MBS
SNP1 AA 17.445±1.848 6.795±1.012 0.960±0.604A,B 48.833±21.422B 78.238±14.185 5.667±0.979 2.738±0.964 6.312±0.548 5.286±0.742
I10-65 G>A GA 17.869±1.727 6.911±0.925 1.056±0.640A 50.506±20.945A 79.688±12.678 5.675±1.108 2.744±0.960 6.231±0.483 5.369±0.715
GG 17.000±1.648 6.835±0.883 0.906±0.619B 47.293±22.052B 79.081±12.554 5.528±1.069 2.687±0.980 6.259±0.532 5.405±0.716
p 0.137 0.775 0.077 0.625 0.825 0.615 0.343 0.400 0.605
SNP2 CC 17.792±1.680 6.808±0.889a 0.957±0.631 48.197±21.727a,b 78.986±12.432 5.611±1.099 2.783±0.970a 6.282±0.501a 5.367±0.708
I10-162 C>T CT 18.006±1.776 6.967±0.950b 1.016±0.630 50.233±21.470a 80.066±13.426 5.589±1.048 2.596±0.958b 6.213±0.531b 5.404±0.729
TT 18.070±1.243 6.580±0.852a,b 0.775±0.545 42.000±16.865b 73.000±8.692 5.700±1.059 3.000±0.943a,b 6.184±0.535a,b 5.200±0.789
p 0.593 0.443 0.496 0.284 0.306 0.551 0.358 0.458 0.178
SNP3 CC 17.780±1.679 6.789±0.894A 0.948±0.631a 48.014±21.854a 78.669±12.383 5.609±1.086 2.757±0.984 6.277±0.504 5.370±0.708
I10-274 C>T CT 18.023±1.78808 7.007±0.935B 1.040±0.628A,b 50.710±21.115A,b 80.614±13.470 5.601±1.071 2.630±0.937 6.213±0.529 5.399±0.730
TT 18.356±0.906 6.589±0.903A,B 0.672±0.464B,c 40.556±17.220B,c 73.111±9.212 5.556±1.014 3.000±1.000 6.244±0.530 5.222±0.833
p 0.368 0.314 0.339 0.365 0.354 0.622 0.830 0.600 0.168
SNP4 CC 17.957±1.659 6.847±0.898 0.957±0.627 48.092±21.335a 78.716±12.911 5.572±1.061 2.726±0.967 6.271±0.528 5.378±0.721
I10-313 C>T CT 17.682±1.875 6.878±0.951 1.023±0.636 50.620±22.256b 80.602±12.773 5.667±1.136 2.704±0.988 6.198±0.479 5.370±0.718
TT 18.070±0.735 7.120±0.992 0.930±0.622 48.300±18.915a,b 78.400±7.720 5.800±0.789 2.600±0.843 6.387±0.451 5.400±0.699
p 0.315 0.594 0.424 0.216 0.399 0.675 0.953 0.075 0.966
SNP5 CC 17.901±1.710 6.873±0.910 0.980±0.629 49.017±21.331 79.382±12.756 5.612±1.071 2.704±0.969 6.247±0.506 5.367±0.717
E11-87 C>T T 17.078±1.487 6.467±1.057 0.778±0.632 40.556±28.553 73.556±12.640 5.333±1.323 3.222±0.833 6.520±0.733 5.667±0.707
p 0.235 0.638 0.774 0.845 0.438 0.882 0.360 0.452 0.558
SNP6 CC 17.856±1.737 6.8401±0.940 0.990±0.643 48.497±21.716 78.740±13.097 5.655±1.065 2.727±0.953 6.254±0.513 5.409±0.694
E11-93 C>G CG 17.880±1.652 6.905±0.853 0.935±0.582 49.830±21.283 79.795±12.426 5.509±1.107 2.696±1.012 6.245±0.516 5.330±0.752
GG 18.300±1.687 6.938±0.957 1.013±0.739 46.750±21.063 83.313±9.053 5.500±1.033 2.688±0.946 6.292±0.534 5.188±0.834
p 0.553 0.536 0.286 0.564 0.184 0.385 0.874 0.984 0.191
Note:a, b, cmeans with different superscripts were significantly different (p <0.05).A, B, Cmeans with different superscripts were significantly different (p <0.01). Dressed weight (DW, kg), dressing percentage (DP, %), net weight of bone (NWB, kg), kidney fat weight (KFW, kg), pH value
of carcasses (PH), carcass length (CL, cm), carcass depth (CD, cm), carcass brisket depth (CBD, cm), hind leg circumference (HLC, cm), hind leg width (HLW, cm), thigh meat thickness (TMT, cm), thickness of loin (TL, cm), backfat thickness (BFT, cm), fat coverage rate of carcass (FCR, %),
2
.arch-anim-breed.net/59/461/2016/
Arch.
Anim.
Breed.,
59,
461–468,
466 P. Guo et al.: Association ofPSAPvariants with economic traits in cattle
Table 3.Association of haplotypes (HF>0.03) with carcass and meat quality traits of the cattle population.
Traits Haplotype (mean±SD)
GCCCCC(25) GCCCGC(12) GCCTCC(2) GTTCCC(10) ACCCCC(14) ACCTCC(6)
DW (kg) 250.528±30.400B 278.058±42.808A,b 222.700±23.900 247.890±44.227a 237.993±22.495B 263.017±27.738 DP (%) 51.874±2.187a 52.973±1.895A,b 51.240±2.758 52.030±2.411 50.834±2.302B 52.872±1.595 NWB (kg) 20.100±2.476 22.538±4.062A 22.605±4.052 21.157±3.352b 19.073±2.971Ba,B 20.597±2.665 KFW (kg) 4.990±3.016 4.574±3.300 1.230±0.071 4.588±2.787 4.082±2.579 4.847±1.972 CL (cm) 142.110±7.140a 142.750±11.005 143.500±0.707 137.450±9.929b 143.714±8.062 141.583±7.940 CD (cm) 65.238±2.895 65.083±2.811 67.500±0.707 64.900±4.313 65.214±3.239 64.250±5.742 CBD (cm) 65.269±2.652 66.833±4.707 64.500±0.707 65.050±3.775 65.571±3.251 64.167±5.183 HLW (cm) 44.604±2.908 46.458±3.230a 44.500±4.950 44.100±2.951 43.429±2.120b 44.083±3.878 TMT (cm) 18.005±1.122a 18.183±1.887a 17.750±0.778 18.070±1.243 16.750±2.157b 17.933±0.747 TL (cm) 6.808±0.789 6.742±0.938 6.100±0.566 6.580±0.852 6.279±0.786 7.033±0.695 BFT( cm) 0.935±0.590 0.908±0.802a 0.250±0.071 0.775±0.545 0.850±0.755a 0.933±0.572b FCR (%) 48.729±22.877 40.667±20.891 21.500±4.950 42.000±16.865 39.643±21.346 51.667±14.72 REA(cm2) 78.060±11.493 83.000±10.488a 70.500±4.950 73.000±8.692b 72.143±15.160b 81.000±8.319 MCS 5.598±1.117 5.500±1.087 5.500±0.707 5.700±1.059 5.429±0.852 6.000±0.894 FCS 2.532±0.958 3.000±0.739 3.000±0 3.000±0.943 3.214±0.699 2.667±1.033 PH 6.246±0.546a 6.329±0.546a 6.725±0.177 6.184±0.535B 6.546±0.587 6.465±0.414A,b MBS 5.526±0.649 5.417±0.793 6.000±0 5.200±0.789 5.429±0.756 5.167±0.753
Note:a, b, cmeans with different superscripts were significantly different (p <0.05).A, B, Cmeans with different superscripts were significantly different (p <0.01). Dressed weight (DW, kg), dressing percentage (DP, %), net weight of bone (NWB, kg), kidney fat weight (KFW, kg), pH value of carcasses (PH), carcass length (CL, cm), carcass depth (CD, cm), carcass brisket depth (CBD, cm), hind leg circumference (HLC, cm), hind leg width (HLW, cm), thigh meat thickness (TMT, cm), thickness of loin (TL, cm), backfat thickness (BFT, cm), fat coverage rate of carcass (FCR, %), marbling score (MBS, the score range of marbling is from nos. 1 to 9), rib eye area (REA, cm2), muscle color score (MCS, the score range of muscle color is from nos. 1 to
7), and fat color score (FCS, the score range of fat color is from nos. 1 to 7).
had higher NWB and CD than those with the genotype CT (p <0.05). Furthermore, cattle with the genotype CC tended to have higher BFT and FCR than those with the genotype TT (p <0.05). About I10-313C>T, cattle with the geno-type CT had higher FCR than those with the genogeno-type CC (p <0.05). For E11-87C>T, cattle with the genotype CC
had higher DP than those with the CT genotype (p <0.01).
The last E11-93C>G was significantly associated with DW,
DP and NWB (p <0.05) and the HLW (p <0.01) in the
present population. With detailed description, cattle with the genotype GG had higher DW, DP, and NWB than those
with the genotype CC (p <0.05); and the genotype GG had
higher DW and NWB values than those with the genotype CG (p <0.05). In contrast, cattle with the genotype GG had
higher HLW than those with the genotypes CC (p <0.01)
and CG (p <0.05).
Six haplotypes constructed from six contiguous SNPs were analyzed to assess the relationship between the geno-types and phenogeno-types of 69 individuals. As analysis results revealed, haplotypes were significant with DW, DP, NWB,
and PH (p <0.01), and CL, HLW, TMT, BFT, and REA
(P <0.05) (Table 3). In particular, the GCCCGC haplotype
tended to have higher DW, DP, and NWB than those with the
ACCCCC haplotype (p <0.01), and the ACCTCC haplotype
tended to have a higher pH than those with the GTTCCC hap-lotype (p <0.01).
4 Discussion
Meat quality is commercially important for the animal hus-bandry industry and is affected by genetic background, man-agement, nutrition and meat processing (Boukha et al., 2011; Cherel et al., 2012). As an exocrine or endocrine protein, prosaposin has important effects on many metabolic pro-cesses. No studies have reported an association between the
PSAPgene and economic traits, which therefore stimulated
our interest in this research.
In the present study, we identified six contiguous
polymor-phisms in thePSAPgene from 380 Chinese Simmental-cross
cattle, and population genetic indexes as well as LD coeffi-cients were analyzed. The disequilibrium may have resulted from the use of frozen bull semen as well as from the high se-lection intensity over the past few years. In general, the PIC is closely linked with the number of alleles and their frequency distribution. In the present study, four SNPs with moderate abundance might have resulted from open conservation of the sampling group in recent years.
Our data showed PSAP SNPs of I10-65G>A,
I10-313C>T, E11-87C>T, and E11-93C>G were
signifi-cantly associated with carcass traits, while SNPs of
I10-162C>T and I10-274C>T were significantly associated
with carcass and meat quality traits. Four polymorphisms (I10-65G>A, I10-313C>T, I10-162C>T, I10-274C>T) are non-coding mutations, which do not result in a change in the amino acid sequence of the protein. However, intronic mutations may affect gene regulation, altering the phenotype
through aberrant splicing (Shastry, 2009; Komar, 2007). For example, the IGF2 intron 3-G3072A mutation has major ef-fects on muscle growth, heart size, and fat deposition (Van
Laere et al., 2003). Although the E11-87C>T mutation is
a synonymous mutation that does not affect the amino acid sequence of the protein, increasing evidence indicates that this mutation could still affect transcription, splicing, mRNA transport or translation – any of which could result in
phe-notypic alteration (Goymer, 2007). The E11-93C>G
muta-tion is a missense mutamuta-tion in the coding region, and this type of mutation could change the amino acid sequence of the protein, thereby potentially affecting the translational ef-ficiency and altering its function, which appears to be a trend in controlling the carcass and meat quality traits in the Chi-nese Simmental-cross cattle population. These observations stimulate interest in identifying the mechanism of how these types of mutations affect carcass and meat quality traits in beef cattle.
According to the statistical results, individuals with the GCCCGC haplotype have higher DW, DP, and NWB
(p <0.01) as well as HLW, TMT, and REA (p <0.05) than
those with the other haplotypes. Therefore, the GCCCGC haplotype might be a molecular marker of combined geno-types for cattle seed selection in the future. Comparing meth-ods based on single SNP analysis and haplotype-based analy-sis, the latter can provide a more powerful assessment of the complex relationship between genetic variation and pheno-types. Thereby, haplotype combination analysis is more ef-fective than single SNP analysis.
In summary, thePSAPgene has potential effects on
car-cass and meat quality traits in the Chinese Simmental-cross cattle population. Based on the results of the biologically
relevant genotype–phenotype associations,PSAPgene
poly-morphisms may be applicable to MAS in breeding programs for beef cattle in China. Further functional research is
re-quired to clarify the mechanism of how these PSAP gene
polymorphisms effect carcass and meat quality traits.
5 Data availability
The original data are available upon request to the corre-sponding author.
Acknowledgements. This work was supported by the National
High Technology Research and Development Program of China (no. 2013AA102505), the National Natural Science Foundation of China (nos. 31372278 and 31672389), the National Research and Development Project of Transgenic Organisms of the Ministry of Science and Technology, China, (2014ZX0800953B), and the provincial industrial innovation special foundation of Jilin province (2016C032).
Edited by: S. Maak
Reviewed by: two anonymous referees
References
Amann, R. P., Seidel Jr., G. E., and Brink, Z. A.: Exposure of thawed frozen bull sperm to a synthetic peptide before artificial insemi-nation increases fertility, J. Androl., 20, 42–46, 1999.
Boukha, A., Bonfatti, V., Cecchinato, A., Albera, A., Gallo, L., Carnier, P., and Bittante, G.: Genetic parameters of carcass and meat quality traits of double muscled Piemontese cattle, Meat Sci., 89, 84–90, doi:10.1016/j.meatsci.2011.03.024, 2011. Campana, W. M., Hiraiwa, M., Addison, K. C., and O’Brien, J. S.:
Induction of MAPK phosphorylation by prosaposin and pros-aptide in PC12 cells, Biochem. Bioph. Res. Co., 229, 706–712, doi:10.1006/bbrc.1996.1869, 1996.
Cherel, P., Herault, F., Vincent, A., Le Roy, P., and Damon, M.: Ge-netic variability of transcript abundance in pig skeletal muscle at slaughter: relationships with meat quality traits, J. Anim. science, 90, 699–708, doi:10.2527/jas.2011-4198, 2012.
Cohen, T., Ravid, L., Altman, N., Madar-Shapiro, L., Fein, A., Weil, M., and Horowitz, M.: Conservation of expression and alterna-tive splicing in the prosaposin gene, Brain research, Mol. Brain Res., 129, 8–19, doi:10.1016/j.molbrainres.2004.06.027, 2004. Fang, X. B., Zhang, L. P., Yu, X. Z., Li, J. Y., Lu, C. Y., Zhao, Z. H.,
and Yang, R. J.: Association of HSL gene E1-c.276C>T and E8-c.51C>T mutation with economical traits of Chinese Simmental cattle, Mol. Biol. Rep., 41, 105–112, doi:10.1007/s11033-013-2842-6, 2014.
Gill, J. L., Bishop, S. C., McCorquodale, C., Williams, J. L., and Wiener, P.: Association of selected SNP with carcass and taste panel assessed meat quality traits in a commercial population of Aberdeen Angus-sired beef cattle, Genet. Sel. Evol., 41, 1–12, doi:10.1186/1297-9686-41-36, 2009.
Goymer, P.: Synonymous mutations break their silence, Nat. Rev. Genet., 8, 92–92, doi:10.1038/nrg2056, 2007.
Haimovitz-Friedman, A., Kolesnick, R. N., and Fuks, Z.: Ceramide signaling in apoptosis, Brit. Med. Bull., 53, 539–553, 1997. Hannun, Y. A. and Obeid, L. M.: Principles of bioactive lipid
sig-nalling: lessons from sphingolipids, Nature reviews, Mol. Cell Biol., 9, 139–150, doi:10.1038/nrm2329, 2008.
Hirabayashi, Y., Li, Y. T., and Li, S. C.: Activator protein for the en-zymic hydrolysis of sphingolipids and their relationships to sph-ingolipidosis, Special reference to the catabolism of GM2 gan-glioside, Seikagaku, 55, 1–13, 1983.
Hiraiwa, M., Campana, W. M., Mizisin, A. P., Mohiuddin, L., and O’Brien, J. S.: Prosaposin: A myelinotrophic protein that promotes expression of myelin constituents and is secreted af-ter nerve injury, Glia, 26, 353–360, doi:10.1002/(Sici)1098-1136(199906)26:4<353::Aid-Glia9>3.0.Co;2-G, 1999.
Kishimoto, Y., Hiraiwa, M., and O’Brien, J. S.: Saposins: structure, function, distribution, and molecular genetics, J. Lipid Res., 33, 1255–1267, 1992.
Komar, A. A.: Silent SNPs: impact on gene function and phenotype, Pharmacogenomics, 8, 1075–1080, doi:10.2217/14622416.8.8.1075, 2007.
468 P. Guo et al.: Association ofPSAPvariants with economic traits in cattle
Morales, C. R., el-Alfy, M., Zhao, Q., and Igdoura, S.: Molecu-lar role of sulfated glycoprotein-1 (SGP-1/prosaposin) in Sertoli cells, Histol. Histopathol., 10, 1023–1034, 1995.
Morales, C. R., Hay, N., El-Alfy, M., and Zhao, Q.: Distribution of mouse sulfated glycoprotein-1 (prosaposin) in the testis and other tissues, J. Androl., 19, 156–164, 1998.
Morales, C. R., Zhao, Q., Lefrancois, S., and Ham, D.: Role of pros-aposin in the male reproductive system: effect of prospros-aposin inac-tivation on the testis, epididymis, prostate, and seminal vesicles, Arch. Andrology., 44, 173–186, 2000.
Panigone, S., Bergomas, R., Fontanella, E., Prinetti, A., Sandhoff, K., Grabowski, G. A., and Delia, D.: Up-regulation of prosaposin by the retinoid HPR and its effect on ceramide production and integrin receptors, FASEB J., 15, 1475–1477, 2001.
Shastry, B. S.: SNPs: impact on gene function and phenotype, Meth-ods Mol. Biol., 578, 3–22, doi:10.1007/978-1-60327-411-1_1, 2009.
Stephens, M., Smith, N. J., and Donnelly, P.: A new statistical method for haplotype reconstruction from population data, Am. J. Hum. Genet., 68, 978–989, doi:10.1086/319501, 2001. Tian, J., Zhao, Z., Zhang, L., Zhang, Q., Yu, Z., Li, J., and
Yang, R.: Association of the leptin gene E2-169T>C and E3-299T>A mutations with carcass and meat quality traits of the Chinese Simmental-cross steers, Gene, 518, 443–448, doi:10.1016/j.gene.2012.11.071, 2013.
Van Laere, A. S., Nguyen, M., Braunschweig, M., Nezer, C., Col-lette, C., Moreau, L., Archibald, A. L., Haley, C. S., Buys, N., Tally, M., Andersson, G., Georges, M., and Andersson, L.: A regulatory mutation in IGF2 causes a major QTL ef-fect on muscle growth in the pig, Nature, 425, 832–836, doi:10.1038/nature02064, 2003.
Zhao, Q., Hay, N., and Morales, C. R.: Structural analysis of the mouse prosaposin (SGP-1) gene reveals the presence of an exon that is alternatively spliced in transcribed mR-NAs, Mol. Reprod. Dev., 48, 1–8, doi:10.1002/(SICI)1098-2795(199709)48:1<1::AID-MRD1>3.0.CO;2-N, 1997. Zhao, Q., Bell, A. W., El-Alfy, M., and Morales, C. R.: Mouse
testicular sulfated glycoprotein-1: sequence analysis of the com-mon backbone structure of prosaposins, J. Androl., 19, 165–174, 1998.
Zhao, Q. and Morales, C. R.: Identification of a novel se-quence involved in lysosomal sorting of the sphingolipid ac-tivator protein prosaposin, J. Biol. Chem., 275, 24829–24839, doi:10.1074/jbc.M003497200, 2000.