Candidate Genes for Body Composition and Meat Quality
Traits in Beijing-You Chickens
Ranran Liu1,2., Yanfa Sun1,3., Guiping Zhao1,2, Fangjie Wang1,4, Dan Wu1,2, Maiqing Zheng1,2, Jilan Chen1,2, Lei Zhang1,2, Yaodong Hu1,2, Jie Wen1,2*
1Institute of Animal Sciences, Chinese Academy of Agricultural Sciences, Beijing, P.R. China,2State Key Laboratory of Animal Nutrition, Beijing, P. R. China,3College of Animal Science and Technology, Yangzhou University, Yangzhou, Jiangsu, P. R. China,4College of Animal Science and Technology, Anhui Agricultural University, Hefei, Anhui, P. R. China
Abstract
Body composition and meat quality traits are important economic traits of chickens. The development of high-throughput genotyping platforms and relevant statistical methods have enabled genome-wide association studies in chickens. In order to identify molecular markers and candidate genes associated with body composition and meat quality traits, genome-wide association studies were conducted using the Illumina 60 K SNP Beadchip to genotype 724 Beijing-You chickens. For each bird, a total of 16 traits were measured, including carcass weight (CW), eviscerated weight (EW), dressing percentage, breast muscle weight (BrW) and percentage (BrP), thigh muscle weight and percentage, abdominal fat weight and percentage, dry matter and intramuscular fat contents of breast and thigh muscle, ultimate pH, and shear force of thepectoralis major
muscle at 100 d of age. The SNPs that were significantly associated with the phenotypic traits were identified using both simple (GLM) and compressed mixed linear (MLM) models. For nine of ten body composition traits studied, SNPs showing genome wide significance (P,2.59E26) have been identified. A consistent region on chicken (Gallus gallus) chromosome 4 (GGA4), including seven significant SNPs and four candidate genes (LCORL,LAP3,LDB2,TAPT1), were found to be associated with CW and EW. Another 0.65 Mb region on GGA3 for BrW and BrP was identified. After measuring the mRNA content in beast muscle for five genes located in this region, the changes inGJA1expression were found to be consistent with that of breast muscle weight across development. It is highly possible that GJA1 is a functional gene for breast muscle development in chickens. For meat quality traits, several SNPs reaching suggestive association were identified and possible candidate genes with their functions were discussed.
Citation:Liu R, Sun Y, Zhao G, Wang F, Wu D, et al. (2013) Genome-Wide Association Study Identifies Loci and Candidate Genes for Body Composition and Meat Quality Traits in Beijing-You Chickens. PLoS ONE 8(4): e61172. doi:10.1371/journal.pone.0061172
Editor:Bryan A. White, University of Illinois, United States of America
ReceivedSeptember 11, 2012;AcceptedMarch 7, 2013;PublishedApril 18, 2013
Copyright:ß2013 Liu et al. This is an open-access article distributed under the terms of the Creative Commons Attribution License, which permits unrestricted use, distribution, and reproduction in any medium, provided the original author and source are credited.
Funding:The research was supported by funds of the National High-tech R&D Program (2011AA100301); National Nonprofit Institute Research Grant (2010jc-1); the earmarked fund for modern agro-industry technology research system (CARS-42). The funders had no role in study design, data collection and analysis, decision to publish, or preparation of the manuscript.
Competing Interests:The authors have declared that no competing interests exist. * E-mail: [email protected]
.The authors contributed equally to this work.
Introduction
With the advance of high-throughput genotyping platforms, much effort has been spent on identifying molecular markers and genes related to complex traits using genome-wide association studies (GWAS) in several species.
In the field of animal breeding, loci or narrow regions affecting milk production, fertility and growth traits in cattle [1–3], body composition, intramuscular fat content, meat color in pigs [4,5] and growth and egg quality in chickens [6,7] have been detected successfully using genome-wide association studies. Such informa-tion helps in the development of marker assisted breeding as well as by improving understanding of the molecular mechanisms underlying the target traits.
Body composition and meat quality in broilers are important economic traits. Body composition traits have been analyzed using QTL techniques in F2 crosses between various lines of chickens. A total of 146 QTLs reaching significance have been
reported via genome scans based on marker-QTL linkage analyses (http://www.animalgenome.org/cgi-bin/QTLdb/GG/ index,July,2012), which associated with eight body composition traits: carcass weight, dressed percentage, weight and percentage of breast muscle, thigh muscle and abdominal fat. Similar studies on meat quality traits are rare except for 10 QTLs reported for pH value. Application of these QTL results in broiler breeding remains impracticable because of the low precision of mapping.
Materials and Methods Ethics Statement
The animal component of this study was conducted in accordance with the Guidelines for the Experimental Animals, established by the Ministry of Science and Technology (Beijing, China). Blood was collected from the brachial vein of the chickens at 80 d by venipuncture, using citrated syringes during a routine health inspection at the experimental station of the Chinese Academy of Agricultural Sciences (CAAS). Animal experiments were approved by the Science Research Department (in charge of animal welfare issue) of the Institute of Animal Sciences, CAAS (Beijing, China).
Birds and Phenotypic Traits
The 728 male Beijing-You chickens were generated from 50 half-sib families. The 50 sires and 250 dams were chosen from conservation stock for this breed and were unrelated. The Beijing-You chickens maintained by the Institute of Animal Sciences, CAAS and have not been subjected to any systematic selection for any trait. All birds were reared in stair-step caging under the same recommended nutritional and environmental conditions. A total of 16 carcass and meat quality traits were measured for the GWAS studies: carcass weight (including feet and head, CW), eviscerated weight (EW), breast weight (BrW), thigh muscle weight (ThW), abdominal fat weight (AbFW), dressed percentage (DP), eviscer-ated yield, as a percentage of CW (EWP), BrW, ThW and AbFW as percentages of EW (BrP, ThP, AbFP), dry matter and intramuscular fat contents of breast and thigh muscle (DMBr, DMTh, IMFBrand IMFTh), ultimate pH (pHu), and shear force (SF) of thepectoralis majormuscle. The measurements and data were obtained as follows:
After a 12-h fast, birds were weighed (LW) and slaughtered at d 100 by standard commercial procedures and CW was recorded. The removable adipose tissues surrounding the proventriculus and gizzard along with those located around the cloaca were weighed as AbFW [8,9]. Then EW was weighed. Carcasses were then dissected into deboned, skinless thighs and breasts for weighing and storage at220uC until used.
The data for CW and EW were also expressed as percentages on the basis of LW and CW, respectively (DP and EWP). The pHu was the mean of three measurements taken from the left breast muscle after 24-h storage at 4uC (IQ150 pH meter (Hach Company, Loveland, USA). Shear force was determined on breast muscles following Li’s method [10] using a universal Warner-Bratzler testing machine MTS Synergie 200 (G-R Manufacturing Company, Manhattan, KS). Dry matter (DM) and IMF in muscle were determined for 20 g samples of the right breast and thigh after removing obvious fat, mincing, and drying in two stages (,12 h each at 65uC then 105uC, as described by Cui et al [11]. The DM content was expressed on the basis of fresh muscle weight. The IMF was measured by Soxhlet extraction with anhydrous diethyl ether and was expressed as a percentage of muscle DM.
One-day-old hatchlings with similar genetic background were reared in the same conditions as above. On each of weeks 4, 8, 10, 12, and 14, six to eight birds of similar weight were randomly selected, stunned, and euthanized using approved procedures. Breast muscle was rapidly dissected, weighed, snap-frozen in liquid nitrogen, and stored at280uC for mRNA extraction.
Genotyping and Quality Control
Genomic DNA was extracted from the blood samples using phenol-chloroform and was diluted to 50 ng/ml. Each chicken was
genotyped using the Illumina 60 K Chicken SNP Beadchip (DNA LandMarks Inc., Saint-Jean-sur-Richelieu, Quebec, Canada). Of the total of 728 chickens, four were excluded because sample call rate was,95%. Approximately 20% (12,088) of the SNPs were removed for one or more of the following: low call rate (,95%), minor allelic frequency (,0.01) and Hardy-Weinberg equilibrium (HWE) test (p,1E206), or chromosomal location was unknown. After imposing these constraints, 724 individuals and 45,548 SNP markers that distributed on 30 autosomes and the Z chromosome (Table 1) were used for the genome-wide association analyses.
Statistical Analysis
The SNPs that were significantly associated with the phenotypic traits were identified using both simple (GLM,I) and compressed mixed linear (MLM,II) models [12]:
Y~XazFbze ð1Þ
Y~XazKmze ð2Þ
whereYis the phenotypic value,Xis the genotype (45,548 SNPs), F is the family, and K is the relative kinship matrix; Xa were regarded as fixed effects, whileFband Km were random effects, andeis the random error.
The relative kinship matrix (K) was constructed from 8,006 independent SNP markers, acquired using Plink v1.07 software [13] through all autosomal SNPs, pruned using the indep-pairwise option, with a window size of 25 SNPs, a step of 5 SNPs, and r2 threshold of 0.2. The analyses were performed using TASSEL 3.0 software [14].
The raw data for some traits (AbFP, AbFW, IMFBr, DMTh, pHu and SF) deviated from normality and Box-Cox or Johnson transformations were applied using Minitab 15 (http://www. minitab.com). Significance thresholds were established from the estimated number of independent SNP markers and LD blocks, defined as a set of contiguous SNPs having pairwise r2 values .0.40. Using this approach, the estimated total number of independent SNP markers and LD blocks was 19,284. The two threshold P-values were therefore set at 5.19E205 (1/19,284) for suggestive significance, and 2.59E206 (0.05/19,284) for genome-wide significance [15].
Quantile-quantile (Q-Q) plots for each trait and Manhattan plots of genome-wide association analyses were produced with R 2.13.2 software (http://www.r-project.org/).
Quantitative Measurement of mRNA
The methods for quantitative measurement of mRNA were referred to Li’s methods [10]. Primers for the genes NCOA7, TPD52L1, FABP7, GJA1 and ASF1A were designed (Primer Premier 5.0) from the GenBank sequences (Table 2).
Results
revealed by the compressed MLM analyses because the population structure effect shown under the GLM model could be controlled effectively when the compressed MLM was used (Figure S1). Of the SNPs revealed by the compressed MLM model, status of SNPs that reached genome-wide significance exposed by the simple model were also indicated.
Loci and Genes for Traits Related to Body Composition Carcass Weight (CW). As detailed in Table 5, there were 10 SNPs that were significantly associated with CW from the compressed MLM, of which six were of genome-wide significance by analysis with MLM and/or GLM. Seven of the SNPs on chicken (Gallus gallus) chromosome 4 (GGA4) were clustered within a 1.06 Mb region (between 78,475,066 bp and 79,531,679 bp), and are located either within or 19 kb–236 kb away from the nearest known genes: ligand dependent nuclear receptor corepressor-like protein (LCORL), leucineamino peptidase
3 (LAP3), quinoid dihydro pteridine reductase (QDPR); LIM domain-binding protein 2 (LDB2), transmembrane anterior posterior transformation1 (TAPT1). The two SNPs on GGA1 are located within dachshund homolog 1 (Drosophila) (DACH1).
Eviscerated Weight (EW). In the case of EW, nine significant SNPs were identified by compressed MLM, of which five were of genome-wide significance by GLM analysis. The six SNPs on GGA4 are the same as those found for CW but there were slight differences in which of them were of greater significance (Table 5). The one SNP on GGA1, withinDACH1, was also the same as that associated with CW. The remaining two SNPs were on GGA7 and GGA19, neither was associated with any other trait.
Dressed Percentage (DP) and Percentage of Eviscerated Weight (EWP). As seen from Table 5, three SNPs with suggestive significance for DP were identified by the two methods. The two SNPs on GGA4 were in the vicinity (within 92 and
Table 1.Distributions of SNPs after quality control and the average distances between adjacent SNPs on each chromosome.
Chromosome Physical Map (Mb)1 No. of SNP markers Average distance (kb)
1 200.9 7224 27.81
2 154.8 5419 28.57
3 113.6 4101 27.7
4 94.2 3294 28.6
5 62.2 2205 28.21
6 37.3 1680 22.2
7 38.3 1809 21.17
8 30.6 1376 22.24
9 25.5 1190 21.43
10 22.5 1307 17.21
11 21.9 1196 18.31
12 20.5 1363 15.04
13 18.9 1129 16.74
14 15.8 1034 15.28
15 13 1017 12.78
16 0.4 21 19.05
17 11.2 864 12.96
18 10.9 831 13.12
19 9.9 825 12
20 13.9 1493 9.31
21 6.9 794 8.69
22 3.9 277 14.08
23 6 619 9.69
24 6.4 684 9.36
25 2 176 11.36
26 5.1 646 7.89
27 4.7 451 10.42
28 4.5 556 8.09
E222 0.9 103 8.74
E642 0.05 3 16.61
Z 74.6 1861 40.09
Total 10131.4 45548 534.75
Note:1physical length of the chromosome was based on the position of the last marker in the WASHUC2 build; 2E22 and E64 are linkage groups.
102 kb) of ubiquitin carboxy-terminal hydrolase L1 (UCHL1) and neuronal acetylcholine receptor subunit alpha-9 (CHRNA9). The SNP on GGA17 was in close proximity (8 kb) to F-box/WD repeat-containing protein 5 (FBXW5). No SNPs associated with the percentage of eviscerated yield (EWP) were found.
Breast muscle Weight (BrW) and Percentage (BrP). Associations identified with these breast muscle traits are shown in Table 6. All 19 SNPs on GGA3 were detected as being significantly associated with BrW (most at the genome-wide level) and clustered within a 5.74 Mb region (61,828,480 bp 268,570,699 bp). There were 15 SNPs, within a similar region, significantly associated with BrP; 11 were common to the two obviously related traits. Most of the SNPs located within or near RNA methyltransferase 11 (TRMT11), nuclear receptor coacti-vator (NCOA7), tumor protein D53 (TPD52L1), fatty acid binding
protein 7 (FABP7) and gap junction protein, alpha 1 (GJA1) genes. Noteworthy are the SNPs with extreme signals (P = 2.37E215 and 9.78E213 for BrW and 1.98E218 and 6.12E215 for BrP) located near FABP7 and GJA1, accounting for more than 8% of the phenotypic variance of BrW and BrP (Table S1).
Thigh muscle Weight (ThW) and Percentage (ThP). Four SNPs, significantly associated with ThW were identified by compressed MLM and occurred on GGA3, GGA11, GGA2 and GGA16; those on GGA3 and GGA11 were of genome-wide significance (Table 7). The SNP on GGA3 was also associated with LW, though of slightly lesser significance. The significant SNP on GGA11was close (8 kb) to nuclear transport factor 2 (NUTF2) and this locus was also associated with ThP. The other SNP for ThP was of genome-wide significance and was on GGA2, just 2 kb from forkhead box N4 (FOXN4).
Table 2.The specific primers for RT-PCR and q-PCR in this study.
Gene Sequence
Product
size (bp) Cycle profile Accession number
FABP7 F: 59-CGTGATCAGGACTCAGAGCA-39
R: 59-TCTCTTTGCCATCCCATTTC-39
158 95uC for 30 s,95uC for 5 s and 60uC for 32 s (40 cycles)
NM_205308.2
TPD52L1 F: 59-TCAGCGTACAAGAAGACGCA-39
R: 59-GGCATGCTTATGGAATGGCG-39
152 95uC for 30 s,95uC for 5 s and 60uC for 32 s (40 cycles)
NM_204215.1
NCOA7 F: 59-CAATTGTTCCAGGCCAGATT-39
R: 59-TCTTGCCAAATCAGCATCAG-39
137 95uC for 30 s,95uC for 5 s and 60uC for 32 s (40 cycles)
NM_001012878.1
GJA1 F: 59-CATCAGCAGCGCCAATATC-39
R: 59-TTCATCTCCCCAAGCAGACT-39
171 95uC for 30 s,95uC for 5 s and 60uC for 32 s (40 cycles)
NM_204586.2
ASF1A F: 59-GACCTGTCGGAAGATTTGGA-39
R: 59-GGAATAAGCCCTGGGTTAGG-39
158 95uC for 30 s,95uC for 5 s and 60uC for 32 s (40 cycles)
NM_001044690.1
b-actin F: 59-GAGAAATTGTGCGTGACATCA-39
R: 59-CCTGAACCTCTCATTGCCA-39
152 95uC for 30 s,95uC for 5 s and 60uC for 32 s (40 cycles)
NM_205518
doi:10.1371/journal.pone.0061172.t002
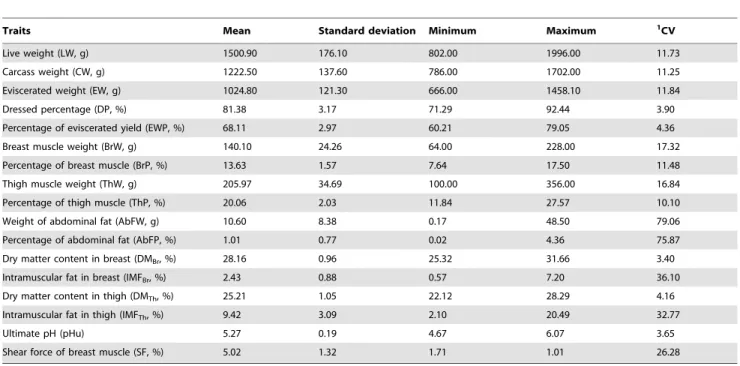
Table 3.Descriptive statistics of phenotypic data.
Traits Mean Standard deviation Minimum Maximum 1CV
Live weight (LW, g) 1500.90 176.10 802.00 1996.00 11.73
Carcass weight (CW, g) 1222.50 137.60 786.00 1702.00 11.25
Eviscerated weight (EW, g) 1024.80 121.30 666.00 1458.10 11.84
Dressed percentage (DP, %) 81.38 3.17 71.29 92.44 3.90
Percentage of eviscerated yield (EWP, %) 68.11 2.97 60.21 79.05 4.36
Breast muscle weight (BrW, g) 140.10 24.26 64.00 228.00 17.32
Percentage of breast muscle (BrP, %) 13.63 1.57 7.64 17.50 11.48
Thigh muscle weight (ThW, g) 205.97 34.69 100.00 356.00 16.84
Percentage of thigh muscle (ThP, %) 20.06 2.03 11.84 27.57 10.10
Weight of abdominal fat (AbFW, g) 10.60 8.38 0.17 48.50 79.06
Percentage of abdominal fat (AbFP, %) 1.01 0.77 0.02 4.36 75.87
Dry matter content in breast (DMBr, %) 28.16 0.96 25.32 31.66 3.40
Intramuscular fat in breast (IMFBr, %) 2.43 0.88 0.57 7.20 36.10
Dry matter content in thigh (DMTh, %) 25.21 1.05 22.12 28.29 4.16
Intramuscular fat in thigh (IMFTh, %) 9.42 3.09 2.10 20.49 32.77
Ultimate pH (pHu) 5.27 0.19 4.67 6.07 3.65
Shear force of breast muscle (SF, %) 5.02 1.32 1.71 1.01 26.28
1
Weight and Percentage of Abdominal Fat (AbFW, AbFP). Two SNPs, of genome-wide significance for AbFW by GLM, were found on GGA23; one in the vicinity (14.8 kb away) from small nuclear ribonucleoprotein 40 kDa (U5) (SNRNP40) and the other was 11.7 kb from pumilio homolog 1 (PUM1). Of the two SNPs identified by compressed MLM to be associated with AbFP, the one on GGA2 was of genome-wide significance by GLM and was 209.8 kb from a human reference gene, human zinc finger protein 521 (ZNF521), with 86.4% sequence identity with the chicken genome. The other detected SNP, on GGA17, had proximity (within 51.6 kb) to ankyrin repeat and SOCS box protein 6 (ASB6) (Table 7).
Loci and Genes for Meat Quality Traits
The SNPs associated with four traits related to meat quality are provided in Table 8; no SNPs were significantly associated with intramuscular fat content of thigh (IMFTh) and shear force (SF) of breast muscle.
Dry Matter content in Breast (DMBr). Five SNPs of significance were identified, located on GGA2 and GGA27. The three SNPs on GGA2 are in the vicinity of or within angiopoietin 1 (ANGPT1). The SNPs on GGA27 have some proximity to FtsJ homolog 3 (E. coli, FTSJ3); SNP Gga_rs16205470 was the only SNP related to meat quality shown to have genome-wide significance.
Intramuscular Fat in Breast (IMFBr). Two significant SNPs were identified and located on GGA2 and GGA5. The SNP on GGA2 is 120.9 kb away from cholecystokinin (CCK). The SNP on GGA5 is 159.7 kb from Toll interacting protein (TOLLIP).
Dry Matter content in Thigh (DMTh). Six significant SNPs associated with DMTh were identified and located on GGA1, GGA2 and GGA8. The SNP on GGA2 is 208.4 kb away from suppressor of cytokine signaling 6 (SOCS6). The SNP on GGA8 is 8.5 kb from UMP-CMP kinase (CMPK1).The four SNPs on GGA1 are clustered within a 1.30 Mb region with no annotated genes nearby.
Ultimate pH (pHu). Eleven significant SNPs were identified and located on GGA2, GGA4 and GGA7. The eight SNPs on GGA2 are distributed within a 2.06 Mb region and only one gene (Polypeptide N-acetylgalactosaminyltransferase 1, GALNT1) is in the vicinity. Two SNPs on GGA4 located within protocadherin 19 (PCDH19) or 286.3 kb away from diaphanous homolog 1 (DIAPH1). The SNP on GGA7 located 143.9 kb from the secreted phosphoprotein 2 (SPP2).
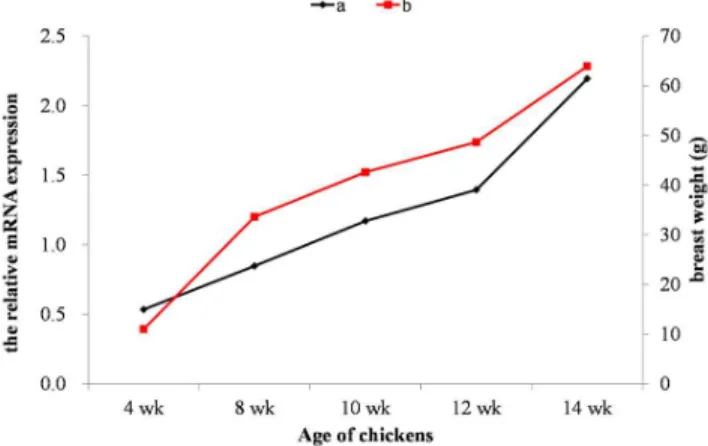
Validation of Candidate Genes for BrW and BrP from GWAS by Q-PCR
Expression of candidate genes detected near associated signals for BrW and BrP in the GWAS analysis was further tested by real-time quantitative PCR (Q-PCR) in breast muscle. After measuring the mRNA content of five genes (NCOA7, TPD52L1, FABP7, GJA1,ASF1A) located in a 0.65 Mb region for BrW and BrP, the change inGJA1expression was found to be consistent with that of the breast muscle weight across development (4, 8, 10, 12 and 14 week) (Figure 2). The correlation betweenGJA1mRNA and BrW was moderate (r = 0.554) and significant at the 0.001 level. It is highly possible thatGJA1is a functional gene for breast muscle development in chickens.
Discussion
Genome-wide Association Analysis
To identify potential loci and candidate genes affecting chicken body composition and meat quality traits, GWAS studies were performed using a conservation population of Beijing-You (BJY) chickens. The BJY chicken is one representative indigenous breed in China [16], a color-feathered, slow-growing chicken and has superior quality of meat products [17,18]. Most of the traits tested showed considerable ranges between maximal and minimal values (Table 3), as would be expected in a population being maintained for the conservation of genetic diversity; this variability would be expected to increase the power of the GWAS.
Two statistical methods, compressed mixed linear model (MLM) and generalized linear model (GLM), were implemented to analyze association between SNPs and phenotypes. Emphasis is placed on the associations revealed by the compressed MLM analyses because population structure effect could be controlled and false positives could be reduced with this approach, as shown in Q-Q plots (Figure S1). However, because the degree of association might be reduced in MLM [19], so of the SNPs revealed by compressed MLM, status of SNPs that reached genome-wide significance exposed by the simple model were also indicated. In addition, because many SNPs reaching suggestive association in both MLM and GLM located within similar regions to those with genome-wide significance, it is proposed that SNPs with suggestive association also indicate important loci.
Loci and Genes for Traits Related to Body Composition Breast muscle yield is the most important carcass component in meat-type chickens because of the high premium paid by consumers. Of special interest, one important region (61.83 Mb– 68.57 Mb) on GGA3 was identified as being associated with BrW and BrP. Most of the SNPs were located within or near tRNA methyltransferase 11 (TRMT11), nuclear receptor coactivator (NCOA7), tumor protein D53 (TPD52L1), fatty acid binding protein 7 (FABP7) and gap junction protein, alpha 1(GJA1) genes. Of these five genes, only the change ofGJA1(gap junction protein, alpha 1) expression was consistent with that of BrW across development (4, 8, 10, 12 and 14 week) and the correlation between mRNA level and BrW was significant (p,0.001). Thus, it is highly possible thatGJA1is a functional gene for chicken breast muscle development. This result might supply a novel functional gene for breast muscle development and extent the known function ofGJA1which has been found to play a role in skeletal form [20,21]. In practical breeding programs, birds could be selected for breeding stock based on the desired allele inGJA1for BrW and BrP.
For CW and EW, one consistent region was identified (about 78.47 Mb to 79.53 Mb) on GGA4, which corresponded to QTL
Table 4.Phenotypic mean, standard deviation and status of normalization for non-normal traits after the transformation.
Traits Mean
Standard deviation
Status of normalization
AbFW 2.62E202 0.94 Yes
AbFP 3.29E202 0.97 Yes
IMFBr 8.93E201 0.41 Yes
DMTh 5.20E203 0.99 Yes
SF 2.14E202 1.02 Yes
regions previously reported [22,23]. There were seven significant SNPs located near four functional genes (LCORL, LAP3, LDB2, and TAPT1). Polymorphisms in LCORL have been detected to associate with human skeletal frame size, linear growth [24–27] and feed intake and growth of cattle [28]. The LIM domain-binding factor 2 (LDB2) has been associated with chicken body weight (7–12 wk) and average daily gain (6–12 wk) in another GWAS study [15]. The transmembrane protein, TAPT1, involved in transporting molecules across membranes, was speculated [29] to be a downstream effector of HOXC8 that may relate to axial skeletal patterning during development. The amino peptidase LAP3 catalyzes the removal of amino acids and peptides as part of protein maturation and degradation [30].
On GGA1, significant SNPs associated with both CW and EW were found within DACH1 and this gene located near a QTL region known to be related to CW [31]. The gene DACH1 is a target of FGF signaling during limb skeletal development [32]. In addition, two significant SNPs located in GGA3 were found to
relate with LW and were also in the QTL region for 40d body weight and 21d body weight, respectively [33,34].
The SNP Gga_rs14402759 on GGA3 was found to associate with both ThW and LW, and this locus was nearMYCN. These two associations are consistent with the relatively high correlation (r2= 0.75) found between two traits, which possibly reflects their being controlled by common loci.
Loci and Genes for Traits Related to Meat Quality Traits Three significant SNPs on GGA2 were found to associate with DMBr and were located in the vicinity of or within ANGPT1. Angiopoietin-1 (ANGPT1) is an angiogenesis factor that is also an important modulator of skeletal muscle function [35]. Angiopoie-tin-1 (ANGPT1) is mainly produced by cardiac, skeletal and smooth muscle cells, and adventitial cells [36]. The additional two SNPs on GGA27 were nearFTSJ3(a putative ortholog of yeast Spb1p) and conditional knockdown revealed that depletion of Figure 1. Manhattan plots showing association of all SNPs with carcass and meat quality traits from compressed MLM.SNPs are plotted on the x-axis according to their position on each chromosome against association with these traits on the y-axis (shown as -log10 p-value). The black dashed line indicates genome-wise significance of suggestive association (p-value = 5.19E205), and the red dashed line shows genome-wise 5% significance with a p-value threshold of 2.59E206. Abbreviations: CW, carcass weight; EW, eviscerated weight; DP, dressed percentage; BrW, breast muscle weight; BrP, percentage of breast muscle; ThW, thigh muscle weight; ThP, Percentage of thigh muscle; AbFW, weight of abdominal fat; AbFP, percentage of abdominal fat; DMBr,dry matter content in breast;IMFBr, intramuscular fat in breast; DMTh, dry matter content in thigh; pHu,
ultimate pH.
doi:10.1371/journal.pone.0061172.g001
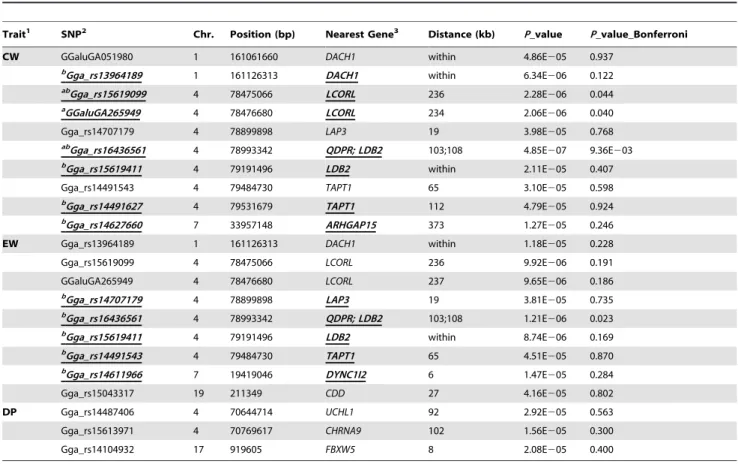
Table 5.SNPs with genome-wide and suggestive significance for carcass weight, eviscerated weight and dressed percentage traits.
Trait1 SNP2 Chr. Position (bp) Nearest Gene3 Distance (kb) P_value P_value_Bonferroni
CW GGaluGA051980 1 161061660 DACH1 within 4.86E205 0.937
bGga_rs13964189 1 161126313 DACH1 within 6.34E206 0.122 ab
Gga_rs15619099 4 78475066 LCORL 236 2.28E206 0.044
aGGaluGA265949 4 78476680 LCORL 234 2.06E
206 0.040
Gga_rs14707179 4 78899898 LAP3 19 3.98E205 0.768
abGga_rs16436561 4 78993342 QDPR; LDB2 103;108 4.85E207 9.36E203 bGga_rs15619411 4 79191496 LDB2 within 2.11E
205 0.407
Gga_rs14491543 4 79484730 TAPT1 65 3.10E205 0.598
bGga_rs14491627 4 79531679 TAPT1 112 4.79E205 0.924 bGga_rs14627660 7 33957148 ARHGAP15 373 1.27E
205 0.246
EW Gga_rs13964189 1 161126313 DACH1 within 1.18E205 0.228
Gga_rs15619099 4 78475066 LCORL 236 9.92E206 0.191
GGaluGA265949 4 78476680 LCORL 237 9.65E206 0.186
bGga_rs14707179 4 78899898 LAP3 19 3.81E205 0.735 bGga_rs16436561 4 78993342 QDPR; LDB2 103;108 1.21E206 0.023 bGga_rs15619411 4 79191496 LDB2 within 8.74E
206 0.169
bGga_rs14491543 4 79484730 TAPT1 65 4.51E205 0.870 bGga_rs14611966 7 19419046 DYNC1I2 6 1.47E205 0.284
Gga_rs15043317 19 211349 CDD 27 4.16E205 0.802
DP Gga_rs14487406 4 70644714 UCHL1 92 2.92E205 0.563
Gga_rs15613971 4 70769617 CHRNA9 102 1.56E205 0.300
Gga_rs14104932 17 919605 FBXW5 8 2.08E205 0.400
Note:1CW, carcass weight; EW, eviscerated weight; DP, dressed percentage;
2SNPs with superscript ‘‘a’’ were of genome-wide significance by compressed MLM, those with superscript ‘‘b’’ were significant by GLM, and those with superscript ‘‘ab’’
were significant by both methods; these SNPs are shown underlined inboldface;
3The nearest known gene to the genome-wide significant SNPs are shown underlined inboldface.
FTSJ3 affects HEK293 cell proliferation and causes pre-rRNA processing defects [37].
For DMTh, four SNPs of suggestive significance on GGA1 were clustered within a 1.3 Mb region, currently lacking any annotated gene. Another SNP on GGA2 was located nearSOCS6, which is involved in the regulation of glucose metabolism and plays an important role in regulating insulin actionin vivo[38].
A SNP on GGA2 was associated with IMFBrand cholecysto-kinin (CCK) was found nearby. The gut hormone CCK plays a multiplicity of roles, including those influencing digestion of fat [39].
For ultimate pH, eight SNPs within a 2.06 Mb region on GGA2 were identified although only one known gene
(N-acetylgalacto-saminyltransferase 1,GALNT1) has been found near this region. The encoded protein catalyzes the transfer of N-acetylgalactosa-mine (GalNAc) from UDP-GalNAc to the hydroxyl group of a serine or threonine residues on proteins with O-linked glycosylation, a common post-translational modification. Two significant SNPs were found on GGA4, withinPCDH19and near DIAPH1, respectively, and another on GGA7 near SPP2. Protocadherin-19 (PCDH19) plays a role as an adhesion protein in optic nerve fiber bundling, optic nerve targeting, and/or synapse formation [40]. The geneDIAPH1encodes a protein that may have a role in the regulation of actin polymerization in hair cells of the inner ear. The SPP2 gene encodes a secreted phosphoprotein that is a member of the cystatin superfamily.
Table 6.SNPs with genome-wide and suggestive significance for breast muscle weight and percentage of breast muscle.
Trait1 SNP2 Chr. Position Nearest Gene3 Distance (kb) P_value P_value_Bonferroni
BrW Gga_rs14365357 3 61828480 TRMT11 307 2.84E206 0.055
aGGaluGA224777 3 62085586 TRMT11 50 7.59E207 0.015
Gga_rs15367914 3 62189978 NCOA7 within 1.06E205 0.204
aGGaluGA224820 3 62206992 NCOA7 within 2.50E
206 0.048
aGga_rs14735513 3 62636566 TPD52L1 51 4.40E210 8.48E206
GGaluGA224956 3 62693188 TPD52L1 108 8.46E206 0.163
GGaluGA224987 3 62817611 TPD52L1 232 2.16E205 0.417
aGga_rs16286357 3 63552711 FABP7 290 2.37E215 4.56E211 a
Gga_rs14366273 3 63744854 FABP7 98 4.75E208 9.15E204
Gga_rs16286470 3 63784515 FABP7 58 5.09E206 0.098
aGGaluGA225255 3 64382440 GJA1 27 4.93E208 9.50E204 aGga_rs16287013 3 64403287 GJA1 6 4.93E208 9.50E204 aGga_rs14366866 3 64788921 GJA1 371 9.78E
213 1.89E208
aGga_rs14366948 3 64891040 GJA1 473 5.73E207 0.011 aGga_rs16287534 3 64938719 ASF1A 498 8.16E210 1.57E205 aGGaluGA225384 3 65001206 ASF1A 436 9.94E
208 1.92E203
GGaluGA226040 3 66996816 HDAC2 449 3.99E205 0.768
aGga_rs14369404 3 67826596 LOC396473 307 2.41E206 0.047
Gga_rs13690373 3 68570699 FYN 38 1.19E205 0.229
BrP aGGaluGA224327 3 59817231 gene desert 2 1.37E206 0.025
aGGaluGA224777 3 62085586 TRMT11 50 7.98E207 0.015 aGga_rs14735513 3 62636566 TPD52L1 51 1.54E
212 2.98E208
aGGaluGA224956 3 62693188 TPD52L1 108 1.08E
207 2.08E203
GGaluGA224987 3 62817611 TPD52L1 232 3.29E206 0.064
Gga_rs14365946 3 62858153 TPD52L1 273 3.36E206 0.065
aGga_rs16286357 3 63552711 FABP7 290 1.98E
218 3.82E214
aGga_rs14366273 3 63744854 FABP7 98 8.63E210 1.66E205 a
Gga_rs16286470 3 63784515 FABP7 58 4.85E207 9.35E203
aGGaluGA225255 3 64382440 GJA1 27 5.81E
210 1.12E205
aGga_rs16287013 3 64403287 GJA1 6 5.81E210 1.12E205 a
Gga_rs14366866 3 64788921 GJA1 371 6.12E215 1.18E210
aGga_rs14366948 3 64891040 GJA1 473 1.24E
206 0.024
aGga_rs16287534 3 64938719 ASF1A 498 3.01E209 5.81E205 aGGaluGA225384 3 65001206 ASF1A 436 6.34E207 0.012
Note:1BrW, breast muscle weight; BrP, percentage of breast muscle weight;
2SNPs with superscript ‘‘a’’ were of genome-wide significance by compressed MLM, those with superscript ‘‘b’’ were significant by GLM, and those with superscript ‘‘ab’’
were significant by both methods; these SNPs are shown underlined inboldface;
3The nearest known gene to the genome-wide significant SNPs are shown underlined inboldface.
Table 7.SNPs with genome-wide and suggestive significance for thigh muscle weight, percentage of thigh muscle, weight of abdominal fat and percentage of abdominal fat traits.
Trait1 SNP2 Chr. Position NearestGene3 Distance(kb) P_value P_value_Bonferroni
ThW bGga_rs14402759 3 102055329 MYCN 59 1.40E205 0.270
abGga_rs14017512 11 909864 NUTF2 8 5.27E
207 0.010
GGaluGA086699 12 13524309 PTPRG 145 1.92E205 0.371
Gga_rs15788030 16 138076 TRIM39 within 4.32E205 0.833
ThP Gga_rs14017512 11 909864 NUTF2 8 1.69E205 0.327
bGGaluGA108614 15 6871802 FOXN4 2 3.07E205 0.591
AbFW bGga_rs16186066 23 519991 PUM1 11.7 1.09E205 0.209 bGGaluGA187223 23 525122 SNRNP40 14.8 9.90E
206 0.191 AbFP bGga_rs14228798 2 106553422 ZNF521(H) 209.8 4.03E205 0.799
Gga_rs15030858 17 6149544 ASB6 51.6 1.41E205 0.279
Note:1ThW, thigh muscle weight; ThP, percentage of thigh muscle; AbFW, weight of abdominal fat; AbFP, percentage of abdominal fat;
2SNPs with superscript ‘‘a’’ were of genome-wide significance by compressed MLM, those with superscript ‘‘b’’ were significant by GLM, and those with superscript ‘‘ab’’
were significant by both methods; these SNPs are shown underlined inboldface;
3The nearest known gene to the genome-wide significant SNPs are shown underlined inboldface.
doi:10.1371/journal.pone.0061172.t007
Table 8.SNPs with genome-wide and suggestive significance for meat quality traits.
Trait1 SNP2 Chr. Position
Nearest
Gene3 Distance(kb) P_value P_value_Bonferroni
DMBr Gga_rs16137527 2 136845425 ANGPT1 96.9 4.5E205 0.862
GGaluGA169253 2 137046977 ANGPT1 Within 3.7E205 0.712
GGaluGA169274 2 137165373 ANGPT1 33.2 3.7E205 0.712
Gga_rs15238188 27 1784703 FTSJ3 177.5 1.0E205 0.192
ab
Gga_rs16205470 27 1822879 FTSJ3 215.7 1.4E206 0.028
IMFBr Gga_rs14173354 2 43728839 CCK 120.9 4.80E205 0.926
Gga_rs16470339 5 15951489 TOLLIP 159.7 2.98E205 0.575
DMTh Gga_rs15447898 1 146173970 gene desert 2 2.64E205 0.508
Gga_rs14897593 1 146262528 gene desert 2 2.64E205 0.508
Gga_rs13949933 1 146286933 gene desert 2 3.69E205 0.711
Gga_rs13711523 1 146304286 gene desert 2 2.64E205 0.508
Gga_rs16070025 2 95730386 SOCS6 208.4 9.98E206 0.192
GGaluGA329954 8 22682464 CMPK1 8.5 1.95E205 0.376
pHu GGaluGA155419 2 83950900 gene desert 2 4.92E206 0.098
GGaluGA155426 2 83978295 gene desert 2 4.92E206 0.098
Gga_rs15121008 2 84587977 gene desert 2 1.38E205 0.274
Gga_rs15121015 2 84712690 gene desert 2 1.38E205 0.274
Gga_rs15121029 2 84862485 gene desert 2 1.38E205 0.274
Gga_rs15121036 2 84947884 gene desert 2 7.98E206 0.158
Gga_rs15121102 2 85115430 gene desert 2 1.38E205 0.274
Gga_rs16050844 2 86015253 GALNT1 66.6 9.80E206 0.194
Gga_rs14422922 4 5263499 PCDH19 Within 4.89E205 0.969
Gga_rs15483905 4 6275672 DIAPH1 286.3 1.04E205 0.207
Gga_rs14603569 7 5742651 SPP2 143.9 3.54E205 0.701
Note:1DM
Br, dry matter content in breast muscle; IMFBr, intramuscular fat content in breast; DMTh, dry matter content in thigh muscle; pHu, ultimate pH; 2SNPs with superscript ‘‘a’’ were of genome-wide significance by compressed MLM, those with superscript ‘‘b’’ were significant by GLM, and those with superscript ‘‘ab’’
were significant by both methods; these SNPs are shown underlined inboldface;
3The nearest known gene to the genome-wide significant SNPs are shown underlined inboldface.
These proteins play important roles in tumorigenesis, stabilization of matrix metalloproteinases, glomerular filtration rate, immuno-modulation, and neurodegenerative diseases.
A number of candidate loci associated with meat quality and fat traits were identified, but common loci or genes for these traits were rare. These results reinforce the notion of complexity in the genetic basis underlying meat quality and fat deposition; to a certain extent, they might be influenced by epigenetic factors [41].
Supporting Information
Figure S1 Quantile-quantile (Q-Q) plots of the GLM (red dots) and compressed models (blue dots) for carcass and meat quality traits.Plotted on the x-axis are the expected p-values under the null hypothesis and on the y-axis are the observed p-values. A: CW, carcass weight; B, EW, eviscerated weight; C, DP, dressed percentage; D, EWP, percentage of eviscerated yield; E, BrW, breast muscle weight; F, BrP, percentage of breast muscle; G, ThW, thigh muscle weight; H, ThP, Percentage of thigh muscle; I, AbFW, weight of abdominal fat; J, AbFP, percentage of abdominal fat; K, DMBr, dry matter content in breast; L, IMFBr, intramuscular fat in breast; M, DMTh, dry matter content in thigh; N, IMFTh, intramuscular fat in thigh; O, pHu, ultimate pH, P, SF, shear force of breast muscle.
(TIF)
Table S1 Information for all significant SNPs related to body composition and meat quality traits.
(XLSX)
Acknowledgments
The authors would like to acknowledge W. Bruce Currie (Emeritus Professor, Cornell University) for and Md. Shahjahan (Institute of Animal Sciences, Chinese Academy of Agricultural Sciences) for their assistance in preparing the manuscript.
Author Contributions
Conceived and designed the experiments: RL GZ JW. Performed the experiments: RL YS GZ FW DW MZ LZ YH. Analyzed the data: RL YS DW GZ. Contributed reagents/materials/analysis tools: JC. Wrote the paper: RL YS JW.
References
1. Jiang L, Liu J, Sun D, Ma P, Ding X, et al. (2010) Genome wide association studies for milk production traits in Chinese Holstein population. PLoS One 5: e13661.
2. Sahana G, Guldbrandtsen B, Bendixen C, Lund MS (2010) Genome-wide association mapping for female fertility traits in Danish and Swedish Holstein cattle. Animal Genetics 41: 579–588.
3. Bolormaa S, Hayes BJ, Savin K, Hawken R, Barendse W, et al. (2011) Genome-wide association studies for feedlot and growth traits in cattle. Journal of Animal Science 89: 1684–1697.
4. Fan B, Onteru SK, Du ZQ, Garrick DJ, Stalder KJ, et al. (2011) Genome-Wide Association Study Identifies Loci for Body Composition and Structural Soundness Traits in Pigs. Plos One 6 (2): e14726.
5. Luo W, Cheng D, Chen S, Wang L, Li Y, et al. (2012) Genome-wide association analysis of meat quality traits in a porcine Large White x Minzhu intercross population. International Journal of Biological Sciences 8: 580–595. 6. Xie L, Luo C, Zhang C, Zhang R, Tang J, et al. Genome-wide association study
identified a narrow chromosome 1 region associated with chicken growth traits. PLoS One. 2012;7(2): e30910.
7. Xie L, Luo C, Zhang C, Zhang R, Tang J, et al. (2012) Genome-wide association study identified a narrow chromosome 1 region associated with chicken growth traits. Plos One 7: e30910.
8. Ain Baziz H, Geraert PA, Padilha JC, Guillaumin S (1996) Chronic heat exposure enhances fat deposition and modifies muscle and fat partition in broiler carcasses. Poult Sci 75: 505–513.
9. Zhao GP, Chen JL, Zheng MQ, Wen J, Zhang Y (2007) Correlated responses to selection for increased intramuscular fat in a Chinese quality chicken line. Poultry Science 86: 2309–2314.
10. Li WJ, Zhao GP, Chen JL, Zheng MQ, Wen J (2009) Influence of dietary vitamin E supplementation on meat quality traits and gene expression related to lipid metabolism in the Beijing-you chicken. Br Poult Sci 50: 188–198. 11. Cui HX, Zheng MQ, Liu RR, Zhao GP, Chen JL, et al. (2012) Liver dominant
expression of fatty acid synthase (FAS) gene in two chicken breeds during intramuscular-fat development. Mol Biol Rep 39: 3479–3484.
12. Zhang ZW, Ersoz E, Lai CQ, Todhunter RJ, Tiwari HK, et al. (2010) Mixed linear model approach adapted for genome-wide association studies. Nature Genetics 42: 355-U118.
13. Purcell S, Neale B, Todd-Brown K, Thomas L, Ferreira MAR, et al. (2007) PLINK: A tool set for whole-genome association and population-based linkage analyses. American Journal of Human Genetics 81: 559–575.
14. Bradbury PJ, Zhang Z, Kroon DE, Casstevens TM, Ramdoss Y, et al. (2007) TASSEL: software for association mapping of complex traits in diverse samples. Bioinformatics 23: 2633–2635.
15. Gu X, Feng C, Ma L, Song C, Wang Y, et al. (2011) Genome-Wide Association Study of Body Weight in Chicken F2 Resource Population. PLoS ONE 6(7): e21872.
16. Zheng P. (1988) Breeds of Domesticated Animal and Poultry in China. Shanghai Scientific and Technical Publishers, Shanghai, China.
17. Zhao GP, Cui HX, Liu RR, Zheng MQ, Chen JL, et al. (2011) Comparison of breast muscle meat quality in 2 broiler breeds. Poultry Science 90: 2355–2359. 18. Zhao GP, Chen JL, Zheng MQ, Wen J, Zhang Y (2007) Correlated responses to selection for increased intramuscular fat in a Chinese quality chicken Line(1). Poultry Science 86: 2309–2314.
19. Huang XH, Wei XH, Sang T, Zhao QA, Feng Q, et al. (2010) Genome-wide association studies of 14 agronomic traits in rice landraces. Nature Genetics 42: 961–976.
20. Watkins M, Grimston SK, Norris JY, Guillotin B, Shaw A, et al. (2011) Osteoblast connexin43 modulates skeletal architecture by regulating both arms of bone remodeling. Molecular Biology of the Cell 22: 1240–1251.
21. Stains JP, Civitelli R (2005) Gap junctions in skeletal development and function. Biochimica Et Biophysica Acta-Biomembranes 1719: 69–81.
22. Ankra-Badu GA, Le Bihan-Duval E, Mignon-Grasteau S, Pitel F, Beaumont C, et al. (2010) Mapping QTL for growth and shank traits in chickens divergently selected for high or low body weight. Animal Genetics 41: 400–405. 23. Ambo M, Moura ASAMT, Ledur MC, Pinto LFB, Baron EE, et al. (2009)
Quantitative trait loci for performance traits in a broiler x layer cross. Animal Genetics 40: 200–208.
24. Sovio U, Bennett AJ, Millwood IY, Molitor J, O’Reilly PF, et al. (2009) Genetic Determinants of Height Growth Assessed Longitudinally from Infancy to Adulthood in the Northern Finland Birth Cohort 1966. Plos Genetics 5 (3): e1000409.
25. Carty CL, Johnson NA, Hutter CM, Reiner AP, Peters U, et al. (2012) Genome-wide association study of body height in African Americans: the Women’s Health Initiative SNP Health Association Resource (SHARe). Human Molecular Genetics 21: 711–720.
Figure 2. The relative mRNA expression of gap junction protein, alpha 1 gene (a) was consistent with that of the breast muscle weight (b) across development. The mRNA expression is shown as the number of copies (6105) per mg total
RNA; Data are means (n = 6).
26. Soranzo N, Rivadeneira F, Chinappen-Horsley U, Malkina I, Richards JB, et al. (2009) Meta-Analysis of Genome-Wide Scans for Human Adult Stature Identifies Novel Loci and Associations with Measures of Skeletal Frame Size. Plos Genetics 5(4): e1000445.
27. N’Diaye A, Chen GK, Palmer CD, Ge B, Tayo B, et al. (2011) Identification, Replication, and Fine-Mapping of Loci Associated with Adult Height in Individuals of African Ancestry. Plos Genetics 7. (10): e1002298.
28. Lindholm-Perry AK, Sexten AK, Kuehn LA, Smith TPL, King DA, et al. (2011) Association, effects and validation of polymorphisms within the NCAPG-LCORL locus located on BTA6 with feed intake, gain, meat and carcass traits in beef cattle. BMC Genetics 12: 103.
29. Howell GR, Shindo M, Murray S, Gridley T, Wilson LA, et al. (2007) Mutation of a ubiquitously expressed mouse transmembrane Protein (Tapt1) causes specific skeletal homeotic transformations. Genetics 175: 699–707.
30. Zheng X, Ju ZH, Wang J, Li QL, Huang JM, et al. (2011) Single nucleotide polymorphisms, haplotypes and combined genotypes of LAP3 gene in bovine and their association with milk production traits. Molecular Biology Reports 38: 4053–4061.
31. Nones K, Ledur MC, Ruy DC, Baron EE, Melo CMR, et al. (2006) Mapping QTLs on chicken chromosome 1 for performance and carcass traits in a broiler x layer cross. Animal Genetics 37: 95–100.
32. Horner A, Shum L, Ayres JA, Nonaka K, Nuckolls GH (2002) Fibroblast growth factor signaling regulates Dach1 expression during skeletal development. Developmental Dynamics 225: 35–45.
33. De Koning DJ, Haley CS, Windsor D, Hocking PM, Griffin H, et al. (2004) Segregation of QTL for production traits in commercial meat-type chickens. Genetical Research 83: 211–220.
34. Uemoto Y, Sato S, Odawara S, Nokata H, Oyamada Y, et al. (2009) Genetic mapping of quantitative trait loci affecting growth and carcass traits in F2 intercross chickens. Poult Sci 88: 477–482.
35. Dallabrida SM, Ismail N, Oberle JR, Himes BE, Rupnick MA (2005) Angiopoietin-1 promotes cardiac and skeletal myocyte survival through integrins. Circulation Research 96: e8–24.
36. Brindle NPJ, Saharinen P, Alitalo K (2006) Signaling and functions of angiopoietin-1 in vascular protection. Circulation Research 98: 1014–1023. 37. Morello LG, Coltri PP, Quaresma AJC, Simabuco FM, Silva TCL, et al. (2011)
The Human Nucleolar Protein FTSJ3 Associates with NIP7 and Functions in Pre-rRNA Processing. PLoS ONE 6(12): e29174.
38. Li L, Gronning LM, Anderson PO, Li SL, Edvardsen K, et al. (2004) Insulin induces SOCS-6 expression and its binding to the p85 monomer of phosphoinositide 3-kinase, resulting in improvement in glucose metabolism. Journal of Biological Chemistry 279: 34107–34114.
39. Chandra R, Liddle RA (2007) Cholecystokinin. Curr Opin Endocrinol Diabetes Obes14: 63–67.
40. Tai K, Kubota M, Shiono K, Tokutsu H, Suzuki ST (2010) Adhesion properties and retinofugal expression of chicken protocadherin-19. Brain Research 1344: 13–24.