The Regulation of miRNA-211 Expression and Its Role in
Melanoma Cell Invasiveness
Joseph Mazar1, Katherine DeYoung2, Divya Khaitan1, Edward Meister2, Alvin Almodovar1, James Goydos3, Animesh Ray4, Ranjan J. Perera1,2*
1Sanford Burnham Medical Research Institute, Orlando, Florida, United States of America,2Curtis and Elizabeth Anderson Cancer Institute, Savannah, Georgia, United States of America,3Robert Wood Johnson Medical School, Cancer Institute of New Jersey, New Brunswick, New Jersey, United States of America,4Keck Graduate Institute, Claremont, California, United States of America
Abstract
The immediate molecular mechanisms behind invasive melanoma are poorly understood. Recent studies implicate microRNAs (miRNAs) as important agents in melanoma and other cancers. To investigate the role of miRNAs in melanoma, we subjected human melanoma cell lines to miRNA expression profiling, and report a range of variations in several miRNAs. Specifically, compared with expression levels in melanocytes, levels of miR-211 were consistently reduced in all eight non-pigmented melanoma cell lines we examined; they were also reduced in 21 out of 30 distinct melanoma samples from patients, classified as primaryin situ, regional metastatic, distant metastatic, and nodal metastatic. The levels of several predicted target mRNAs of miR-211 were reduced in melanoma cell lines that ectopically expressed miR-211.In vivotarget cleavage assays confirmed one such target mRNA encoded byKCNMA1. Mutating the miR-211 binding site seed sequences at the KCNMA1 39-UTR abolished target cleavage. KCNMA1 mRNA and protein expression levels varied inversely with miR-211 levels. Two different melanoma cell lines ectopically expressing miR-miR-211 exhibited significant growth inhibition and reduced invasiveness compared with the respective parental melanoma cell lines. An shRNA against KCNMA1 mRNA also demonstrated similar effects on melanoma cells. miR-211 is encoded within the sixth intron of TRPM1, a candidate suppressor of melanoma metastasis. The transcription factor MITF, important for melanocyte development and function, is needed for highTRPM1 expression. MITF is also needed for miR-211 expression, suggesting that the tumor-suppressor activities of MITF and/or TRPM1 may at least partially be due to miR-211’s negative post transcriptional effects on the KCNMA1 transcript. Given previous reports of high KCNMA1 levels in metastasizing melanoma, prostate cancer and glioma, our findings that miR-211 is a direct posttranscriptional regulator of KCNMA1 expression as well as the dependence of this miRNA’s expression on MITF activity, establishes miR-211 as an important regulatory agent in human melanoma.
Citation:Mazar J, DeYoung K, Khaitan D, Meister E, Almodovar A, et al. (2010) The Regulation of miRNA-211 Expression and Its Role in Melanoma Cell Invasiveness. PLoS ONE 5(11): e13779. doi:10.1371/journal.pone.0013779
Editor:Venugopalan Cheriyath, Cleveland Clinic, United States of America
ReceivedMay 10, 2010;AcceptedOctober 8, 2010;PublishedNovember 1, 2010
Copyright:ß2010 Mazar et al. This is an open-access article distributed under the terms of the Creative Commons Attribution License, which permits unrestricted use, distribution, and reproduction in any medium, provided the original author and source are credited.
Funding:This work was supported by grants from the National Institutes of Health (1R01GM084881-01) and the National Science Foundation (FIBR 0527023) to AR, and the Anderson Cancer Institute support for RP’s research program. The funders had no role in study design, data collection and analysis, decision to publish, or preparation of the manuscript.
Competing Interests:The authors have declared that no competing interests exist. * E-mail: [email protected]
Introduction
Melanoma, a cancer of the pigment-producing cells in the skin epidermis, can be highly metastatic, and malignant melanomas are relatively resistant to standard chemotherapy [1]. A major cause for melanoma initiation is extensive or intermittent exposure to the sun’s radiation over a period of time, and the extent of melanin pigmentation is an important risk factor [2]. The exact molecular mechanisms that lead to melanoma are complex and poorly understood [3–6], and may involve both mutagenic DNA lesions and epigenetic misregulation [7–11]. The complexity is added by the involvement of several different signal transduction pathways, such as theHedgehogpathway, which controls BCL2-mediated apoptosis; mutations in thePatchedgene, the endpoint of theHedgehogpathway, have been correlated with skin cancers [3,12–15]. A frequent causative mechanism for an inherited form of predisposition to melanoma is thought to be a chromosomal deletion over 9p21. The 9p21 site harbors the tumor suppressor gene INK4a and accompanies additional inactivating mutations that lead to the
constitutive activation of genes such as BRAF [16,17]. INK4a encodes one of several cyclin-dependent protein kinase inhibitors, which is located adjacent to an alternate reading frame of the human p14ARF. P14ARFbinds to the Mdm2 protein in several cell lines (though remains untested in melanoma cell lines, to our knowledge) and thereby abrogates Mdm2’s binding to p53, causing p53 to be stabilized and nuclear localized. The loss of INK4a therefore may lead to interference of two separate pathways of cell cycle control: CDK signaling and suppression of p53 activity by Mdm2-induced acceleration of p53 degradation. Methylation near the 59upstream region of INK4a has been shown in some 10% of melanomas [7], suggesting that epigenetic down-regulation of this gene may be important for melanoma development. The activation of BRAF
together with analysis of somatic mutations in specific marker genes, can be used to distinguish among different melanoma subtypes with reasonable accuracy [21]. Particularly noteworthy is the recent demonstration of abnormally high oncogenic potentials of single melanoma cells [22], emphasizing the need for better understanding the molecular mechanisms of melanoma progression.
Attention has recently focused on the role of small non-coding RNA molecules in cancer development [23–27] and in melanoma in particular [28–32]. miRNAs influence cancer development by serving either as tumor suppressors or oncogenes [33–39] by their negative regulatory effects on mRNA encoded by oncogenes or tumor suppressor genes, respectively. With the goal of defining the genes with major contributions to melanoma, several genome-wide expression level studies have identified a number of protein-coding [40] and microRNA (miRNA) genes as important players [32,41–43]. Several of these genes and their expression signatures exhibit distinct patterns among malignant metastatic melanomas and their benign forms, but their significance with respect to melanoma initiation and progression is poorly understood. For example, miR-221/222 were found to down-regulate p27Kip1/ CDKN1B and the c-KIT receptor, which controls the progression of neoplasia leading to enhanced proliferation and reduced differentiation in melanoma cells [42]. Similarly, high miR-137 expression in melanoma cell lines down-regulates microphthalma associated transcription factor (MITF), a transcription factor important for melanocyte cell growth, maturation, apoptosis, and pigmentation [32]. The depletion of miR-182 reduces invasiveness and induces melanoma cell death by suppressing the expression of transcription factors FOXO3 and MITF [43], suggesting that its increased expression may be associated with certain aspects of melanoma biology. Relatively less is known about the downstream genes that are regulated by MITF and FOXO3, which are evidently important for melanoma progres-sion and metastasis.
In contrast to miRNAs that are over-expressed in melanoma, and their respective target genes that are thus under-expressed, relatively little is known about miRNA species that are systematically depleted in melanomas. Consequently, their respec-tive target genes, expected to be up-regulated, which might explain some of the oncogenic potentials of invasive melanomas, are largely unrecognized. Realizing this gap in knowledge, we examined the expression levels of human miRNAs in defined melanoma cell lines and clinical melanoma samples. We report here the reduced expression of miR-211 in these cell lines and clinical isolates of human melanomas, and present evidence that a principal effect of the reduced expression of miR-211 is the increased expression of its target transcript KCNMA1. The expression of KCNMA1, encoding a calcium ion-regulated potassium channel protein, appears to at least partially account for the high cell proliferation rate and invasiveness of melanoma cell lines. We also demonstrate that MITF expression is important for the coordinate expression ofmiR-211, and TRPM1. TRPM1
gene is a suppressor of melanoma metastasis, which encodes a transient receptor potential family member calcium channel protein, and encodes miR-211gene in its sixth intron. Here, we propose a model for the role of miR-211 and its regulation in melanoma cells.
Results
miR-211 is expressed at a low level in non-pigmented melanoma cell lines
As the first step in identifying down-regulated miRNAs in human melanoma, we identified significantly differentially
ex-pressed miRNA species in the melanoma cell line WM1552C (originally established from a stage 3 skin melanoma of a 72-year-old patient) compared to those in the normal melanocyte cell line HEM-l by hybridization of total RNA samples to miRNA probe arrays (see Methods). Figure 1 lists 24 statistically significant differentially expressed miRNAs, classified into three groups according to their significance levels (P,0.01, 0.02, and 0.05, respectively). To address whether the differential miRNA expression levels observed with WM1552C varied among other established melanoma cell lines, we performed quantitative reverse transcriptase mediated polymerase chain reaction (qRT-PCR) analysis on RNA isolated from WM1552C and seven additional non-pigmented melanoma cell lines (see Methods) (Figure 2A), addressing the expression levels of three separate microRNAs: miR-let7a, miR-let7g, which were over-expressed, and miR-211 was down-regulated. Northern blot analysis further confirmed these results (Figure 2B). This consistency provided the opportu-nity to address the significance of the reduced level of miR-211 in melanoma. In the following sections we focus on miR-211 and its target genes as a model of the role of miRNAs that are down-regulated in melanoma, with the aim of determining the role of their target genes that are thus up-regulated in melanoma. miR-211 showed the most robust and consistent changes in expression levels between melanocytes and non-pigmented melanoma cell lines. Results reported in Figures 1 and 2 implicate several additional miRNAs in melanoma; specific studies related to these miRNAs are beyond the scope of this communication, and will be reported elsewhere.
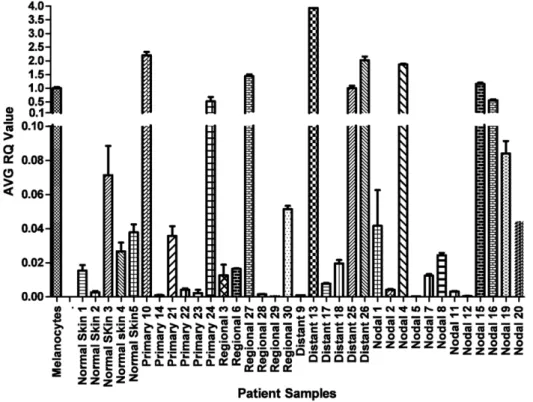
miR-211 levels in clinical melanoma samples
and in five independent isolates of normal skin samples. Results show that miR-211 is elevated in both melanocyte cell lines compared to normal human skin (Figure S1). miR-211 expression levels in pooled samples of nevi also agree with previously published results, supporting the observation that miR-211 is highly expressed in nevi compared to melanoma [44]. These observations are consistent with the understanding that nevi are composed of melanocytes. Together, these results suggest that the development of most melanomas is specifically associated with the depletion of miR-211 transcript levels. An alternative formal interpretation, which is unlikely considering the absence of supporting literature, is that the low miR-211 level in melanoma reflects a cellular origin of melanoma which is distinct from that of melanocytes.
Stable ectopic expression of miR-211 in melanoma cell lines depletes select target transcripts
Differential expression of miRNAs in melanoma may be mechanistically related to melanoma development, or it may be coincidental. If indeed the depleted miRNAs are biologically relevant, melanoma cells should be enriched for their target transcripts levels relative to their corresponding levels in melanocytes. As the first step to identify such mRNA transcripts, we hybridized cDNAs made from total RNA isolated from the melanoma cell line WM1552C and the melanocyte line HEM-l to Affymetrix expression arrays. We then filtered the hybridization intensity data for differential expression of computationally predicted target transcripts of miR-211 (Figure 4) (see Methods). These experiments revealed 26 putative target transcripts whose expression levels were elevated relative to those in HEM-l.
If the set of 26 genes indeed contains valid targets of miR-211, their levels should be depleted if miR-211 levels were to increase in
any melanoma cell line. To directly examine this possibility, we constructed three independent melanoma cell lines that stably express miR-211. For that purpose, we transfected the pre-miR-211 sequence (plasmid pcDNA4/miR-pre-miR-211) into WM1552C and A375 cells, followed by selection for stable expression of miR-211 and confirmation of expression by qRT-PCR analysis (see Methods). The melanoma cell line clones that ectopically expressed miR-211 were named: WM1552C/211(400), WM1552C/211(800) and A375/211 (see Methods for details). We measured global mRNA levels in WM1552C/211(400) and A375/211 cells on Affymetrix arrays and compared these levels with the corresponding levels measured in the same experiment in untransfected parental cell lines WM1552C and A375, respec-tively. This analysis revealed a list of 18 putative target transcripts for miR-211, which were down-regulated by the artificial expression of miR-211 in both melanoma cell lines (Figure 5). When cross-referenced with results reported in Figure 4, nine of these putative target transcripts were found to be up-regulated in both melanoma cell lines compared to those in melanocytes and down-regulated in both melanoma cell lines when miR-211 was stably expressed. These candidate targets of miR-211 are:
ATP2B1, CDH2, GLIS3, KCNMA1, MEIS2, NCAM-1, NF-AT5, PRPF38B, andTCF12. Of these, the following seven genes were previously implicated in cancer progression:ATP2B [45],CDH2
[19,46,47], GLIS3 [48], KCNMA1 [49–51], MEIS2 [52,53],
NCAM-1 [[54], and NF-AT5 [55]. Moreover, CDH2, KCNMA1, NCAM-1, andNF-AT5were previously shown to affect metastatic migration and/or tissue invasion [19,46,47,51,54]. In particular the expression ofKCNMA1, which encodes a component of a K+ exporting channel whose function is modulated by Ca++
, has been linked to tumor cell proliferation in prostate cancer [49], cell migration in glioma [56] and antineoplastic drug resistance in
Figure 1. Differentially expressed miRNA transcripts in the melanoma cell line WM1552C.Histograms of log2of mean expression ratios of
miRNA levels in WM1552C to that in the untransformed melanocyte cell line HEM-l (control) are plotted as histograms. Asterisks indicate the respective levels of statistical significance, indicated below the diagram.
doi:10.1371/journal.pone.0013779.g001
melanoma cells [57]. The 39-UTR of the KCNMA1 transcript also contains one of the strongest predicted target sites of miR-211. Therefore we focused on this transcript for investigation.
KCNMA1 protein and transcript levels correlate inversely with that of miR-211
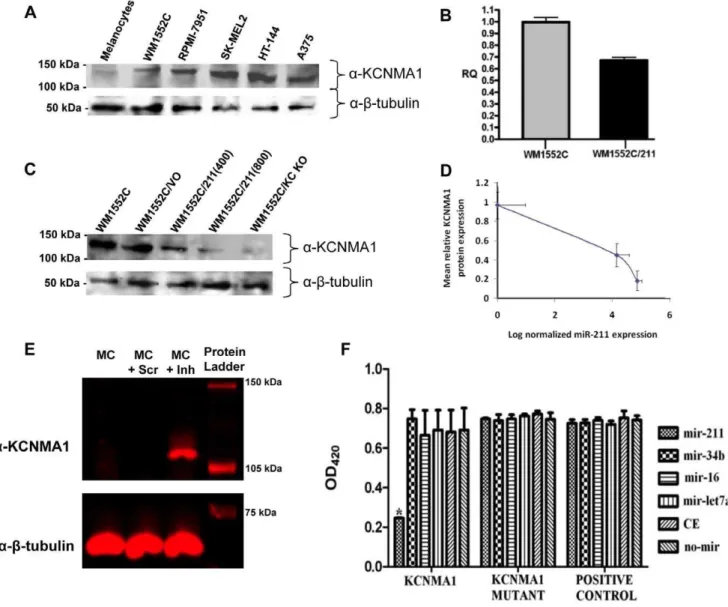
If miR-211 targets theKCNMA1transcript, KCNMA1 protein expression levels should inversely correlate with that of miR-211 expression levels. A western blot analysis of KCNMA1 expression was performed, utilizing the same cell lines previously examined by northern blot (Figure 2B) for KCNMA1 transcript expression. KCNMA1 protein expression was very low in normal melano-cytes, but high in all melanoma cell lines (Figure 6A), indicating an inverse correlation of expression between KCNMA1 protein and miR-211.
We next investigated whether the induced expression of miR-211 in melanoma cells can reduce KCNMA1 transcript levels. qRT-PCR analyses comparingKCNMA1expression in wild type WM1552C with that in WM1552C/211(400) revealed that the introduction of miR-211 down-regulates theKCNMA1transcript (Figure 6B). To further address whether KCNMA1mRNA levels reflected KCNMA1 protein expression, we performed a western blot analysis looking for KCNMA1 in cell extracts obtained from: 1) WM1552C, 2) WM1552C/VO (WM1552C cells with a stably-incorporated empty expression vector), 3) WM1552C/211(400), 4) WM1552C/211(800), and 5) WM1552C/KC KO (WM1552C
cells with a stably-expressing shRNA against theKCNMA1mRNA) (Figure 6C). As expected, KCNMA1 protein levels were significantly reduced in both melanoma cell lines expressing miR-211 [even more so in WM1552C/211(800)] compared to those in WM1552C/VO or untransfected WM1552C cells. KCNMA1 was virtually undetectable in the WM1552C/KC KO cell line. These results are consistent with the idea that miR-211 is able to target theKCNMA1mRNA, thereby decreasing the amount of KCNMA1 protein in the cell. miR-211 expression was measured in engineered melanoma cell lines by qRT-PCR, and it did not exceed the levels observed in, melanocytes (Figure S2). To further confirm our observations, we measured the correlation between miR-211 expression and KCNMA1 protein levels (Figure 6D). The results revealed an inverted correlation between miR-211 expression and KCNMA1 protein levels. To confirm that this expression correlation occurred in non-transformed cells in addition to cancerous cell lines, we examined the effect of miR-211 inhibition on the expression of KCNMA1 in melanocytes. Melanocytes were transfected with anti-miR-211 inhibitors (Exiqon) and the protein expression of KCNMA1 was measured. The results indicated that derepression of KCNMA1 protein expression could be achieved by inhibition of miR-211 (Figure 6E).
miR-211 directly targets the KCNMA1 transcript
To determine whether the computationally predicted target site of miR-211 in the 39-UTR of the KCNMA1 transcript confers
Figure 2. miR-211 is uniformly under-expressed in all melanoma cell lines.A) Levels of three individual miRNAs, as measured by qRT-PCR in eight different melanoma cell lines relative to their respective levels in the melanocyte cell line HEM-l, are plotted as histograms. RQ = relative quantification index. B) Northern blot analysis of miR-211 and miR-let-7g in five melanoma cell lines and melanocytes. miR-let-7g is consistently over-expressed in melanoma cells. miR-211 is over-expressed at high level in melanocytes but is not detectable in any of the melanoma cell lines. Error bars are standard errors of mean of six independent measurements.
doi:10.1371/journal.pone.0013779.g002
sensitivity to miR-211, we performed a target cleavage assay with a construct containing the 39-UTR of KCNMA1 cDNA fused downstream of the reporter geneb-galactosidase. The construct, pcDNA6/LacZ/KCNMA1, as well as a derivative, pcDNA6/ LacZ/KCNMA1-MUT (containing a mutated target cleavage site at the seed sequence; see Figure S3), and the control vector pcDNA6/LacZ, were separately transfected into A375 cells along with one of the following miRNA mimics: miR-211, miR-16-1, miR-34b, miR-let-7a-1, cel-miR-67, or no mimic (Figure 6E). The results revealed a statistically significant drop of nearly 60% inb -galactosidase activity when the cells were transfected with pcDNA6/LacZ/KCNMA1 together with miR-211 mimics, but not with any other combination. Importantly, this drop was not detectable in cells co-transfected with pcDNA6/LacZ/KCNMA1-MUT and the miR-211 mimic, demonstrating that miR-211 was capable of specifically targeting the wild type seed sequence in the 39-UTR of theKCNMA1transcript.
MITF co-ordinately regulatesmiR-211andTRPM1
The gene encoding miR-211 is located within the sixth intron of the TRPM1 gene, which encodes multiple polypeptide isoforms including melastatin-1, a transient receptor potential (TRP) protein family member thought to be a potential suppressor of melanoma metastasis [58]. However, the molecular basis of the tumor suppressor activity ofTRPM1gene is not understood. The transcription factor MITF regulates the expression of TRPM1
gene, where the MITF-binding motif (GCTCACATGT) is located in the TRPM1 promoter [58]. This prompted us to examine whether MITF also might transcriptionally regulate miR-211 expression via theTRPM1promoter. We found that both TRPM1
and miR-211 transcripts are expressed in pigmented but not in the non-pigmented melanoma cells. To determine whether MITF expression modulates miR-211 expression, we knocked down MITF expression by siRNA in the pigmented melanoma cell line SK-MEL28. Three different doses of siRNA (5 nM, 10 nM and 15 nM) were used, and the knock-down efficiency was measured by qRT-PCR. As expected, the extent of reduction in MITF transcript levels directly correlated with the reduction in TRPM1 and miR-211 transcript levels (Figure 7). In conclusion, the results are consistent with the hypothesis that MITF co-ordinately regulates TRPM1 and miR-211 expression. If true, it raises the possibility that one of the ways MITF might also suppress melanoma metastasis is through its transcriptional activation of miR-211 via theTRPM1promoter, and the consequent negative post-transcriptional effects of miR-211 on KCNMA1 mRNA.
The effect of miR-211 on cell proliferation and invasion
Since the over-expression ofKCNMA1is often associated with both cell proliferation and cell migration/invasion in various cancers [49–51], we decided to determine whether the depletion of miR-211 and associated over-expression of KCNMA1 were important for these processes in melanoma cells. We began by comparing the proliferation rates of melanoma cell lines stably transfected with the miR-211 expression cassette with those of untransfected melanoma cells and cell lines transfected with the empty expression vector (Figure 8A) (see Methods), respectively. All miR-211-expressing cultures of WM1552C/211 showed reduced cell counts compared to those of WM1552C beginning at even the first time point (day 4), and the titre continued to fall behind as time progressed. After a 21-day period, WM1552C/
Figure 3. miR-211 expression in clinical melanoma samples.Histograms show normalized ratios of miR-211 levels in clinical samples relative to its level in the melanocyte cell line HEM-l (normalized to 1.0), as determined by real time quantitative RT-PCR analysis. Normal skin shows low levels of miR-211 because melanocytes constitute a small fraction of normal skin cells (see text). By two-tailed t-test, the mean RQ of miR-211 in the four groups (primary melanoma, regional, distant, and nodal metastatic melanoma) compared to the mean RQ of miR-211 in HEM-l were all statistically significant at P,1026. MC = Melanocytes, NS = Normal Skin, PM = Primary Melanoma, RM = Regional Metastases, DM = Distant Metastases, and NM = Nodal Metastases.
doi:10.1371/journal.pone.0013779.g003
211(400) had greater than 30% decrease in cell counts compared to those of WM1552C, while WM1552C/211(800) cultures showed an even greater decrease in cell proliferation. WM1552C/VO cells showed no significant difference in cell proliferation compared to WM1552C. Comparable results were obtained for cell proliferation of A375/211 cell lines, which grew more slowly than untransfected A375 or A375/VO (Figure 8B). These results are consistent with the hypothesis that an important growth stimulatory event in the melanoma cell lines WM1552C and A375 involves the depletion of miR-211 levels—the latter possibly leading to the targeted up-regulation of at leastKCNMA1
expression among its target genes.
Next, we examined the impact of miR-211 expression on the invasive properties of WM1552C. WM1552C/211(400) and WM1552C/211(800) cells, along with WM1552C/VO, WM1552C/KC KO, and untransfected WM1552C cells were seeded separately into invasion chambers, and the cells were allowed to migrate (see Methods). Results indicated that WM1552C/211(400) and WM1552C/211(800) cells migrated significantly less (,40% and 60% less, respectively) than
WM1552C (Figures 8C and 8D), whereas WM1552C/VO cells showed almost no variation compared to parental cells. The frequency of cells with invasion defects significantly exceeded the decrease in the proliferation rates of these cells (an ,8–10%
decrease in growth over the 48 hours of the invasion assay period), suggesting that the two effects on miR-211 expression are independent of each other. The most significant effect on invasion was observed in the WM1552C/KC KO cells. While a sequence-scrambled oligonucleotide (miR-Scramble) did not show an effect on cell invasion, cells treated with a miR-211 inhibitor restored the
invasion phenotype by as much as 40% (Figure 8D). Given that previously published evidence directly linksKCNMA1gene dosage and/or expression with increased motility/invasion in several cancers [49–51], these results suggest that at least part of the invasion defect caused by miR-211 in melanoma cell lines is due to targeted down-regulation of the KCNMA1 transcript. To fully demonstrate that KCNMA1 is a key contributor to miR-211 effects, we examined whether concomitant over-expression of KCNMA1 might also rescue the miR-211 anti-invasive effects. A KCNMA1 constitutively-expressing plasmid was transiently trans-fected into WM1552C/211(800) cells. This plasmid (Origene clone NM_002247.2) contains a KCNMA1 ORF without its native 39UTR (making it resistant to regulation by miR-211). KCNMA1 protein expression levels were then detected by KCNMA1 antibody. Western blot results revealed that KCNMA1 protein levels were elevated in transfected cells [‘‘WM1552C/ 211(800)+KCNMA1 vector’’ relative to control cells] (Figure 8E, bottom). Results from an invasion assay (Figure 8E, top) illustrate that the same batch of melanoma cells that exhibit high KCNMA1 protein expression [WM1552C/211(800) + KCNMA1 vector’’ cells] also show high cell invasiveness, higher by at least 60% compared to the control cell cultures.
Discussion
Current understanding of the molecular mechanisms of carcinogenesis is beginning to include not only the role of protein coding genes but also that of non-coding regulatory RNA, especially miRNAs. In the case of melanoma, our discovery of miRNAs whose expression levels are reduced in melanoma cells
Figure 4. Expression of predicted target genes of miR-211 in WM1552C.Histograms of log2transformed mean expression ratios (fold
change) of mRNAs in WM1552C to those in the melanocyte line HEM-l are plotted. The computationally predicted target genes were selected according to criteria described in Methods. Only genes with statistically significant fold change in expression were plotted.
doi:10.1371/journal.pone.0013779.g004
can potentially lead to the identification of genes that are responsible for oncogenesis and invasiveness. Along that line, we report here that miR-211 levels are consistently reduced in melanoma cells compared to its levels in melanocytes, and that the expression levels of several potential miR-211 target mRNAs are elevated in melanoma cells. We demonstrate that the increased expression of one particular confirmed target transcript, KCNMA1, is associated with high invasiveness and proliferation in melanoma cellsin vitro.
The simplest model we offer is that the down-regulation of miR-211 causes elevated levels of KCNMA1 protein in melanoma cells, which at least in part explains the invasiveness of malignant melanoma. More complex models are possible, such as yet unidentified targets of miR-211 (besides KCNMA1) that may have a positive feedback effect on KCNMA1 levels and are responsible for invasiveness. Another alternative possibility is that miR-211 down-regulation in melanoma causes other transformational events unrelated to KCNMA1, leading to higher oncogenesis and invasiveness. Both of these more complex possibilities are consistent with some of our results, but not with the full set of results presented here. While the assays of cell invasion reported here are widely used for demonstrating metastatic potential [59,60], and the results appear convincing, furtherin situstudies with immunodeficient mice
are needed to confirm the role of KCNMA1 in melanoma invasiveness in vivo. We observed that melanoma cell lines engineered to express high levels of miR-211 begin to lose expression shortly after removal from selection, indicating a strong bias against miR-211 expression during the growth of melanoma cell lines and suggests that the rapid proliferation of melanoma cells in culture is directly related to low miR-211 activity in these cells. Future experiments will explore whether the progressive reduction in miR-211 levels observed in these engineered cells is due to genetic or epigenetic changes.
TheTRPM1gene, which containsmiR-211sequences in the sixth intron, was previously suggested to be a suppressor of melanoma aggressiveness [61,62]. We showed here that the transcription factor MITF, which regulates the expression ofTRPM1, is also needed for high-level expression ofmiR-211. Thus, the regulation by MITF of bothTRPM1andmiR-211genes can be speculated to have similar effects on melanoma invasiveness separately through their respec-tive gene products: the former a Ca++
channel protein (TRPM1), and the latter a miRNA targeted against the Ca++
regulated K+ channel protein KCNMA1. If true, the invasiveness of melanoma cells could partly be the result of the breakdown of processes related to calcium-regulated ion homeostasis. The recent finding that salinomycin, an inhibitor of K+
transport, is a selective inhibitor of
Figure 5. Effects of miR-211 over-expression on KCNMA1 gene expression.WM1552C and A375 melanoma cell lines were transfected with expression cassettes containing thepre-miR-211sequences, and stable transfectants were selected (see Methods). Expression levels of miR-211 target genes in HEM-l, A375, WM1552C, A375/211 and WM1552C/211 were measured by hybridization of cDNA (made from total RNA) to Affymetrix microarrrays. Histograms represent the log2ratios of expression in different cell lines as indicated in the figure. MC = HEM-l.
doi:10.1371/journal.pone.0013779.g005
cancer stem cell proliferation is consistent with our findings on the role of KCNMA1 in melanoma cells [63]. We cannot eliminate the formal possibility that the potential tumor suppressor activity of
TRPM1gene is, at least in part, due to the co-expression of miR-211
encoded from within its sixth intron. In Figure 9 we summarize our results, in light of previous studies, as a simple model of the mechanism of development of invasive melanoma, which highlights the role of miR-211.
Figure 6. KCNMA1 mRNA is a direct target of miR-211.A) Western blot analysis of KCNMA1 protein expression in melanocytes and melanoma cell lines. Lysates were prepared from cultures of cells complementing those analyzed by northern blot in Figure 2B, including HEM-l, WM1552C, RPMI-7951, SK-MEL2, HT-144, and A375 and probed by Western blotting with antibodies against KCNMA1 orb-tubulin. B) Relative expression of
KCNMA1mRNA in WM1552C compared to WM1552C expressing miR-211 [WM1552C/211(400)]. Histograms represent relative quantification ratio (RQ) as measured by qRT-PCR analysis. Assays were performed in triplicate. C) Western blot analysis of KCNMA1 protein expression in WM1552C stable cell lines. Lysates were prepared from cultures of untransfected WM1552C and WM1552C stably transfected with expression vectors containing: no miR (WM1552C/VO), miR-211 [both WM1552C/211(400) and WM1552C/211(800)], and an shRNA against the KCNMA1 transcript (WM1552C/KC KO), respectively, and probed by Western blotting with antibodies against KCNMA1 orb-tubulin. D) Inverse correlation between miR-211 expression and KCNMA1 protein levels. miR-miR-211 mean RQ was measured by quantitative RT-PCR in three different strains: WM1552C/VO (normalization standard), WM1552C/211(400), and WM1552C/211(800); KCNMA1 protein levels were measured from relative fluorescence in western blots normalized against fluorescence intensity in WM1552C/VO andb-tubulin load controls. Error bars are standard errors of mean for mean RQ, and standard deviations of relative fluorescence intensity. E) Anti-miR-211 inhibitor reverses KCNMA1 protein levels in melanocytes. Melanocytes were transfected with anti-miR-211 inhibitors, andKCNMA1protein expression was measured in transfected cells by western blot analysis using a KCNMA1 antibody (b-tubulin was used as a load control). Derepression of KCNMA1 protein in the transfected cells is shown in the lane marked as MC+Inh. MC and MC+Scr are melanocyte controls. F) Inhibitory effect of miR-211 on mRNA containing the KCNMA1 39-UTR sequences. An expression plasmid
containing the KCNMA1 39-UTR seed sequence for miR-211 was fused to a lacZ reporter gene (labelled, KCNMA1) such that the lacZ mRNA would contain the KCNMA1 39-UTR sequences (harbouring the miR-211 target site) and was co-transfected into the melanoma cell line A375 with one of the following synthetic miRNAs: miR-211, miR-16-1, miR-34b, miR-let-7a, miR-CE (cel-miR-67), and no miRNA. Histograms are measurements of b -galactosidase activity at OD420. To directly confirm the importance of the miR-211 seed sequence, a plasmid containing the LacZ gene was fused to a
mutant KCNMA1 39UTR seed sequence (labelled, KCNMA1 Mutant), and the expression vector itself without any 39-UTR fusion to LacZ (labelled, positive control) were also included. The assays were performed in triplicate. The only sample with statistically significant difference is indicated by an asterisk (Kruskal Wallis test,x2= 24.142,P
,0.001). doi:10.1371/journal.pone.0013779.g006
In contrast to our finding that miR-211 levels in most melanoma cells and clinical samples were down-regulated, Gaur
et al.[64] previously reported that miR-211 was over-expressed in 6 of 8 tested melanoma lines from the NCI-60 panel of cancer cells. However, a leave-one-out sensitivity analysis conducted by Gauret al. [64] failed to show a significant effect on the confidence interval when miR-211 expression level was omitted, suggesting low specificity or sensitivity with respect to miR-211 in those experiments. Mulleret al. [41] compared miRNA expression in melanoma cell lines with pooled normal human epidermal melanocytes; miR-211 was not down-regulated in their study. It is likely that the melanocyte cells (pooled epidermal melanocytes) these authors used were physiologically and genetically different from the melanocyte lines we used. Jukicet al., [44] reported that miR-211 was up-regulated in nevi and dramatically down-regulated in metastatic melanoma compared to nevi controls. These results are in agreement with our results and contradict the results published by Schultz, et al.,[31].
In conclusion, we have demonstrated that miR-211 is down-regulated in non-pigmented melanoma and its expression is regulated by the MITF gene. The down-regulation of miR-211 and the corresponding up-regulation of its target transcript KCNMA1 are therefore important molecular events for melano-ma development and/or progression.
Methods
Cell lines and clinical samples
The human epidermal melanocyte cell line HEM-l (Scien-CellTM, Catalog#2200) and primary epidermal melanoyctes – neonatal (ATCC - PCS-200-012) were grown in MelM media containing MelGS growth supplements, 0.5% FBS, and pen/strep solution. The melanoma cell lines examined included: A375 (stage 4, ATCCHNumber: CRL-1619), G361 (stage 4, ATCC), LOX-IMV1 (stage 4, ATCC), HT-144 (stage 4, ATCCHNumber: HTB-63), RPMI-7951 (stage 4, ATCCHNumber: HTB-66), SK-MEL2 (stage 4, ATCC), SK-MEL28 (stage 3, ATCC), WM793B (stage 1, ATCCHNumber: CRL-2806), and WM1552C (stage 3, ATCCH
Number: CRL-2808). All melanoma cell lines were grown in Complete Tu Media containing a 4:1 mixture of MCDB-153 medium with 1.5 g/L sodium bicarbonate and Leibovitz’s L-15 medium with 2 mM L-glutamine, 2% FBS, and 1.68 mM CaCl2. Information regarding all clinical samples, derived from frozen samples, is described in Table S1.
miRNA arrays
miRNA NCodeTMversion 2 array (Invitrogen) containing 553 human and 427 mouse miRNAs, and the TILDA array (ABI) were used for miRNA expression profiling. The miRNA samples were labelled with AlexaFluorHconjugated dendrimers using the direct labelling kit (Genisphere). We routinely evaluated hybridization conditions by discriminating between 2 nt variants at internal sites, and most probes can distinguish between 1 nt variants. The arrays were scanned with Axon B-4000 (Agilent).
Validation of miRNA array results
Expression levels of all statistically significant and differentially expressed mRNAs and miRNAs were confirmed by qRT-PCR using TaqManH expression kits (Applied Biosystems) [65] using multiple technical and biological replicates.GAPDHwas used as the internal reference probe for normalization of expression values of mRNA, andRNU48 was used for normalization of miRNA. RNA analysis by Northern blots used 20mg of total RNA concentrated from each sample (melanoma cell lines and melanocytes), separated on 15% urea denaturing polyacrylamide gels by electrophoresis. Gels were electroblotted to nylon membranes, cross-linked by UV, prehybridized in ULTRAhybH -Oligo (Ambion) for 30 minutes at 42uC, and hybridized with 59 -biotinylated anti-miRNA DNA oligonucleotides (100 nM each) at 42uC overnight, washed, and detected by chemiluminescence (BrightstarHdetection kit, Ambion). Anti-U6 probes were used as a reference control (at 10 pM).
Microarray data analyses and miRNA target prediction
For the initial transformation of miRNA array data, the GenePixPro 6.0 global normalization method was employed in which images and results are normalized together. Statistical significance tests were Welsh t-test, nonparametric ANOVA, (e.g., to select genes that have significantly less within sample variance compared to between sample variance), and correlation analysis with Pearson’s product momentrand Spearman’sr. Analysis was
controlled for false discovery rate using q-values, witha prioricut off point of 10 percent [66,67]. For mRNA expression array data, commencing with GeneChipH Human Exon 1.0 ST Array (Affymetrix, Inc.) four probes per exon and roughly 40 probes per gene, 7 total arrays were analysed (three arrays for melanocyte RNA, and four arrays for melanoma RNA). Cell files were loaded into PartekHGenomics SuiteTM(Partek, Inc. St. Louis, Missouri, USA) under the following algorithm constraints: interrogating probes selection, RMA background correction, adjusted for GC content, quintile normalization, log probes using base 2, with probe set summarization of median polish. Quality control assessment indicated clear separation based on the cell type. Gene level analysis use an ANOVA model; yj=m+Tj+J, where m is the mean expression of the gene, Tjis the tissue type, andJ is the error term. The ANOVA model generated a significance level for each probe set, along with the fold change, and imputed gene annotations. miR-211 target set of genes were obtained from public databases [miRanda, miRbase, miRNAmap, Tarbase, PicTar, Target ScanS, and DIANA MicroTest (http://www.ncrna.org)], and the results from ANOVA were matched to obtain the final target gene list of genes. This target list was imported into Ingenuity
Figure 7. The effect of MITF knock-down on TRPM1 and miR-211 expression in pigmented melanoma cells; SKMEL-28.
Relative gene expression levels of MITF, TRPM1, and miR-211 in MITF knock-down cells. Three different doses of MITF siRNA (5 nM, 10 nM and 15 nM) was used to knock-down MITF gene and expression values are normalized to scramble siRNA control. Histograms represent the Ratio of RNA Concentration, as measured by qRT-PCR analysis. doi:10.1371/journal.pone.0013779.g007
Pathway Analysis Version 6.0-1202 (Ingenuity SystemsH). A core analysis was run employing direct relationships only, the Ingenuity knowledge base genes as the reference set, and with down-regulators as the defined expression value parameter. All microarray data have been deposited into GEO, and accession number is pending.
Construction of miR-211 expression plasmids
Oligonucleotides complementary to the miR-211 genomic sequences (miR-211 pre For – ttccctttgtcatccttcgcct and miR-211 pre Rev – aggcgaaggatgacaaagggaa, containingHindIII andBamHI sites on their respective 59 and 39ends) were used to amplify the 110 bp pre-miR-211 sequence from human melanocyte genomic DNA (Amplitaq GoldH, Applied Biosystems) and TOPOH-cloned into the pCRH4-TOPOH vector (Invitrogen). The construct was sequenced, and the pre-hsa-miR-211 fragment was sub-cloned into pcDNA4/myc-HisA (Invitrogen) to create pcDNA4/miR-211. The
KCNMA1 siRNA sequence was derived from SilencerH siRNA (Ambion, siRNA ID: 112882) and constructed as long complemen-tary oligos (KCNMA1si For – cgtacttcaatgacaatatttcaagagaatattgt-cattgaagtacgtctttttt and KCNMA1si Rev – aaaaaagacgtacttcaatga-caatattctcttgaaatattgtcattgaagtacg, containing HindIII andBamHI sites on their respective 59and 39ends). The oligos were mixed at 100mM, heated, and amplified through one round of PCR
(Amplitaq GoldH, Applied Biosystems) and then TOPOH-cloned into the pCRH4-TOPOH vector (Invitrogen). Inserts were se-quenced and then sub-cloned into pcDNA4/myc-HisA (Invitrogen) to create pcDNA4/shKCNMA1.
Construction of stable melanoma cell lines
2.56105WM1552C or A375 melanoma cells were seeded into a single well of a 6-well plate and transfected overnight with 5mg pcDNA4/miR-211, pcDNA4/shKCNMA1, or pcDNA4/myc-HisA (‘‘vector only’’ negative control) using FugeneH 6 (Roche). The transfected cells were selected at 400 or 800mg/mL ZeocinTM for 15 days, and the presence of the transgene copy in stable ZeocinTM-resistant foci was confirmed by PCR (AmplitaqH Gold, Applied Biosystems). Cell lines were named WM1552C/211(400) or A375/211(400) when selection was at 400mg/ml ZeocinTM, and WM1552C/211(800) when selection was at 800mg/ml ZeocinTM, respectively. The ‘‘vector only’’ control cells were selected at 800mg/ml ZeocinTM. WM1552C/ KC KO were selected at 400mg/ml ZeocinTM.
Target cleavage assays
The 39 UTR seed sequences of putative target genes were amplified by PCR (PhusionTMPCR kit, Finnzymes) from human
Figure 9. A model summarizing the regulation and role of miR-211 in melanoma.MITF, a transcription factor with tumor-suppressor activity, is active in melanocytes, where it is required for the expression ofTRPM1, the structural gene for melatonin-1.miR-211gene is located within the sixth intron ofTRPM1, which is co-transcribed with theTRPM1transcript, is processed to active miR-211 and subsequently the latter acts on the 39-UTR of KCNMA1 transcript. We propose that inhibition of KCNMA1 translation is needed for preventing the development of invasive melanoma. MITF activity is low in melanoma cells, which is expected to reduceTRPM1as well asmiR-211transcription, therefore would induce the expression of
KCNMA1. While it is widely held on the basis of expression pattern alone thatTRPM1is a putative tumor suppressor, we show that miR-211, contained within the pre-mRNA of TRPM1 transcript, also has a tumor suppressor activity through its negative regulation on KCNMA1.
doi:10.1371/journal.pone.0013779.g009
Figure 8. Effects of miR-211 over-expression on melanoma cells.A and B: Relative mean cell titers of (A) WM1552C/211(400), WM1552C/ 211(800), and WM1552C/VO (vector only) cells to that of WM1552C cells and of (B) A375/211(400) and A375/VO (vector only) cells to that of A375 cells. (C) and (D): Cell invasion assays comparing WM1552C to WM1552C/VO, WM1552C/211(400), WM1552C/211(800), and WM1552C/KC KO stable derivatives, as well as to WM1552C/211(800) transfected with the Anti-miR miRNA Inhibiter for hsa-miR-211 [labelled ‘‘WM1552C/211(800)+
miR-211’’] or Negative Control#1 (labelled ‘‘WM1552C/211(800)+miR-Scramble’’) over 48 hours. Each assay was performed in triplicate. Statistical
significance is indicated by an asterisk in the figure pertaining to the experimental group delimited by a bar over the histograms (P-value,0.001). E) The artificial expression of KCNMA1 protein in WM1552C/211(800) cells increases melanoma cell invasiveness. Western blot results show that KCNMA1 protein levels are elevated in transfected cells [‘‘WM1552C/211(800)+KCNMA1 Vector’’ relative to control cells without KCNMA1 expression vector] (bottom).b-tubulin was used as a load control. Results from the invasion assay illustrate that the KCNMA1 protein expression increased melanoma cell invasiveness (top).
doi:10.1371/journal.pone.0013779.g008
melanocyte genomic DNA (Primers: KCNMA1 For – tgcggcc-gccttccctatatctaaacaatgcaaaatc, KCNMA1 Rev – aaccggtcacccatc-caggcgaggagc, the primer set contained 59NotI or 39AgeI sites). The PCR product was cloned into pCRH4-TOPOH (Invitrogen), confirmed by sequencing, then sub-cloned into the 39 UTR of the LacZ gene in pcDNA6/V5-His/LacZ (Invitrogen) using the 59NotI and 39 AgeI restriction sites and reconfirmed by sequencing (pcDNA6/LacZ/KCNMA1). The cloned 39UTR of KCNMA1 was mutated using the primers: KC Mut For- TACGCATAT-GAATTATTAAAACAATTTT and KC Mut Rev - TATGCG-TAAATTACAATTAATTGTGCT, and used to PCR amplify pcDNA6/LacZ/KCNMA1 using Quickchange (Stratagene). The plasmid product was then recovered and confirmed by sequencing (pcDNA6/LacZ/KCNMA1-MUT, see Figure S4 for mutagenesis). A375 melanoma cell lines were then transfected in triplicate (FugeneH
6, Roche) with 5mg plasmid DNA of: A) pcDNA6/LacZ/
KCNMA1, B) pcDNA6/V5-His/KCNMA1-MUT or C)
pcDNA6/V5-His/LacZ (positive control), and co-transfected (si-PORTTM, Ambion) at 100 nM with miRIDIAN microRNA Mimics (Dharmacon) for A) miR-16-1, B) miR-211, C) miR-34b, D) miR-let-7a-1, E) miRIDIAN cel-miR-67 (negative control; cel-miR-67 has been confirmed to have minimal sequence identity with miRNAs in human, mouse, and rat), or F) no mimic miRNA. After overnight incubation, cells were washed in PBS and reincubated in fresh media. After 48 hours, cells were harvested by trypsinization, examined for viability, and samples were prepared for the b-galactosidase assay using the b-Gal Assay kit (Invitrogen). Samples were incubated overnight at 37uC, then assayed forb-galactosidase activity in a 96-well plate format using a FlexStation3 (Molecular Devices).
Western blot analysis of KCNMA1
Total lysates of 56105cells of each cell line were boiled under denaturing conditions and proteins separated on 6% Tris-Glycine denaturing polyacrylamide gels by electrophoresis. Proteins transferred to nitrocellulose membranes were probed with the following primary antibodies: anti-Slo1 (NeuroMab, UC Davis) at 1/500 and anti-b-tubulin (BD Pharmingen) at 1/2000 according to standard methods. Blots were probed with horseradish peroxidase-conjugated secondary antibodies and visualized with ECL chemiluminescence (Pierce) or Alexa 680-conjugated sec-ondary antibodies (Molecular Probes) and visualized on the Licor Odyssesy (Licor).
Growth rate assays for miR-211 stable melanoma cell lines
Assays were performed using WM1552C, WM1552C/VO, WM1552C/211(400), WM1552C/211(800), A375, A375/VO, and A375/211 cell lines. Cells were grown in log phase, trypsinized, counted using an automated cell counter (Cellome-terH, Nexcelom Bioscience), and then seeded into 75 cm2flasks at 56105 cells per flask (in triplicate). Media was changed after 6 hours, and cells were further fed every 48 hours (Complete Tu Media). At days 4, 10, 15, and 21, cells were trypsinized, counted (CellometerH, Nexcelom Bioscience), and then reseeded. Each assay was performed in duplicate for all cell lines.
Invasion assays
BD BioCoatTMgrowth factor reduced insert plates (MatrigelTM Invasion Chamber 12 well plates) were prepared by rehydrating the BD MatrigelTMmatrix coating in the inserts with 0.5 mls of serum-free Complete Tu media for two hours at 37uC. The rehydration solution was carefully removed from the inserts, 0.5 ml Complete Tu (2% FBS) was added to the lower wells of the
plate, and 2.56104 cells suspended in 0.5 ml of serum-free Complete Tu media were added to each insert well. WM1552C/ 211(800) cells were additionally transfected with the Anti-miR miRNA Inhibiter for hsa-miR-211 as well as Negative Control#1 (Ambion) (miR-Scramble) at a concentration of 100 nM using siPORT NeoFX (Ambion). Invasion assay plates were incubated for 48 hours at 37uC. Following incubation, the non-invading cells were removed by scrubbing the upper surface of the insert. The cells on the lower surface of the insert were stained with crystal violet, and each trans-well membrane was mounted on a microscope slide for visualization and analysis. The slides were scanned using the Aperio Scanscope XT and visualized using the Aperio Imagescope v10 software. The number of migrating tumor cells was counted from each of five images per cell line (including miR Inhibiter transfected cells) in the central area of the filter. Cell lines were tested in triplicate, and the assays were performed twice. Data are expressed as the percent invasion through the membrane relative to the migration of WM1552C (Wild Type) through the membrane.
Transfection of Human Melanocytes using Anti-miR-211 Inhibiter molecules
56105HEM-l cells were seeded into wells of a 6-well plate. The cells were then transfected with FugeneH 6 (Roche) and either 100 nM of anti-miR-211 Inhibitors (Exiqon), 100 nM of anti-miR Inhibiter Negative Control#1 (‘‘miR-Scramble’’), or transfection agent only. After 48 hours, the cells were harvested by trypsinization and counted using an automated cell counter (CellometerH, Nexcelom Bioscience). 2.56105 cells were then prepared for western blotting (as above).
Transient Expression of KCNMA1 in a stable miR-211-expressing melanoma cell line
2.56105cells WM1552C/211(800) cells were seeded into wells of a 6-well plate. 1 well was transfected with 5mg of KCNMA1-expressing plasmid (Origene catalog#SC122078) using FugeneH
6 (Roche) and a second well was treated with transfection reagent only. After 48 hours, the cells were harvested by trypsinization and counted using an automated cell counter (CellometerH, Nexcelom Bioscience). 2.56104cells were then utilized for invasion assays (in triplicate) and 2.56105cells were prepared for western blotting (as above).
Supporting Information
Figure S1 miR-211 expression in melanocytes, normal skin and nevus. Both melanocytes and nevus sample indicate a higher expression of miR211. Melanocyte A HEMl, Melanocyte B -HEM (neonatal cell line).
Found at: doi:10.1371/journal.pone.0013779.s001 (0.26 MB TIF)
Figure S2 miR-211 expression in stable melanoma cell lines compared to melanocytes. Two stable miR-211-expressing WM1552C cell lines, as well as a ‘‘Vector Only’’ (VO) control cell line, as measured by qRT-PCR relative to levels in the melanocyte cell line HEM-l, are plotted as histograms. Error bars are standard errors of mean of three independent measurements. Found at: doi:10.1371/journal.pone.0013779.s002 (0.24 MB TIF)
Figure S3 Mutagenesis of miR-211 target seed sequence in the 39UTR of KCNMA1. Diagram indicates the four nucleotides altered in the target seed sequence within the 39UTR of KCNMA1 relative to the wild type.
Table S1 Description of human clinical samples.
Found at: doi:10.1371/journal.pone.0013779.s004 (0.72 MB TIF)
Table S2 miR-211 expression levels in clinical samples. Note: Two-tailed t-test comparisons for miR-211 by mean relative quantification levels of melanocyte and primary melanoma, as well as regional, distant, and nodal metastatic melanoma were all statistically significant at P,0.000001.
Found at: doi:10.1371/journal.pone.0013779.s005 (0.84 MB TIF)
Acknowledgments
We thank Drs. Brower, Garber, and Purdie at the Memorial Health University Medical Centre for clinical samples and discussion, and Debbie McFadden for help in manuscript preparation.
Author Contributions
Conceived and designed the experiments: AR RJP. Performed the experiments: JM KD DK AA. Analyzed the data: JM KD EM AA AR RJP. Contributed reagents/materials/analysis tools: JM KD JG RJP. Wrote the paper: JM AR RJP.
References
1. Nashan D, Muller ML, Grabbe S, Wustlich S, Enk A (2007) Systemic therapy of disseminated malignant melanoma: an evidence-based overview of the state-of-the-art in daily routine. J Eur Acad Dermatol Venereol 21: 1305–1318. 2. Rass K, Reichrath J (2008) UV damage and DNA repair in malignant
melanoma and nonmelanoma skin cancer. Adv Exp Med Biol 624: 162–178. 3. Matsumura Y, Ananthaswamy HN (2002) Molecular mechanisms of
photo-carcinogenesis. Front Biosci 7: d765–783.
4. Cleaver JE, Crowley E (2002) UV damage, DNA repair and skin carcinogenesis. Front Biosci 7: d1024–1043.
5. de Gruijl FR, van Kranen HJ, Mullenders LH (2001) UV-induced DNA damage, repair, mutations and oncogenic pathways in skin cancer. J Photochem Photobiol B 63: 19–27.
6. Soehnge H, Ouhtit A, Ananthaswamy ON (1997) Mechanisms of induction of skin cancer by UV radiation. Front Biosci 2: d538–551.
7. Gonzalgo ML, Bender CM, You EH, Glendening JM, Flores JF, et al. (1997) Low frequency of p16/CDKN2A methylation in sporadic melanoma: comparative approaches for methylation analysis of primary tumors. Cancer Res 57: 5336–5347.
8. Worm J, Bartkova J, Kirkin AF, Straten P, Zeuthen J, et al. (2000) Aberrant p27Kip1 promoter methylation in malignant melanoma. Oncogene 19: 5111–5115.
9. Worm J, Christensen C, Gronbaek K, Tulchinsky E, Guldberg P (2004) Genetic and epigenetic alterations of the APC gene in malignant melanoma. Oncogene 23: 5215–5226.
10. Hoon DS, Spugnardi M, Kuo C, Huang SK, Morton DL, et al. (2004) Profiling epigenetic inactivation of tumor suppressor genes in tumors and plasma from cutaneous melanoma patients. Oncogene 23: 4014–4022.
11. Guan X, Sagara J, Yokoyama T, Koganehira Y, Oguchi M, et al. (2003) ASC/ TMS1, a caspase-1 activating adaptor, is downregulated by aberrant methylation in human melanoma. Int J Cancer 107: 202–208.
12. Cretnik M, Poje G, Musani V, Kruslin B, Ozretic P, et al. (2009) Involvement of p16 and PTCH in pathogenesis of melanoma and basal cell carcinoma. Int J Oncol 34: 1045–1050.
13. Mancuso M, Gallo D, Leonardi S, Pierdomenico M, Pasquali E, et al. (2009) Modulation of basal and squamous cell carcinoma by endogenous estrogen in mouse models of skin cancer. Carcinogenesis 30: 340–347.
14. Suarez-Martinez EB, Ruiz A, Matias J, Morales L, Cruz A, et al. (2007) Early-onset of sporadic basal-cell carcinoma: germline mutations in the TP53, PTCH, and XPD genes. P R Health Sci J 26: 349–354.
15. Geng J, Tang W, Wan X, Zhou Q, Wang XJ, et al. (2008) Photoprotection of bacterial-derived melanin against ultraviolet A-induced cell death and its potential application as an active sunscreen. J Eur Acad Dermatol Venereol 22: 852–858.
16. Carr KM, Bittner M, Trent JM (2003) Gene-expression profiling in human cutaneous melanoma. Oncogene 22: 3076–3080.
17. Houghton AN, Polsky D (2002) Focus on melanoma. Cancer Cell 2: 275–278. 18. Dankort D, Curley DP, Cartlidge RA, Nelson B, Karnezis AN, et al. (2009) Braf(V600E) cooperates with Pten loss to induce metastatic melanoma. Nat Genet 41: 544–552.
19. Liu ZJ, Xiao M, Balint K, Smalley KS, Brafford P, et al. (2006) Notch1 signaling promotes primary melanoma progression by activating mitogen-activated protein kinase/phosphatidylinositol 3-kinase-Akt pathways and up-regulating N-cadherin expression. Cancer Res 66: 4182–4190.
20. Massi D, Tarantini F, Franchi A, Paglierani M, Di Serio C, et al. (2006) Evidence for differential expression of Notch receptors and their ligands in melanocytic nevi and cutaneous malignant melanoma. Mod Pathol 19: 246–254. 21. Curtin JA, Fridlyand J, Kageshita T, Patel HN, Busam KJ, et al. (2005) Distinct
sets of genetic alterations in melanoma. N Engl J Med 353: 2135–2147. 22. Quintana E, Shackleton M, Sabel MS, Fullen DR, Johnson TM, et al. (2008)
Efficient tumour formation by single human melanoma cells. Nature 456: 593–598.
23. Shenouda SK, Alahari SK (2009) MicroRNA function in cancer: oncogene or a tumor suppressor? Cancer Metastasis Rev 28: 369–378.
24. Aqeilan RI, Calin GA, Croce CM (2010) miR-15a and miR-16-1 in cancer: discovery, function and future perspectives. Cell Death Differ 17: 215–220. 25. Lynam-Lennon N, Maher SG, Reynolds JV (2009) The roles of microRNA in
cancer and apoptosis. Biol Rev Camb Philos Soc 84: 55–71.
26. Schmittgen TD (2008) Regulation of microRNA processing in development, differentiation and cancer. J Cell Mol Med 12: 1811–1819.
27. Chen A, Luo M, Yuan G, Yu J, Deng T, et al. (2008) Complementary analysis of microRNA and mRNA expression during phorbol 12-myristate 13-acetate (TPA)-induced differentiation of HL-60 cells. Biotechnol Lett 30: 2045–2052. 28. Igoucheva O, Alexeev V (2009) MicroRNA-dependent regulation of cKit in
cutaneous melanoma. Biochem Biophys Res Commun 379: 790–794. 29. Baugh LR, Demodena J, Sternberg PW (2009) RNA Pol II accumulates at
promoters of growth genes during developmental arrest. Science 324: 92–94. 30. Felicetti F, Errico MC, Bottero L, Segnalini P, Stoppacciaro A, et al. (2008) The
promyelocytic leukemia zinc finger-microRNA-221/-222 pathway controls melanoma progression through multiple oncogenic mechanisms. Cancer Res 68: 2745–2754.
31. Schultz J, Lorenz P, Gross G, Ibrahim S, Kunz M (2008) MicroRNA let-7b targets important cell cycle molecules in malignant melanoma cells and interferes with anchorage-independent growth. Cell Res 18: 549–557. 32. Bemis LT, Chen R, Amato CM, Classen EH, Robinson SE, et al. (2008)
MicroRNA-137 targets microphthalmia-associated transcription factor in melanoma cell lines. Cancer Res 68: 1362–1368.
33. Chen CZ (2005) MicroRNAs as oncogenes and tumor suppressors. N Engl J Med 353: 1768–1771.
34. Dalmay T, Edwards DR (2006) MicroRNAs and the hallmarks of cancer. Oncogene 25: 6170–6175.
35. Esquela-Kerscher A, Slack FJ (2006) Oncomirs - microRNAs with a role in cancer. Nat Rev Cancer 6: 259–269.
36. Perera RJ, Ray A (2007) MicroRNAs in the search for understanding human diseases. BioDrugs 21: 97–104.
37. Kent OA, Mendell JT (2006) A small piece in the cancer puzzle: microRNAs as tumor suppressors and oncogenes. Oncogene 25: 6188–6196.
38. Zhang B, Pan X, Cobb GP, Anderson TA (2006) microRNAs as oncogenes and tumor suppressors. Dev Biol.
39. Hammond SM (2006) MicroRNAs as oncogenes. Curr Opin Genet Dev 16: 4–9.
40. Hoek K, Rimm DL, Williams KR, Zhao H, Ariyan S, et al. (2004) Expression profiling reveals novel pathways in the transformation of melanocytes to melanomas. Cancer Res 64: 5270–5282.
41. Mueller DW, Rehli M, Bosserhoff AK (2009) miRNA Expression Profiling in Melanocytes and Melanoma Cell Lines Reveals miRNAs Associated with Formation and Progression of Malignant Melanoma. J Invest Dermatol. 42. Felicetti F, Errico MC, Segnalini P, Mattia G, Care A (2008) MicroRNA-221
and -222 pathway controls melanoma progression. Expert Rev Anticancer Ther 8: 1759–1765.
43. Segura MF, Hanniford D, Menendez S, Reavie L, Zou X, et al. (2009) Aberrant miR-182 expression promotes melanoma metastasis by repressing FOXO3 and microphthalmia-associated transcription factor. Proc Natl Acad Sci U S A 106: 1814–1819.
44. Jukic DM, Rao UN, Kelly L, Skaf JS, Drogowski LM, et al. (2010) Microrna profiling analysis of differences between the melanoma of young adults and older adults. J Transl Med 8: 27.
45. Lee WJ, Roberts-Thomson SJ, Holman NA, May FJ, Lehrbach GM, et al. (2002) Expression of plasma membrane calcium pump isoform mRNAs in breast cancer cell lines. Cell Signal 14: 1015–1022.
46. Li G, Satyamoorthy K, Herlyn M (2001) N-cadherin-mediated intercellular interactions promote survival and migration of melanoma cells. Cancer Res 61: 3819–3825.
47. Qi J, Chen N, Wang J, Siu CH (2005) Transendothelial migration of melanoma cells involves N-cadherin-mediated adhesion and activation of the beta-catenin signaling pathway. Mol Biol Cell 16: 4386–4397.
48. Lukashova-v Zangen I, Kneitz S, Monoranu CM, Rutkowski S, Hinkes B, et al. (2007) Ependymoma gene expression profiles associated with histological subtype, proliferation, and patient survival. Acta Neuropathol 113: 325–337. 49. Bloch M, Ousingsawat J, Simon R, Schraml P, Gasser TC, et al. (2007)
KCNMA1 gene amplification promotes tumor cell proliferation in human prostate cancer. Oncogene 26: 2525–2534.
involving hypoxia-inducible factor-1alpha and the von Hippel-Lindau protein. J Physiol 571: 349–359.
51. Weaver AK, Bomben VC, Sontheimer H (2006) Expression and function of calcium-activated potassium channels in human glioma cells. Glia 54: 223–233. 52. Crijns AP, de Graeff P, Geerts D, Ten Hoor KA, Hollema H, et al. (2007) MEIS and PBX homeobox proteins in ovarian cancer. Eur J Cancer 43: 2495–2505. 53. Geerts D, Schilderink N, Jorritsma G, Versteeg R (2003) The role of the MEIS
homeobox genes in neuroblastoma. Cancer Lett 197: 87–92.
54. Conn EM, Madsen MA, Cravatt BF, Ruf W, Deryugina EI, et al. (2008) Cell surface proteomics identifies molecules functionally linked to tumor cell intravasation. J Biol Chem 283: 26518–26527.
55. Chen M, Sinha M, Luxon BA, Bresnick AR, O’Connor KL (2009) Integrin alpha6beta4 controls the expression of genes associated with cell motility, invasion, and metastasis, including S100A4/metastasin. J Biol Chem 284: 1484–1494.
56. Aubert B, Barate R, Bona M, Boutigny D, Couderc F, et al. (2006) Observation of a new Ds meson decaying to DK at a mass of 2.86 GeV/c2. Phys Rev Lett 97: 222001.
57. Gyorffy B, Serra V, Materna V, Schafer R, Dietel M, et al. (2006) Analysis of gene expression profiles in melanoma cells with acquired resistance against antineoplastic drugs. Melanoma Res 16: 147–155.
58. Miller AJ, Du J, Rowan S, Hershey CL, Widlund HR, et al. (2004) Transcriptional regulation of the melanoma prognostic marker melastatin (TRPM1) by MITF in melanocytes and melanoma. Cancer Res 64: 509–516.
59. Repesh LA (1989) A new in vitro assay for quantitating tumor cell invasion. Invasion Metastasis 9: 192–208.
60. Ma X-J, Wang Z, Ryan PD, Isakoff SJ, Barmettler A, et al. (2004) A two-gene expression ratio predicts clinical outcome in breast cancer patients treated with tamoxifen. Cancer Cell 5: 607–616.
61. Duncan LM, Deeds J, Cronin FE, Donovan M, Sober AJ, et al. (2001) Melastatin expression and prognosis in cutaneous malignant melanoma. J Clin Oncol 19: 568–576.
62. Oancea E, Vriens J, Brauchi S, Jun J, Splawski I, et al. (2009) TRPM1 forms ion channels associated with melanin content in melanocytes. Sci Signal 2: ra21. 63. Gupta PB, Onder TT, Jiang G, Tao K, Kuperwasser C, et al. (2009)
Identification of selective inhibitors of cancer stem cells by high-throughput screening. Cell 138: 645–659.
64. Gaur A, Jewell DA, Liang Y, Ridzon D, Moore JH, et al. (2007) Characterization of microRNA expression levels and their biological correlates in human cancer cell lines. Cancer Res 67: 2456–2468.
65. Chen C, Ridzon DA, Broomer AJ, Zhou Z, Lee DH, et al. (2005) Real-time quantification of microRNAs by stem-loop RT-PCR. Nucleic Acids Res 33: e179.
66. Storey JD, Tibshirani R (2003) Statistical methods for identifying differentially expressed genes in DNA microarrays. Methods Mol Biol 224: 149–157. 67. Storey JD, Tibshirani R (2003) Statistical significance for genomewide studies.
Proc Natl Acad Sci U S A 100: 9440–9445.