Bi-Module Sensing Device to
Quantitatively Detect Hydrogen Peroxide
Released from Migrating Tumor Cells
Ling Yu1,2,3*, YunLi Tian1,2,3, AnXiu Gao1,2,3, ZhuanZhuan Shi1,2,3, YingShuai Liu1,2,3*, ChangMing Li1,2,3
1Institute for Clean energy & Advanced Materials, Faculty of Materials & Energy, Southwest University, Chongqing 400715, China,2Chongqing Key Laboratory for Advanced Materials and Technologies of Clean Energies, Chongqing 400715, China,3Chongqing Engineering Research Center for Rapid diagnosis of Fatal Diseases, Chongqing 400715, China
*[email protected](LY);[email protected](YSL)
Abstract
Cell migration is one of the key cell functions in physiological and pathological processes, especially in tumor metastasis. However, it is not feasible to monitor the important biochemi-cal molecules produced during cell migrationsin situby conventional cell migration assays. Herein, for the first time a device containing both electrochemical sensing and trans-well cell migration modules was fabricated to sensitively quantify biochemical molecules re-leased from the cell migration processin situ. The fully assembled device with a multi-wall carbon nanotube/graphene/MnO2nanocomposite functionalized electrode was able to
suc-cessfully characterize hydrogen peroxide (H2O2) production from melanoma A375 cells,
lar-ynx carcinoma HEp-2 cells and liver cancer Hep G2 under serum established chemotaxis. The maximum concentration of H2O2produced from A375, HEp-2 and Hep G2 in
chemo-taxis was 130±1.3 nM, 70±0.7 nM and 63±0.7 nM, respectively. While the time required reaching the summit of H2O2production was 3.0, 4.0 and 1.5 h for A375, HEp-2 and Hep
G2, respectively. By staining the polycarbonate micropore membrane disassembled from the device, we found that the average migration rate of the A375, HEp-2 and Hep G2 cells were 98±6%, 38±4% and 32±3%, respectively. The novel bi-module cell migration platform enablesin situinvestigation of cell secretion and cell function simultaneously, highlighting its potential for characterizing cell motility through monitoring H2O2production on rare
sam-ples and for identifying underlying mechanisms of cell migration.
Introduction
Cell migration plays a role in many physiological and pathological processes, including tumor metastasis.[1–3] It is a physical and chemical multistep cycle including extension of a protru-sion, formation of stable attachments near the leading edge of the protruprotru-sion, translocation of the cell body forward, and release of adhesions and retraction at the cell rear.[4–6] Cell a11111
OPEN ACCESS
Citation:Yu L, Tian Y, Gao A, Shi Z, Liu Y, Li C (2015) Bi-Module Sensing Device toIn Situ
Quantitatively Detect Hydrogen Peroxide Released from Migrating Tumor Cells. PLoS ONE 10(6): e0127610. doi:10.1371/journal.pone.0127610
Academic Editor:Donghui Zhu, North Carolina A&T State University, UNITED STATES
Received:December 29, 2014
Accepted:April 17, 2015
Published:June 2, 2015
Copyright:© 2015 Yu et al. This is an open access article distributed under the terms of theCreative Commons Attribution License, which permits unrestricted use, distribution, and reproduction in any medium, provided the original author and source are credited.
Data Availability Statement:All relevant data are within the paper and its Supporting Information files.
migration is a prerequisite step for tumor cell invasion and metastasis that is among the most complicated and major pathologic process responsible for metastasis and poor prognosis of cancer patients.[7–9] Based on a western-blot assay, activation of multiple signalling pathways, such as extracellular signal-regulated kinase (ERK), integrin and focal adhesion kinase (FAK), are associated with cell migration.[5,10–14] Recently, studies have shown that reactive oxygen species (ROS), particularly hydrogen peroxide (H2O2), diffusing freely through cellular mem-branes, can function as a signal messenger delivering information between signalling pathways and can even facilitate communication between cells.[15–23] Usatyuket al. reported that ROS generation is responsible for hepatocyte growth factor (HGF) activated c-Met/PI3K/AKT sig-nalling, which is an important pathway linked to cell migration.[16] Other cellular factors like Arp2/3 complex and FAK required for cell migration are also under the control of ROS.[11,16, 17,24]Apart from activation of signalling proteins, the influence of H2O2on cell migration has been investigated through characterization of cell migration capability under exogenous H2O2 simulation.[21,22,25–27] Polytarchouet al. reported that exogenous H2O2at a concentration of 5μM induced human prostate adenocarcinoma LNCaP cell migration in a
micro-chemotax-is chamber assay.[21] Luanpitonget al. evaluated the impact of various known inhibitors and donors of ROS on cell migration. Their results demonstrated that H2O2(100μM) inhibited
lung carcinoma H460 cell migration and invasion in a wound healing assay.[22] This contra-diction in results obtained from these studies may be rooted on the dosage of exogenous H2O2, production site, as well as the tissue type of cells. The next concern is that extremely high, non-physiological concentrations of H2O2were used, barely mimicking living cell environment. More importantly is that little is known about endogenous H2O2levels during cell migration. In addition, from a methodology point of view, the dominant technique for characterization of cellular ROS is based on probe-labelling assays. Fluorescent histochemistry[28], flow cytome-tery[29] and spectrofluorimetric analysis[30] are the most widely used approaches to charac-terize ROS by using fluorescent dyes 2',7'-dichlorofluorescein diacetate (DCFH-DA),
hydroethidine (HE) and dihydrorhodamine 123 (DHR)etc. These probe-labelling approaches are based on indirect methods that have been shown to be time consuming, difficult to auto-mate and highly prone to interferences.[31] Most importantly, it is not feasible to conduct mea-surementsin situthat can provide cell metabolism information and it is not feasible for characterization of cell morphology, not to mention biological functions, such as migration. [32] On the other hand, wound healing assays, trans-well assays or Boyden chamber assays, are widely used for cell migration experiments; however, they are used solely to characterize cell motility by quantifying the number of migrated cells, lacking the capability to probe biochemi-cal changes during migration. Apart from investigation of the impact of exogenous H2O2on cell migration, less attention has been paid to directly address H2O2production during cell mi-gration or invasion. Therefore, the aim of this study is to define a rational strategy enablingin situmonitoring of biochemical changes during the cell migration process for delineating the underlying molecular mechanisms.
Electrochemical sensors demonstrate their potential to analyse cell-secreted biomolecules. [33–36] Dr. McConnell and co-worker investigated extracellular menadiol redox activity by means of an extracellular solution containing the ferricyanide/ferrocyanide couple and a gold electrode.[37] Cytosensor microphysiometer was modified for the electrochemical detection of extracellular acidification, oxygen consumption rates or insulin.[38–40] In our previous study, as low as a 40μL sample volume was required to probe H2O2secreted from tumor cells.[41] The use of a small volume sample allows expensive reagents, particularly for rare clinical biop-sies, to be conserved and makes using this analysis more cost-effective. On the other hand, the progress in lab-on-a-chip technology facilitates the study of cellular behaviour under tightly controlled microenvironments with high spatiotemporal resolution.[42–47] Previous
endeavours have focused on establishing a microenvironment that mimicsin vivoconditions for cell migration and analysis of migration at a single cell level.[9,42–44] But, those achieve-ments mainly illustrated the morphology and functional changes of cells during cell migration. No studies have been reported to study biochemical molecule generation during the cell migration process.
In this work, an electrochemical sensor embedded poly(dimethylsiloxane) (PDMS) device was developed to monitor H2O2in situduring tumor cell migration process. To achieve this goal, a multi-wall carbon nanotube (MWCNT)/graphene/MnO2composite functionalized in-dium tin oxide (ITO) glass electrode was fabricated as a H2O2sensing module. This H2O2 sens-ing module was assembled with a cell migration module that is a PDMS chamber/
polycarbonate membrane/PDMS chamber sandwich structure. The fully assembled bi-module devicein situsensed H2O2production of human melanoma cell migration under a serum es-tablished chemotaxis field. The effect of the cell H2O2production inhibitor, diphenyleneiodo-nium (DPI), and H2O2decomposition enzyme, catalase, on cell migration was also
investigated on assembled devices. H2O2generation and migration capability measured with assembled devices were interpreted with standard Boyden transwell assays and the results con-firmed that the fully assembled bi-module device could indeed monitor H2O2in situduring cell migration.
Materials and Methods
Materials
Graphite, multi-walled carbon nanotubes (MWCNT), ascorbic acid, 30% hydrogen peroxide, potassium hexacyanoferrate (III) (K3[Fe(CN)6]), Nafion were purchased from Aladdin, China. Phosphate buffered saline (PBS), potassium permanganate (KMnO4) were from Chongqing co. Indium tin oxide (ITO) glass and silver paste were obtained from Jieshen Electronics Tech-nology CO. Ltd (China). Printed circuit broad (PCB) UV photosensitive dry film (40μm) was
obtained from IC Machinery Equipment Group (China). Human melanoma cells, A375, were obtained from ATCC. Human liver carcinoma cell line Hep G2 and human Larynx carcinoma cell line HEp-2, gifts from Dr. Yuan Li (Chongqing Medical University), were originally pur-chased from China Center for Type Culture Collection. The cells were maintained in RPMI 1640 medium (Gibco) with 10% fetal bovine serum (Gibco), 100μg mL-1penicillin and 100μg
mL-1streptomycin. Phorbol 12-myristate-13-acetate (PMA), di-phenyleneiodonium (DPI), catalase and Whatman Cyclopore polycarbonatemembrane (cyclopore PC circles, 5.0μm)
were purchased from Sigma Aldrich. PMA and DPI were dissolved with dimethyl sulfoxide (DMSO) to a concentration of 5 mg mL-1and 10 mM, respectively, as a stock solution. All other chemicals used in this study were analytical grade. The deionized (DI) water used in all experiments was produced by a Q-Grad1 system, Millipore Corporation.
Bi-module device design and fabrication
UV photolithography process. ITO layer that was not covered by photosensitive film was dis-solved by immersing the chips in etchant solution (37%HCl: H2O:FeCl3•6H2O = 3L:1L:25g) for 30min. Finally, the patterned electrodes were recovered by removing the residue photosen-sitive film (a). A PDMS ring with a diameter of 5 mm and a height of 1mm was treated by plas-ma cleaner (Harrick, PDC-002) for 60 second and then bonded with ITO electrodes (b). To assemble a transwell chamber for assaying cell migration, a polycarbonate membrane was placed on top of the PDMS ring (c). Finally, another PDMS ring with a diameter of 5 mm and height of 5 mm was assembled on top of the polycarbonate membrane (d).
Electrochemical device for hydrogen peroxide analysis
The sensing material for hydrogen peroxide (H2O2) detection used in this study was a MWCNT/graphene/MnO2aerogel. This functional material was synthesized according to our previous study.[41] In brief, a mixture containing MWCNT (1mg mL-1), graphene oxide (1mg mL-1) and KMnO4(10mg mL-1) was prepared and stirred at room temperature for 16 h. Then, the reaction mixture was centrifuged to collect the precipitate. Next, the re-suspended precipi-tate was mixed with ascorbic acids solution (100 mg mL-1) at 50°C for 15h to form a MWCNT/ graphene/MnO2hydrogel, and then freeze-dried for 24 h to completely remove water. The ob-tained aerogel (MWCNT/graphene /MnO2) was dispersed in 500μL of ethanol (5 mg/mL) and casted onto the surface of ITO working electrodes. The MWCNT/graphene/MnO2 -functiona-lized electrode was characterized by cyclic voltammetry (CV) in 0.5 M KCl solution containing 50 mM K3Fe(CN)6at the scan rate of 10 mVs-1. Then the amperometric response of the fully assembled electrochemical sensor to H2O2was characterized with RPMI 1640 medium accord-ing to the literature.[41] To analyse the stability of the MWCNT/graphene/MnO2 functiona-lized electrode, the electrode was immersed in the cell culture medium for 24 h. The CV response of the electrode was recorded when adding H2O2(4μM) in to the cell culture medium
at 0, 12, 18 and 24 h and the changes of reduction peak current of the CV curve was compared.
Quantification of H2O2 production from migrating cell in a fully
assembled device
Human melanoma A375 cells, liver cancer Hep G2 and larynx carcinoma HEp-2 cells were cul-tured in RPMI 1640 medium supplemented with 10% FCS under standard conditions (37°C, 5%
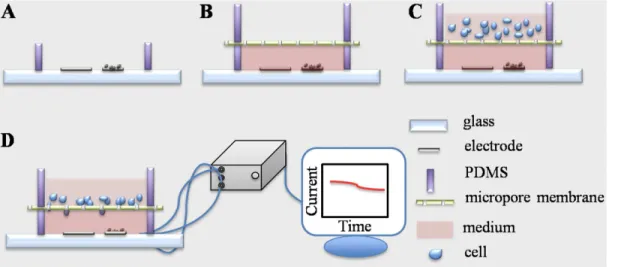
Fig 1. (A) 3D image of the bi-module device that consists of an electrochemical detection module and cell migration module (a); photograph of a device for experiment (b); section view of a bi-module devise (c); (B) Schematic diagram of the micro-fabrication processes: patterning and fabrication of electrodes on a ITO glass (a); bonding of a PDMS ring (5 mm in diameter, 1 mm in height) with ITO glass (b); assemble of a polycarbonate membrane on top of the PDMS right (c); assemble of a PDMS ring (5 mm in diameter, 5 mm in height) on top of the membrane (d). ITO: indium tin oxide, PDMS: Poly(dimethylsiloxane).
CO2).Fig 2illustrates the measurement settings. A functional sensing material, MWCNT/gra-phene/MnO2in ethanol (5 mg/mL), was cast on the working electrode. Then one microliter of Nafion that was diluted in ethanol (1:30, V/V) was casted (a). 50μL of RPMI 1640 medium, with or without serum, was placed in the bottom PDMS chamber. A polycarbonate membrane and another PDMS ring were assembled on top of the bottom chamber in order (b). Next, serum-starved tumor cells (1×10⁶) in 100μL serum-free RPMI 1640 medium were placed into the top
chamber (c). All steps were conducted in a biological hood with caution to avoid microorganism contamination. Finally, the device with cell-loading was placed in a cell culture incubator main-taining stable temperature and CO2atmosphere (37°C, 5% CO2). The copper wires were linked to an electrochemical station (CHI 760) and the amperometric signal (i-tcurve) was recorded for 12 h (d). The signal from the device without cell loading was recorded as a basal control. Cells in-cubated with a H2O2generation inhibitor DPI (10μM) and a H2O2decomposer catalase (5μg
mL-1) were measured in parallel. Since the DPI and PMA were dissolved in DMSO, the impact of this organic solvent (0.5%, V/V) on H2O2production was evaluated. After electrochemical measurement, the polycarbonate membrane in the device was disassembled and the migrated cells were visualized by hematoxylin and eosin (H&E) staining. In brief, the membrane was im-mersed in 4% paraformaldehyde solution for 10 min and then stained by hematoxylin and eosin solution for 10 and 2 min, respectively. Finally, loosely attached cells on topside of the membrane were removed by scrubbing twice with cotton tipped swab.[48] The cell visualized on the bottom side of the membrane was defined as migrating cell. Six randomly selected fields per membrane were imaged (Olympus IX73, Japan) and the number of the purple-stained cells was counted. The percentage of migrated cells was calculated using medium without serum in the bottom chamber as a reference. All experiments were repeated three times independently.
Statistical analysis
Results are expressed as means ± the standard error of the mean (SEM). The data were ana-lyzed by Student’st-test using Origin Statistic software (OriginLab Corporation, USA). Ap -value<0.05 was considered significant.
Fig 2. Experimental protocol for the electrochemical detection of H2O2production during cell migration.(a) MWCNT/graphene/MnO2functional
material is casted on working electrode (right one) surface following a layer of Nafion coating; (b) RPMI 1640 medium is injected into the PDMS ring (bottom) using a micropipette; then polycarbonate membrane is placed on top of the PDMS ring (bottom), and another piece of PDMS ring (upper) is aligned over the membrane; (c) cell suspension is injected into the upper cell seeding chamber using a micropipette; (d) the cell-loaded device is incubated in a cell incubator for 12h and the electrochemical signal is recorded. MWCNT: mutil-wall carbon nanotube, PDMS: Poly(dimethylsiloxane).
Results and Discussion
Electrochemical characterization of the assembled device
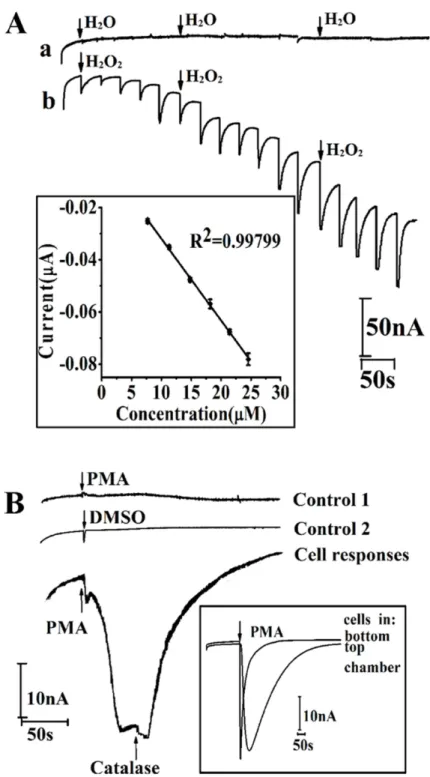
Our previous study demonstrated that MWCNT/graphene/MnO2specifically responses to H2O2.[41] To evaluate the stability of the sensor that immersed in cell culture medium for 24 h, 1 mM H2O2was added into the medium at 0, 12, 18 and 24 h, and the CV response was re-corded. The H2O2induced peak current change (S1 Fig) shows that immersing the MWCNT/ graphene/MnO2decorated electrode in cell culture medium for 24 h would not attenuate the function of the sensor. To realize H2O2productionin situ, attention has been paid on the am-perometric response of the MWCNT/graphene/MnO2functionalized device to subsequent ad-ditions of H2O2in cell culture medium (RPMI 1640). First, the choice of the applied potential at the working electrode is optimized to achieve a higher sensitivity. The amperometrici-t curves under potentials between -0.3 V and−0.5 V (vsITO reference electrode/counter elec-trode, RE/CE) were recorded. As shown in supplementaryS2 Fig, the best performance is ob-tained with a potential of -0.4 VvsITO RE/CE. Therefore, the sensitivity of the device was monitored amperometrically at the working potential of−0.4 VvsITO RE/CE. Deionized water (DI H2O) and 4μM H2O2were subsequent added in medium. The amperometric re-sponse of adding DI water is barely observed; indicating the action of pipetting liquid into the reaction chamber does not spike noise (Fig 3A, curvea). While, the amperometric signal in curvebofFig 3Ashows that the device responds quickly to the change of H2O2concentration. Inset ofFig 3Ashows the calibration curve of the fully assembled device for H2O2detection with a linear equation of Current (μA) = -5.8×10⁻⁴–0.00313CH2O2(H2O2concentration,μM),
of which the R2is 0.997 and standard error of the slope is 6.2×10⁻⁵. The sensitivity of the fully assembled devices is 3.2 nAμM−1cm−2, based on the ratio of the slope of current-dose response
curve and the surface area of electrode. Finally, human melanoma cells A375 (1×10⁵cell) were cultured on the upper chamber of the device. Thein situmonitoring of H2O2release was inves-tigated by using phorbol 12-myristate-13-acetate (PMA), a model drug known to trigger H2O2 production from human cells. Meanwhile, catalase, a H2O2scavenger, was measured along with PMA to investigate the specificity of thein situmonitoring of H2O2secreted from cells in the upper chamber. As presented inFig 3B, no current response was observed from the device without cells (line: control 1) and the device with cultured cells under DMSO (solvent of PMA) injection (line: control 2). With the addition of catalase that can decompose H2O2to water and oxygen, the reduction peak current increase caused by PMA injection decreases sharply (line: cell response). It has been reported that H2O2can diffuse through cellular membranes to a dis-tance even nearly 1mm because of its solubility in both lipid and aqueous environments and comparatively low reactivity.[33,49] To investigate the effect of the cell location on H2O2 de-tection, we measured the production of H2O2from cells growing in the upper and bottom PDMS chamber of the assembled device. A similar current intensity was observed from cells seeded in upper and bottom chamber upon PMA challenge (inset ofFig 3B), indicating the electrochemical sensor located at the bottom chamber canin situsense H2O2secreted from cells seeding in the top chamber.
Quantification of H
2O
2generation during cell migration by
electrochemical devices
Fig 3. Amperometric performance (i-tcurve) of fully assembled device.(A)i-tcurves of successive additions of H2O (a) or 4μM H2O2(b) into RPMI 1640 at an applied potential of -0.4 VvsITO RE/CE; (B)i-t
curves of PMA injection (0.5mg mL-1) without cells loading (control 1), DMSO (0.5%, v/v%) injection with cell
loading (control 2), PMA injection (0.5 mg mL-1) with cells loading, and followed by catalase injection (5 μg
mL-1)-cell response at an applied potential of -0.4 VvsITO RE/CE; Inset of (B)i-tcurves of PMA injection with cells loaded in top and bottom chamber of assembled device. RE/CE: reference electrode/ counter electrode; PMA: phorbol 12-myristate-13-acetate, DMSO: dimethyl sulfoxide
cells that was monitored for 12 h at 37°C. The current baseline of the electrochemical device during a 12 h incubation time was recorded without cell loading (control 1). No visible current change was observed indicating the H2O2will not automatically be generated from the medium during 12h incubation. The signal from cells that were seeded in a device with serum free medi-um in the bottom chamber was characterized as a migration control (cell 1, no sermedi-um in top
Fig 4. (A) Amperometric responses of fully functionalized bi-module device during melanoma A375 cell migration.No cell: device without cell loading;No serum: medium without serum in bottom chamber;DPI: RPMI 1640 containing 10% serum (conditioned medium) in bottom chamber, cell in upper chamber was incubated with H2O2generation inhibitor, DPI;Catalase: conditioned medium in bottom chamber, cell in
upper chamber was incubated with H2O2decomposer, catalase;Cell migration: conditioned medium in
bottom chamber;DMSO: conditioned medium in bottom chamber, cell in upper chamber was incubated with DMSO (solvent of DPI). (B) The corresponding current response obtained from amperometric curves of three independent experiments, (n = 3,*denotesp<0.05). DPI: diphenyleneiodonium.
and bottom chamber). The amperometric track shows a current increase (16–28 nA) at the time course of 2–4 h, while the current gradually flows back during 5–7 h and stays stable dur-ing the rest of the assay time. We tested the H2O2generated from cells seeded in a device in which RPMI 1640 medium plus 10% FBS (conditioned medium) was placed in the bottom chamber. Thein situmeasurement shows a cathode current increase trend and the current change reaches the maximum 84 ±1 nA at 3h. For the rest of the time, the current gradually traced back to baseline (cell 2, migration). To specify that the amperometric signal was indeed given by H2O2production during cell migration, NADH oxidase inhibitor DPI (10μM) and
H2O2decomposer catalase (5μg mL-1) were used to pre-treat cells loaded in the upper
cham-ber. Cell response 3 is the current signal from DPI pre-treated cells that were seeded in a device containing conditioned medium in the bottom chamber. A maximum current increase (23 ±1 nA) can be read from thei-tcurve. While, for cells incubated with catalase, a similari-tcurve was recorded. The impact of DMSO (solvent of DPI) on H2O2productionwas measured in a cell migration section.Fig 4Bshows the histogram of current change at a time point of 3h. The highest current change (84±1 nA) is given by cells responding to medium containing 10% serum. The current value obtained from serum-starved cells incubated with DPI and catalase in devices that contained conditional medium (RPMI 1640 plus 10% FBS) in the bottom cham-ber are 23±1 nA and 32±2 nA, respectively, which are significantly lower than the non-pre-treated cells. Previous studies argued that DPI shows paradoxical effect in inducing DNA dam-age, mitochondria dysfunctional and even apoptosis.[50–52] To investigate if the small current increase was caused by DPI impaired cell growth, we compared the viability of cells pre-treated by DPI, catalase and DMSO using MTT method (S3 Fig). The results show that DPI (10μM)
or catalase (5μg mL-1) does not reduce the viability of melanoma A375 cell.
In addition, according to the sensitivity of the electrochemical device as characterized inFig 3A, H2O2produced from cells can be calculated as detailed in the literature.[33,41] At the 3h time point, the generated H2O2from none pre-treated, DPI and catalase pre-treated cells are 0.13, 0.034 and 0.049μM, respectively. Unlike previous fluorescent intensity qualitative
de-scriptions of endogens H2O2variation, this is the first time that H2O2production during a cell function has been directly quantified. According to the literature[21], exogenous 5μM H2O2 enhances tumor cell migration. Thus, we investigated if endogenous H2O2of one order lower level (0.1μM) generated under chemotaxis would associate with the capability of
cell migration.
To examine if the H2O2production is associated with cell migration in the 12 h period, a migration experiment was conducted parallel to quantifying H2O2with bi-module devicesin
serum-starved cells under serum-established chemotaxiscan produce H2O2, while the production of H2O2is associated with cell motility.
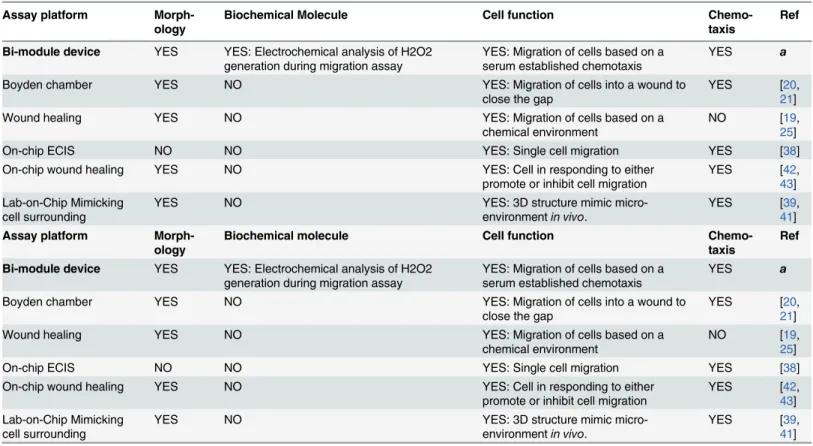
Next, a Boyden chamber assay was conducted side-by-side to quantify cell migration. The results demonstrate that cells loaded with different cell densities can develop cell migration under serum-established chemotaxis (S4 Fig). Comparing with standard Boyden chamber as-says, wound healing assay and previous reported on-chip cell migration platforms (Table 1), the bi-module device not only capable for study the morphology and functional changes of cells during cell migration, but monitor the generation of H2O2, an important reactive oxygen species having pathology and physiology significance.
Since cell motility is an important factor associated with tumor metastasis, we studied three types of tumor cells with bi-module devices. A375 cells are a well-recognized malignant
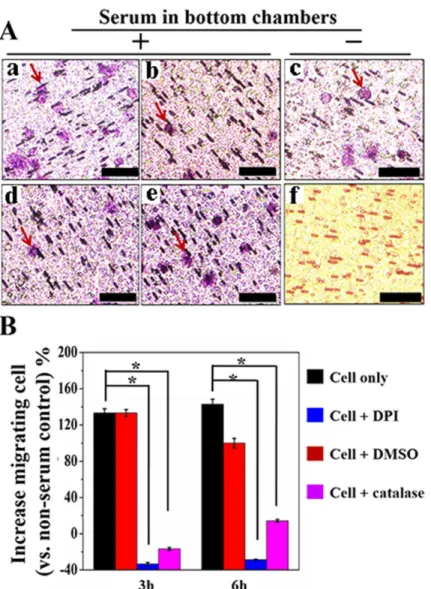
Fig 5. Cell migration quantified by hematoxylin and eosin (H&E) staining the polycarbonate membrane disassembled from device (A) photographs captured under microscopy: RPMI 1640 containing 10% serum in bottom chamber and serum-starved cells in top chamber (a), cells pre-treated by DPI (10μM) (b), cells pre-treated by catalase (5μg mL-1) (d), cells pre-treated by DMSO (0.5%, V/V) (e), serum-starved cells in a
device containing serum free medium in top and bottom chambers (c), and fresh polycarbonate membrane after (H&E) staining (f). Red arrow points the migrating cells. (B) histogram of migrating cell percentage using cells loaded in a device without serum in top and bottom chambers as a reference,*denotesp<0.01, n = 3.
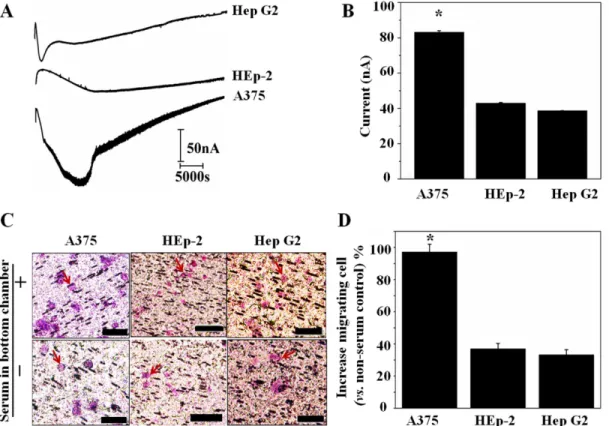
melanoma cell line. The HEp-2 cell line was originated from tumors, which were produced in irradiated-cortisonised weanling rats after injection of epidermoid carcinoma tissue isolated from the larynx of a male. Hep G2 cells are a human liver carcinoma cell line and a suitablein vitromodel system for the study of polarized human hepatocytes.Fig 6Apresents typical am-perometric signal traces of A375, HEp-2 and Hep G2 cells seeded in the upper chamber of bi-module device in which culture medium containing FBS was placed in the bottom chamber. The highest current value can be read at time point of 3.0, 4.0 and 1.5 h from the amperometric trace of A375, HEp-2 and Hep G2, respectively. And the maximum H2O2production induced amperometric signal is 84±2 nA for A375 cells, 43±1 nA for HEp-2 cells and 39 ±1 nA for Hep G2 cells (Fig 6B) and the corresponding H2O2concentration was 130±1.3 nM, 70±0.7 nM and 63±0.7 nM, respectively. The number of H2O2molecule produced per cell is 6.5×10¹⁰, 3.6×10¹⁰ and 3.2×10¹⁰for A375, HEp-2 and Hep G2 cell, respectively, calculating from the amperomet-ric signal according to literatures.[33,41] Comparing to PMA triggered H2O2production [33,41], the H2O2molecule produced per cell under serum established chemotaxis is one order smaller. In a parallel experiment, we examined the migrating cells by counting the purple-staining cells on the polycarbonate membrane of the device. As shown inFig 6C, more A375 cells can be observed from the H&E stained polycarbonate membrane. The average increased migrating cell of A375, HEp-2 and Hep G2 cells after 12 h incubation are 98±7%, 38±4% and 32±3%, respectively (Fig 6D). The quantitative analysis in Fig6Band6Dconfirms that a H2O2 production corresponds to cell motility.
Table 1. Performance comparison of bi-module device with standard biological migration assay and lab-on-chip migration assay.
Assay platform Morph-ology
Biochemical Molecule Cell function
Chemo-taxis
Ref
Bi-module device YES YES: Electrochemical analysis of H2O2 generation during migration assay
YES: Migration of cells based on a serum established chemotaxis
YES a
Boyden chamber YES NO YES: Migration of cells into a wound to
close the gap
YES [20,
21]
Wound healing YES NO YES: Migration of cells based on a
chemical environment
NO [19,
25]
On-chip ECIS NO NO YES: Single cell migration YES [38]
On-chip wound healing YES NO YES: Cell in responding to either
promote or inhibit cell migration
YES [42,
43] Lab-on-Chip Mimicking
cell surrounding
YES NO YES: 3D structure mimic
micro-environmentin vivo.
YES [39,
41] Assay platform
Morph-ology
Biochemical molecule Cell function
Chemo-taxis
Ref
Bi-module device YES YES: Electrochemical analysis of H2O2 generation during migration assay
YES: Migration of cells based on a serum established chemotaxis
YES a
Boyden chamber YES NO YES: Migration of cells into a wound to
close the gap
YES [20,
21]
Wound healing YES NO YES: Migration of cells based on a
chemical environment
NO [19,
25]
On-chip ECIS NO NO YES: Single cell migration YES [38]
On-chip wound healing YES NO YES: Cell in responding to either
promote or inhibit cell migration
YES [42,
43] Lab-on-Chip Mimicking
cell surrounding
YES NO YES: 3D structure mimic
micro-environmentin vivo.
YES [39,
41]
a: this work;
H&E: hematoxylin and eosin; ECIS: electrical cell−substrate impedance sensing; 3D: three dimension
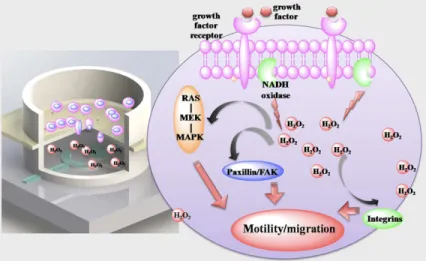
As characterized in supplementaryS5 Fig, CV response of serum-starved cell in serum-free RPMI 1640 and RPMI 1640 are nearly identical. While adding of serum (10% FBS) into the serum-free medium leads to a reduction peak current increasing, indicating that serum would induce production of H2O2from serum-starved cell. The phenomena is in line with docu-mented information that growth factors can stimulate NADPH oxidase leading to the produc-tion of H2O2.[53–55] The elevated endogenous H2O2might trigger the activation of ERK and FAK signalling transduction pathways. The phosphorylation of ERK and FAK can lead to en-hanced cell migration by activation downstream signalling proteins.[14,53,54] As illustrated inFig 7, by using this device, for the first time, we quantified the H2O2production in a trans-well cell migration setting. We anticipate the combination of electrochemical sensing with trans-well module can quantify other important biochemical moleculesin situ, providing key information for depicting the relationship between biochemical signalling and cell function.
Conclusions
Hydrogen peroxide is believed to modulate signalling pathways that control cell motility. How-ever, little is known about H2O2generation during the cell migration process. A novel bi-module device was fabricated to characterize H2O2productionin situwhile monitoring cell migration capability. For the first time, we quantified H2O2molecule generation from cells
Fig 6. Cell migration quantified by bi-module device.(A)in situamperometric signal of melanoma A375 cell, larynx HEp-2 cell and liver cancer Hep G2 cell seeded in device containing conditional medium (B) histogram of maximum current signal during 12h of cells; (C) H&E staining of migrating A375, Hep G2 and HEp-2 cells; (D) histogram of increased migrating cell percentage using cells loaded in a device without serum in bottom chamber as a reference,* denotesp<0.05, n = 3.
under a serum established chemotaxis is ~6.5×10¹⁰per melanoma A375 cells, ~3.6×10¹⁰per liver carcinoma Hep G2 cells and ~3.2×10¹⁰per larynx carcinoma HEp-2 cells. In addition, a parallel migration assay with H2O2generation inhibitor and decomposer demonstrated that the H2O2generation is associated to cell migration. The bi-module cell migration platform en-ablesin situinvestigation for monitoring H2O2production and cell function simultaneously, highlighting its potential for characterizing cell motility through monitoring cell secretion with rare samples and for investigation of mechanism of cell migration.
Supporting Information
S1 Fig. Cyclic voltammetric curves scanned at different time point.The electrochemical sen-sor was immersed in a cell culture medium for 24 h. At 0, 12, 18 and 24 h, 4μM H2O2was added into the cell culture medium and the cyclic voltammetric (CV) curve was recorded. Then the increase of reduction peak current (Δcurrent) was compared.
(TIF)
S2 Fig. Amperometric performance of electrode at different potential.The amperometric response of functionalized electrode at an applied potential of -0.3, -0.4, -0.45 and -0.5VvsITO reference electrode/counter electrode (RE/CE) in responding to successive addition of
4μMH2O2into RPMI 1640. (TIF)
S3 Fig. MTT cell growth assay.Melanoma A375 cells was seed in 96-well microplate (1×10⁴ cell per well). DPI (10μM), catalase (5μg mL-1) or DMSO (0.5%, V/V) were used to treat cells
for 24 h. Then, 10μL MTT solution was added to every well and incubated for 3 h. The
purple-coloredformazan products converted by viable cells were dissolved and measured using a spec-trophotometric microplate reader (ELx800t, Gene Company) at 540 nm. The experiment was performed three independent times in triplicates.
(TIF)
S4 Fig. Boyden chamber migration assay.Hematoxylin and eosin staining of migrating A375 examined in a Boyden chamber assay. Different concentration of cell suspensions was seed in the upper chamber and incubated for 24 h. The results were quantified using migrating cell
Fig 7. Bi-module device canin situdetects the generation of biochemical molecules in the process of cell migration.
counted in an assay without serum in the bottom chamber as a reference. (TIF)
S5 Fig. H2O2production from serum-starved cells by direct serum stimulation.Melanoma A375 cells were serum-starved for 8 h and then collected. RPMI 1640 medium was placed in the PDMS chamber and CV response was recorded. Then serum-starved cell (4×10⁵) was pi-petted into the chamber. After 10 min, the CV response was recorded. Finally, serum (10% FBS) was added into the chamber. The CV response was recorded after 30 min incubation. (TIF)
Acknowledgments
We thank Dr. Yuan Li (Chongqing Medical University) for providing cell line Hep G2 and HEp-2. This work is financially supported by Chongqing Key Laboratory for Advanced Materi-als and Technologies of Clean Energies, Start-up grant under SWU111071 from Southwest University, the National Science Foundation of China (No. 31200700,21375108), and Chong-qing Key Natural Science Foundation (cstc2014jcyjA10070).
Author Contributions
Conceived and designed the experiments: LY YLT. Performed the experiments: YLT AXG. An-alyzed the data: YLT ZZS. Contributed reagents/materials/analysis tools: LY YLT CML. Wrote the paper: LY YSL. Obtained permission for use of cell line: LZ.
References
1. Lauffenburger DA, Horwitz AF. (1996) Cell migration: a physically integrated molecular process. Cell. 84(3):359–69. PMID:8608589
2. Lauffenburger DA. Cell motility. (1996) Making connections count. Nature. 383(6599):390–1. PMID: 8837766
3. Stroka KM, Konstantopoulos K. (2014) Physical biology in cancer. 4. Physical cues guide tumor cell ad-hesion and migration. Am J Physiol Cell Physiol. 306(2):C98–C109. doi:10.1152/ajpcell.00289.2013 PMID:24133064
4. Bravo-Cordero JJ, Magalhaes MA, Eddy RJ, Hodgson L, Condeelis J. (2013) Functions of cofilin in cell locomotion and invasion. Nat Rev Mol Cell Biol. 14(7):405–15. doi:10.1038/nrm3609PMID:23778968 5. Bouvard D, Pouwels J, De Franceschi N, Ivaska J. (2013) Integrin inactivators: balancing cellular
func-tions in vitro and in vivo. Nat Rev Mol Cell Biol. 14(7):430–42. doi:10.1038/nrm3599PMID:23719537 6. Schwartz MA, Horwitz AR. Integrating adhesion, protrusion, and contraction during cell migration.
(2006) Cell. 125(7):1223–5. PMID:16814706
7. Kohn EC, Liotta LA. (1993) Invasion and metastasis: new approaches to an old problem. Oncology (Williston Park). 7(4):47–52. PMID:8485035
8. Entschladen F, Drell TLt, Lang K, Joseph J, Zaenker KS. (2004) Tumour-cell migration, invasion, and metastasis: navigation by neurotransmitters. Lancet Oncol. 5(4):254–8. PMID:15050959
9. Polacheck WJ, Zervantonakis IK, Kamm RD. (2013) Tumor cell migration in complex microenviron-ments. Cell Mol Life Sci. 70(8):1335–56. doi:10.1007/s00018-012-1115-1PMID:22926411 10. Dinic J, Ashrafzadeh P, Parmryd I. (2013) Actin filaments attachment at the plasma membrane in live
cells cause the formation of ordered lipid domains. Biochim Biophys Acta. 1828(3):1102–11. doi:10. 1016/j.bbamem.2012.12.004PMID:23246974
11. Jiang Q, Zhou C, Bi Z, Wan Y. (2006) EGF-induced cell migration is mediated by ERK and PI3K/AKT pathways in cultured human lens epithelial cells. J Ocul Pharmacol Ther. 22(2):93–102. PMID: 16722795
13. Chen YJ, Tsai RK, Wu WC, He MS, Kao YH, Wu WS. (2012) Enhanced PKCdelta and ERK signaling mediate cell migration of retinal pigment epithelial cells synergistically induced by HGF and EGF. PloS one. 7(9):e44937. doi:10.1371/journal.pone.0044937PMID:23028692
14. Liu LZ, Hu XW, Xia C, He J, Zhou Q, Shi X, et al. (2006) Reactive oxygen species regulate epidermal growth factor-induced vascular endothelial growth factor and hypoxia-inducible factor-1alpha expres-sion through activation of AKT and P70S6K1 in human ovarian cancer cells. Free Radic Biol Med. 41 (10):1521–33. PMID:17045920
15. Lee DJ, Kang SW. (2013) Reactive oxygen species and tumor metastasis. Mol Cells. 35(2):93–8. doi: 10.1007/s10059-013-0034-9PMID:23456330
16. Usatyuk PV, Fu P, Mohan V, Epshtein Y, Jacobson JR, Gomez-Cambronero J, et al. (2014) Role of c-Met/PI3k/Akt Signaling in HGF-mediated Lamellipodia Formation, ROS Generation and Motility of Lung Endothelial Cells. J Biol Chem. 289(19):13476–91. doi:10.1074/jbc.M113.527556PMID:24634221 17. Hung WY, Huang KH, Wu CW, Chi CW, Kao HL, Li AF, et al. (2012) Mitochondrial dysfunction
pro-motes cell migration via reactive oxygen species-enhanced beta5-integrin expression in human gastric cancer SC-M1 cells. Biochim Biophys Acta. 1820(7):1102–10. doi:10.1016/j.bbagen.2012.04.016 PMID:22561002
18. Wang Y, Zang QS, Liu Z, Wu Q, Maass D, Dulan G, et al. (2011) Regulation of VEGF-induced endothe-lial cell migration by mitochondrial reactive oxygen species. Am J Physiol Cell Physiol. 301(3): C695–704. doi:10.1152/ajpcell.00322.2010PMID:21653897
19. Im YS, Ryu YK, Moon EY. (2012) Mouse Melanoma Cell Migration is Dependent on Production of Re-active Oxygen Species under Normoxia Condition. Biomol Ther. 20(2):165–70. doi:10.4062/ biomolther.2012.20.2.165PMID:24116290
20. Tobar N, Guerrero J, Smith PC, Martinez J. (2010) NOX4-dependent ROS production by stromal mam-mary cells modulates epithelial MCF-7 cell migration. Br J Cancer. 103(7):1040–7. doi:10.1038/sj.bjc. 6605847PMID:20717118
21. Polytarchou C, Hatziapostolou M, Papadimitriou E. (2005) Hydrogen peroxide stimulates proliferation and migration of human prostate cancer cells through activation of activator protein-1 and up-regulation of the heparin affin regulatory peptide gene. J Biol Chem. 280(49):40428–35. PMID:16199533 22. Luanpitpong S, Talbott SJ, Rojanasakul Y, Nimmannit U, Pongrakhananon V, Wang L, et al. (2010)
Regulation of lung cancer cell migration and invasion by reactive oxygen species and caveolin-1. J Biol Chem. 285(50):38832–40. doi:10.1074/jbc.M110.124958PMID:20923773
23. DeGennaro M, Hurd TR, Siekhaus DE, Biteau B, Jasper H, Lehmann R. (2011) Peroxiredoxin stabiliza-tion of DE-cadherin promotes primordial germ cell adhesion. Dev Cell. 20(2):233–43. doi:10.1016/j. devcel.2010.12.007PMID:21316590
24. Wu WS, Tsai RK, Chang CH, Wang S, Wu JR, Chang YX. (2006) Reactive oxygen species mediated sustained activation of protein kinase C alpha and extracellular signal-regulated kinase for migration of human hepatoma cell Hep G2. Mol Cancer Res. 4(10):747–58. PMID:17050668
25. Basuroy S, Dunagan M, Sheth P, Seth A, Rao RK. (2010) Hydrogen peroxide activates focal adhesion kinase and c-Src by a phosphatidylinositol 3 kinase-dependent mechanism and promotes cell migration in Caco-2 cell monolayers. Am J Physiol Gastrointest Liver Physiol. 299(1):G186–95. doi:10.1152/ ajpgi.00368.2009PMID:20378826
26. Pan Q, Qiu WY, Huo YN, Yao YF, Lou MF. (2011) Low levels of hydrogen peroxide stimulate corneal epithelial cell adhesion, migration, and wound healing. Invest Ophthalmol Vis Sci. 52(3):1723–34. doi: 10.1167/iovs.10-5866PMID:21087961
27. Sadok A, Bourgarel-Rey V, Gattacceca F, Penel C, Lehmann M, Kovacic H. (2008) Nox1-dependent superoxide production controls colon adenocarcinoma cell migration. Biochim Biophys Acta. 1783 (1):23–33. PMID:18023288
28. Lee ER, Kim JH, Kang YJ, Cho SG. (2007) The anti-apoptotic and anti-oxidant effect of eriodictyol on UV-induced apoptosis in keratinocytes. Biol Pharm Bull. 30(1):32–7. PMID:17202655
29. Peus D, Vasa RA, Meves A, Pott M, Beyerle A, Squillace K, et al. (1998) H2O2is an important mediator
of UVB-induced EGF-receptor phosphorylation in cultured keratinocytes. J Invest Dermatol. 110 (6):966–71. PMID:9620307
30. Achyuta AK, Stephens KD, Lewis HG, Murthy SK. (2010) Mitigation of reactive human cell adhesion on poly(dimethylsiloxane) by immobilized trypsin. Langmuir. 26(6):4160–7. doi:10.1021/la903441u PMID:20214394
32. Grisham MB. (2013) Methods to detect hydrogen peroxide in living cells: Possibilities and pitfalls. Comp Biochem Physiol A Mol Integr Physiol. 165(4):429–38. doi:10.1016/j.cbpa.2013.02.003PMID: 23396306
33. Guo CX, Zheng XT, Lu ZS, Lou XW, Li CM. (2010) Biointerface by cell growth on layered graphene-arti-ficial peroxidase-protein nanostructure for in situ quantitative molecular detection. Adv Mater. 22 (45):5164–7. doi:10.1002/adma.201001699PMID:20878626
34. Lahdesmaki I, Park YK, Carroll AD, Decuir M, Ruzicka J. (2007) In-situ monitoring of H2O2degradation
by live cells using voltammetric detection in a lab-on-valve system. Analyst. 132(8):811–7. PMID: 17646881
35. Manning P, McNeil CJ. (2011) Electrochemical and optical sensing of reactive oxygen species: path-way to an integrated intracellular and extracellular measurement platform. Biochem Soc Trans. 39 (5):1288–92. doi:10.1042/BST0391288PMID:21936803
36. Yu L, Gao LX, Ma XQ, Hu FX, Shi ZZ, Li CM, Lu ZS. (2014) Involvement of Superoxide and Nitric Oxide in BRAFV600E Inhibitor PLX4032-induced Cell Growth Inhibition of Melanoma Cells. Integr Biol-UK, 6 (12): 1211–1217 doi:10.1039/c4ib00170bPMID:25363644
37. Rabinowitz JD, Vacchino JF, Beeson C, McConnell HM. (1998) Potentiometric Measurement of Intra-cellular Redox Activity. J Am Chem Soc, 120: 2464–2473
38. Eklund SE, Snider RM, Wikswo J, Baudenbacher F, Prokop A, Cliffel DE. (2006) Multianalyte microphy-siometry as a tool in metabolomics and systems biology. J Electroanal Chem, 587(2):333–339 39. Eklund SE, Cliffel DE, Kozlov E, Prokop A, Wikswo J, Baudenbacher F. (2003) Modification of
Cytosen-sorTMmicrophysiometer to simultaneously measure extracellular acidification and oxygen consumption
rates. Anal Chim Acta, 496 (1–2): 93–101
40. Snider RM, Ciobanu M, Rue AE, Cliffel DE. (2008) A multiwalled carbon nanotube/dihydropyran com-posite film electrode for insulin detection in a microphysiometer chamber. Anal Chim Acta, 609 (1): 44–52 doi:10.1016/j.aca.2007.12.032PMID:18243872
41. Shi ZZ, Wu XS, Gao LX, Tian YL, Yu L. (2014) Electrodes/paper sandwich devices for in situ sensing of hydrogen peroxide secretion from cells growing in gels-in-paper 3 dimensional matrix. Anal Meth. 6 (12):4446–54.
42. Nguyen TA, Yin TI, Reyes D, Urban GA. (2013) Microfluidic chip with integrated electrical cell-impedance sensing for monitoring single cancer cell migration in three-dimensional matrixes. Anal Chem. 85(22):11068–76. doi:10.1021/ac402761sPMID:24117341
43. Zervantonakis IK, Hughes-Alford SK, Charest JL, Condeelis JS, Gertler FB, Kamm RD. (2012) Three-dimensional microfluidic model for tumor cell intravasation and endothelial barrier function. Proc Natl Acad Sci U S A. 109(34):13515–20. doi:10.1073/pnas.1210182109PMID:22869695
44. Li J, Lin F. (2011) Microfluidic devices for studying chemotaxis and electrotaxis. Trends Cell Biol. 21 (8):489–97. doi:10.1016/j.tcb.2011.05.002PMID:21665472
45. Jeong GS, Kwon GH, Kang AR, Jung BY, Park Y, Chung S, et al. (2011) Microfluidic assay of endotheli-al cell migration in 3D interpenetrating polymer semi-network HA-Collagen hydrogel. Biomed Microde-vices. 13(4):717–23. doi:10.1007/s10544-011-9541-7PMID:21494794
46. van der Meer AD, Vermeul K, Poot AA, Feijen J, Vermes I. (2010) A microfluidic wound-healing assay for quantifying endothelial cell migration. Am J Physiol Heart Circ Physiol. 298(2):H719–25. doi:10. 1152/ajpheart.00933.2009PMID:19933413
47. Nie FQ, Yamada M, Kobayashi J, Yamato M, Kikuchi A, Okano T. (2007) On-chip cell migration assay using microfluidic channels. Biomaterials. 28(27):4017–22. PMID:17583787
48. Wang X, Osada T, Wang Y, Yu L, Sakakura K, Katayama A, et al. (2010) CSPG4 protein as a new tar-get for the antibody-based immunotherapy of triple-negative breast cancer. J Natl Cancer Inst. 102 (19): 1496–1512 doi:10.1093/jnci/djq343PMID:20852124
49. Park WH. (2013) The effects of exogenous H2O2on cell death, reactive oxygen species and glutathione
levels in calf pulmonary artery and human umbilical vein endothelial cells. Int J Mol Med. 31(2):471–6. doi:10.3892/ijmm.2012.1215PMID:23254439
50. Park SE, Song JD, Kim KM, Park YM, Kim ND, Yoo YH, et al. (2007) Diphenyleneiodonium induces ROS-independent p53 expression and apoptosis in human RPE cells. FEBS Lett 581(2):180–6. PMID: 17184774
51. Li N, Ragheb K, Lawler G, Sturgis J, Rajwa B, Melendez JA, et al. (2003) DPI induces mitochondrial su-peroxide-mediated apoptosis. Free Radic Biol Med. 34(4): 465–77. PMID:12566072
53. Bae YS, Sung JY, Kim OS, Kim YJ, Hur KC, Kazlauskas A, et al. (2000) Platelet-derived growth factor-induced H2O2production requires the activation of phosphatidylinositol 3-kinase. J. Biol. Chem. 275
(14):10527–31. PMID:10744745
54. Bae YS, Kang SW, Seo MS, Baines IC, Tekle E, Chock PB, et al. (1997) Epidermal growth factor (EGF)-induced generation of hydrogen peroxide. Role in EGF receptor-mediated tyrosine phosphoryla-tion. J. Biol. Chem. 272(1):217–21. PMID:8995250