CAROLINA FILARDI DE CAMPOS
GENOMIC SELECTION FOR BOAR TAINT AND CARCASS TRAITS IN A COMMERCIAL PIG LINE
Dissertação apresentada à Universidade Federal de Viçosa, como parte das exigências do Programa de
Pós-Graduação em
Zootecnia, para obtenção do título de Magister Scientiae.
VIÇOSA
Ficha catalográfica preparada pela Seção de Catalogação e Classificação da Biblioteca Central da UFV
T
Campos, Carolina Filardi de, 1986-
C198g Genomic selection for boar taint and carcass traits in a 2012 commercial pig line / Carolina Filardi de Campos. – Viçosa,
MG, 2012.
viii, 37f. : il. ; 29cm.
Inclui apêndice.
Orientador: Simone Eliza Facioni Guimarães
Dissertação (mestrado) - Universidade Federal de Viçosa. Inclui bibliografia.
1. Suíno - Melhoramento genético. 2. Suíno - Seleção. 3. Genômica. 4. Genética molecular. 5. Marcadores
genéticos. 6. Suíno - Genética. I. Universidade Federal de Viçosa. II. Título.
CAROLINA FILARDI DE CAMPOS
GENOMIC SELECTION FOR BOAR TAINT AND CARCASS TRAITS IN A COMMERCIAL PIG LINE
Dissertação apresentada à Universidade Federal de Viçosa, como parte das exigências do Programa de
Pós-Graduação em
Zootecnia, para obtenção do título de Magister Scientiae.
APROVADA: 23 de Julho de 2012.
______________________________ __________________________ Prof. Fabyano Fonseca e Silva Prof.Eliane Gasparino
(Coorientador)
__________________________________________ Prof. Simone Eliza Facioni Guimarães
ii “A gratidão é o único tesouro dos humildes.”
iii AGRADECIMENTOS
A Deus e à Nossa Senhora Aparecida, por me darem tamanha fé, para enfrentar todos os momentos.
À Universidade Federal de Viçosa e ao Departamento de Zootecnia, pela oportunidade.
À Fundação de Amparo à Pesquisa do Estado de Minas Gerais, pela bolsa de estudos.
Ao Institute for PigGenetics (IPG) pelo fornecimento dos dados.
À minha orientadora professora Simone E.F. Guimarães, pela amizade, paciência e atenção dedicadas a mim, oportunidades dadas e pela confiança desde a graduação.
Ao meu coorientador professor Fabyano Fonseca e Silva, por toda a ajuda e suporte, amizade e é claro pelas horas e horas destinadas às rotinas eanálises. Ao meu coorientador professor Paulo Sávio Lopes, pela supervisão e ensinamentos.
À professora Eliane Gasparino, pela participação na banca de defesa.
Aos professores Robledo de Almeida Torres e Ricardo Frederico Euclydes pela amizade e junto com os demais fazerem do Melhoramento uma grande família. Aos amigos do Labtecpela companhia, troca de experiências, convivência e bons momentos, especialmente à Renata por ajudar em tudo que precisei. Aos amigos do Melhoramento pelas conversas, companheirismo, momentos de diversão e risos.
Aos funcionários e estagiários da Granja de Melhoramento de Suínos pela ajuda, aprendizagem e amizade.
Aos amigos de Viçosa e de Barbacena por contribuírem para o meu crescimento pessoal.
À minha família, em especial às mulheres da minha vida: Mãe-avó, Mami, Tati, Fá e Duda por serem meu alicerce, pelo amor e apoio de sempre. Ao meu amado Pai que junto com meu avós, me iluminam de onde estão. Aos meus cunhados de cá e de lá e meus sogros pelo carinho, incentivo e torcida. Aos meus tios e primos, de sangue e de coração que acreditaram que eu seria capaz.
iv BIOGRAFIA
Carolina Filardi de Campos, filha de José Jovelino Amâncio Campos e Enilce Maria Filardi de Campos, nascida em 12 de Agosto de 1986, em Barbacena, Minas Gerais, Brasil.
v SUMÁRIO
RESUMO...vi
ABSCTRACT...viii
CAPÍTULO1...1
INTRODUÇÃO...2
REVISÃO ...3
REFERÊNCIAS...9
CAPÍTULO 2 ...15
GENOMIC SELECTION FOR BOAR TAINT AND CARCASS TRAITS IN A COMMERCIAL PIG LINE………...……….……….16
vi RESUMO
CAMPOS, Carolina Filardi de, M.Sc. Universidade Federal de Viçosa, Julho de 2012. Seleção genômica para características relacionadas ao odor da carne e características de carcaça em uma linhagem comercial de suínos.Orientadora: Simone Eliza Facioni Guimarães. Co-orientadores: Fabyano Fonseca e Silva e Paulo Sávio Lopes.
viii ABSTRACT
CAMPOS, Carolina Filardi de, M.Sc. Universidade Federal de Viçosa, July 2012. Genomic selection for boar taint and carcass traits in a commercial pig line.Adviser: Simone Eliza Facioni Guimarães. Co-advisers: Fabyano Fonseca e Silva and Paulo Sávio Lopes.
2 1. INTRODUCTION
Traditional genetic breeding, using information on phenotypes and pedigrees to predict breeding values, has been used over the years successfully. In contrast, the marker-assisted selection (MAS) emerged with the aim of improving accuracy of these values, but implementation has been limited and increases in genetic gain have been small (Dekkers 2004). Trying to solve some problems as the fact that the polygenic effect depends on the linkage disequilibrium and on the confidence interval of the QTL,Meuwissen et al. (2001) proposed a different approach, the genomic selection. One justification for molecular genetics research on livestock and crop species is the expectation that information at the DNA level will lead to faster genetic gain than that achieved,based on phenotypic data only.
Genomic selection refers to selection decisions based on estimated genomic breeding values (GEBVs) which are calculated as the sum of the effects of genetic dense markers or haplotypes of these markers in the whole genome, trying to capture all the quantitative trait loci (QTL) contributing to the variation of the characteristic (Hayes & Goddard, 2008).The large number of markers required and the cost of genotyping were the limitations to genomic selection (Goddard & Hayes, 2007), but nowadays these problems are solved as most species have thousands of single nucleotide polymorphisms (SNP) genotyped. In the pig, for instance, significant progress on genetics and genomics research has been achieved in recent years due to the integration of advanced molecular biology techniques, bioinformatics and computational biology, and the collaborative efforts of researchers in the swine genomics community (Fan et al., 2011).
3 subsequently be used to calculate GEBVs of selection candidates (Meuwissen et al., 2001).
According to Soldberg et al. (2009) several methods have been suggested to estimate marker effects in the prediction of the estimated genomic breeding values for Genomic Selection like ridge regression BLUP (RR-BLUP) and Bayesian methods, in which a separate variance is estimated for each marker, andthe variances are assumed to follow a specified prior distribution(Meuwissen et al., 2001).
2. REVIEW
2.1 Carcass traits
Carcass traits are very important for the development of pig industry, especially those related to higher meat yield and lower fat deposition(Pires et al., 2006). Taking this into account, several studies were developed with the aim of identifying QTL related to carcass traits in pigs(Vidal et al., 2005; Stearns et al., 2005, Silva et al., 2009).
Due to the large number of carcass traits such as backfat thickness in different regions, quality prime cuts (depth and loin eye area), classification systems and others, the direct application of multivariate models for QTL detection can be frustrated due to convergence problems (singularity of matrices of (co) variances of random effects) and interpretation of results.Therefore, multivariate methods related to the size reduction of the number of variables present as an important statistical tool forencourage the analysis of QTL. Two of these techniques have been used successfully for detection of QTL in pigs: major components(Stearns et al., 2005) and factor analysis (Silva et al., 2009).
2.2 Boar taint traits
4 with castrated males, which could result in significant economic gains for producers(Lundström et al., 2009).In addition, several European Union countries will ban surgical castration in the coming years (even with anesthesia) and some of the leading traders in the Netherlands have decided not to sell meat from barrows(Squires &Schenkel, 2010).
Two promising alternatives to deal with boar taint is the use of an immunocastration vaccine (Pauly et al., 2009) and the use of genetic markers to select pigs which have reduced propensity to produce sexual odor(Varona et al. 2005, Moe et al. 2009, Duijvesteijn et al., 2010).
2.3 Pig Breeding
Pork is the most consumed meat in the world, rich in essential nutrients, contributing to achieving a balanced diet. It has softness and flavor characteristics, and a source of vitamins and minerals, but also of proteins of high biological value (as it has all the essential amino acids) and high digestibility (MAGNONI, 2007). In Brazil, the pork industry has undergone numerous advances in recent years. Technologies such as artificial insemination, breeding, biosecurity, health, nutrition, among others, have been increasingly incorporated in pig farms, contributing to the growth of the herd and increase productivity (Miele, 2007). The Brazilian pork market is very important for economic and social development of many cities, generating jobs in the field, in industry, trade and services besides the fact that the country is the fourth largest world exporter(http://www.abipecs.org.br)(2012).Moreover, the wide variety of products originated from pigs and used in human medicine, and especially the use of organs such as skin and heart valves for transplantation, should be interpreted as a result of the similarity between human and pigorganisms.
5 In contrast of the use of phenotypes for selection of the individuals, many theoreticalstudies have been conducted over the past severaldecades to evaluate strategies for the use of moleculargenetic information in selection programs. Theextra responses to selection have resulted in great optimism for the use ofmolecular genetic information in industry breedingprograms (Dekkers, 2004). The marker-assisted selection was initiated and was the first tool proposed for the inclusion of information from some major genes or QTLs in non-biased linear prediction (BLUP) of breeding values(Lund et al., 2009).
Thus, it became possible to add functional genomics to a range of options available for understanding the molecular basis of pork quality. With the marker associated with variation in the trait of interest, it can be used for pre-selection of young animals prior to performance testing(Plastow et al., 2005).
2.4 Genomic Selection
The selection for quantitative traits of economic importance in animals and plants is traditionally based on phenotypic measures of the individual and their relatives(Meuwissen et al., 2001).Breeding values, based on these phenotypic data, are commonly calculated by non-biased linear prediction (BLUP, Henderson 1984).The inclusion of marker information into BLUP for breeding values was demonstrated by Fernando and Grossman (1989) and was predicted to provide 8-38% extra genetic gain (Meuwissen and Goddard, 1996).
Whereas DNA polymorphisms are the sources of variation in genetic merit, SNP markers in linkage disequilibrium with QTLcan be used as additional criteria for identifying individuals who are candidates for selection, which would increase the accuracy in genetic evaluation.
6 identification of QTL, which according to Dekkers(2004) presents several practical problems, but rather to assist and directly improve the prediction of breeding value for traits of interest. This approach has become feasible due to the large number of SNPs discovered by genome sequencing and new methods to efficiently genotype a large number of SNPs (Goddard, 2009).These markers in disequilibrium with the QTL, presenting both large and small effects, explain almost the entire genetic variation of a quantitative character (Resende et al., 2008).
Meuwissen et al. (2001) proposed a variant of MAS called genomic selection. The key features of this method are that markers covering the whole genome are used so that potentially all the genetic variance is explained by markers. Predictions using genomic selection are based on associations between markers and not for pedigree information, the requirement to have phenotypes in the selection candidates or their close relatives is diminished and a breeding value can be obtained byavailable genotypes(Lund et al., 2009).This is also excellent for characters of low heritability (Resende et al., 2008).
2.5 Methods for genomic selection
The challenge of genomic selection is to identify the most powerful statistical method to predict phenotype values through markers effect estimates. Up until now several studies (Moser et al., 2009; Heslot et al., 2012) have been conducted in order to compare the efficiency of simple methods, like the RR-BLUP (Random Regression BLUP) proposed by Meuwissen et al. (2001), with most sophisticated ones, like Bayesian LASSO (BL) proposed by de los Campos et al. (2009).
The main difference between these two very popular methods for genomic selection is that the first assumes a priori that all loci explain an equal amount of genetic variation, while the second assume that each locus explains its own amount of variation.
7 ∑
where is the general mean, is the effect of marker k and isthe residual term, .In this model, is the indicator function that take the values 1, 0, -1 for the SNP genotypes AA, Aa and aa at each loci, respectively. In this method,which is considered a random marker effect, assumingthat (i.e. all loci explain an equal amount of the genetic variation). This method can be implemented in the R software (R Development Core Team, 2011) by package rrBLUP (Endelman, 2011) using the function mixed.solve, which solves a mixed model equation of the form:
[ [ ] ] [ ̂ ̂] [ ]
where ∑
is the vector of genomic breeding values. Thus,
admitting the additive genetic variance is given by ∑ (Habier et al., 2007) it is demonstrated that:
( ∑ ) ∑ ∑ ∑ ∑
being the so called genomic relationship matrix. In this way, it is possible to work under the well-known Henderson’s mixed model equation using REML (Henderson,1984) estimation method, and the heritability calculated
directly by ⁄ .
Since ̂ ∑ ̂
̂with [ | | | ] and ̂
[ ̂ ̂ ̂ ] the estimated marker effects vector can be obtained
by the simple normal equation system ̂ ̂ .
8 are more markers (covariates) than observations. An interesting approach is the use of the LASSO(Least Absolute Shrinkage and Selection Operator) regression method, which combines good features of subset-selection (i.e., variable subset-selection) and regularization via shrinkage of the regression coefficients. This method was applied in GWS by de los Campos et al. (2009) and ever since, the success of this methodology has been reported by de los Campos et al. (2009) and Mutshinda&Sillanpää (2010).
The Bayesian LASSO method (de los Campos et al. 2009), which is a more general method, because allows assuming that each locus explains its own amount of this variation, and furthermore, has been used to solve multicollinearity problems and may also be used to work in situations where there are more markers (covariates) than observations. The Bayesian LASSO is a penalized Bayesian regression procedure, whose generalestimator is given by ̂ { ̂ ̂ ∑ | |} , where is the regularization parameter. When = 0 there is no regularization, and when > 0 there is a shrinkage of the marker effects toward zero with the possibility of setting some identically equal to zero, resulting in a simultaneous estimation and variable selection procedure. The package BLR (de los Campos et al., 2009; Pérez et al., 2010) of R software was used,which assumes that the joint prior distribution of marker effects is ∏ ( ), being , where is the residual variande, with scale inverse prior distribution, and the scale parameter related to each marker. In turn, the BLR assumes also that the joint prior distribution for the scale parameters is the product of Exponential distributions,∏ , and the prior distribution is Gamma(ν1, ν2).
9 These estimates and the mean ̂ were obtained using the BLR package (Bayesian Linear Regression) available in the R software (R Development Core Team, 2011). The Bayesian implementation of LASSO regression contained in this package was adapted for genomic selection by de los Campos et al. (2010).
2.6 Cross-validation
The technique of Jack-knife consists on dividing the training population, which have marker and phenotype information for all the individuals (Resende et al., 2010), in different validation sets each time without the phenotype of a specific individual. In these analyses, the predicted genomic breeding value of animal can be calculated by ̂ ̂ , where denotes the SNP genotype vector of animal and ̂ denotes
the estimated marker effects vector from the analysis that considered all animals, except the animal . The vector containing all predicted values is ̂ [ ̂ ̂ ] ,and the accuracy ) used to measure the efficiency of
RR-BLUP and BL was given by ̂⁄√ , where ̂ is the correlation
between observed phenotype and ̂, and is the estimated heritability from fitting each method to the full dataset.
3. REFERENCES
Associação Brasileira da Indústria Produtora e Exportadora de carne suína -http://www.abipecs.org.br.
Dekkers, J.C M. 2004. Commercial applications of marker-and gene-assisted selection in livestock:Strategies and lessons.Journal of .Animal Science.82(E.Suppl.)E313-E328.
10 de Los Campos, G.; Rodriguez, P.P. 2010.BLR: Bayesian Linear Regression. R package version 1.2.http://CRAN.R-project.org/package=BLR
de Los Campos, G.; Naya, H.; Gianola, D.; Crossa, J.; Legarra, A.; Manfredi, E.; Weigel, K.; Cotes, J. M. 2009.Predicting quantitative traits with regression models for dense molecular markers. Genetics.182: 375-385.
Duijvesteijn, N.;Knol, E.;Merks, J.;Crooijmans, R.; Groenen, M.; Bovenhuis, H.; Harlizius, B. 2010.A genome-wide association study on androstenone levels in pigs reveals a cluster of candidate genes on chromosome 6. BMC Genetics, 20:11-42.
Endelman, J.B. 2011.Ridge regression and other kernels for genomic selection with R package rrBLUP. Plant Genome.4:250-255.
Fan, B.;Gorbach, D.M.; Rothschild, M.F. 2011.The Pig Genome Project has plenty to squeal about. Cytogenetic and genome research. 134:9-18.
Fernando R.L. and Grossman M. 1989.Marker-assisted selection using best linear unbiased prediction. Genetic Selection and Evolution.21:467-470.
Goddard M. 2009.Genomic selection: prediction of accuracy and maximization of long term response. Genetica.136:245–257.
Goddard, M. E., Hayes, B. J. 2007. Genomic selection. Journal of Animal Breeding and Genetics.124:323-330.
11 Hayes, B.J. and Goddard, M.E. 2008.Technical note: Prediction of breeding values using marker derived relationship matrices. Journal of Animal Science. 86: 2089–2092.
Henderson, C. R. 1984. Applications of Linear Models in Animal Breeding.University of Guelph, Guelph, ON, Canada.
Heslot, N.; Yang,H.P.; Sorrells,M.E.; Jannink,J.L. 2012.Genomic selection in plant breeding: A comparison of models. Crop Science. 52:146–160.
Lund, M.S.; Sahana, G.; de Koning, D.; Su, G.; Carlborg, Ö. 2009. Comparison of analyses of the QTLMAS XII common dataset. I: Genomic selection. BMC Proceedings. 3(Suppl 1):S1.
Lundström, K.; Matthews,K.R.; Haugen,J-E. 2009.Pig meat quality from entire males Animal. InternationalJournalof Animal Bioscience. 3,1497-1507.
Magnoni, D.; Pimentel, I. 2007. A importância da carne suína na nutrição humana. UNIFEST.
Meuwissen T.H.E., Hayes B.J., Goddard M.E. 2001.Prediction of total genetic value using genome-wide dense marker maps.Genetics.157:1819–1829.
Meuwissen, T. H.E. and Goddard.M. E. 1996. The use of marker haplotypes in animal breeding schemes .Genetic Selection and Evolution.28: 161-176.
Miele, M.2007. Cadeia produtiva da carne suína no Brasil. EMBRAPA
12 Moe, M.; Lien, S.; Aasmundstad, T.; Meuwissen, T.H.E.; Hansen, M.H.S.; Bendixen, C.; Grindflek, E. 2009.Association between SNPs within candidate genes and compounds related to boar taint and reproduction. BMCGenomics.10:32.
Moser, G.; Tier,B.; Crump, R.E.;Khatkar,M.S;Raadsma, H.W. 2009.A comparison of five methods to predict genomic breeding values of dairy bulls from genome-wide SNP markers. Genetics Selection Evolution.41:56.
Mutshinda, C. M. &Sillanpää, M. J. 2010.Extended Bayesian LASSO for multiple quantitative trait loci mapping and unobserved phenotype prediction.Genetics.186:1067-75.
Pauly, C.; Spring, P.;O’doherty, V., Ampuero K.S.; Bee, G. 2009.Growth Performance, carcass characteristics and meat quality of group-penned surgically castrated, immunocastrated (Improvac®) and entire male pigs and individually penned entire male pigs.Animal. 7:1057 – 1066.
PlastowG.S.; Carrión D.; Gil M.; García-Regueiro J.A.; Font i M;. Furnols M. G., et al. 2005. Quality pork genes and meat production – A review.Meat Science. 70:409–421.
Pérez, P.; de los Campos G.; Crossa, J.;Gianola, D. 2010.Genomic-enabled prediction based on molecular markers and pedigree using the Bayesian Linear Regression package in R. Plant Genome .3:106–116.
13 R DEVELOPMENT CORE TEAM. 2011. R: A language and environment for statistical computing. R Foundation for Statistical Computing, Vienna, Austria. ISBN 3-900051-07-0, URL http://www.R-project.org.
Resende, M. D. V. de; Lopes, P. S.; Silva, R. L.; Pires, I. E. 2008. Seleçãogenômica ampla (GWS) e maximização da eficiência do melhoramento genético. Pesquisa Florestal Brasileira. 56: 63-78.
Resende, M.D.V. de; Resende Júnior, M.F.R; Aguiar, A.M.; Abad, J.I.M.; Missiaggia, A.A.; Sansaloni, C.; Petroli, C.; Grattapaglia, D. 2010. Computação da Seleção Genômica Ampla (GWS). Dados eletrônicos, Colombo : Embrapa Florestas,CD-ROM.
Silva, F. F.; Rosa, G. J. M.; De Los Campos, G.; Guimarães, S.E.F.; Lopes, P.S.2009. Bayesian factor analysis applied to QTL detection in crosses between outbred populations. In: SGLPGE -Statistical Genetics of Livestock for the Post-Genomic Era, Madison-WI. Book of Abstracts - SGLPGE.Madison-WI.http://dysci.wisc.edu/sglpge/index.html
Solberg, T. R.;Sonesson, A. K.;Woolliams, J. A.; Odegard,J.;Meuwissen, T. H.E. 2009.Persistence of accuracy of genome-wide breeding values over generations when including a polygenic effect.Genetics Selection Evolution.41:53
Stearns, T. M.; Beever, J. E.; Southey, B. R.; Ellis, M.; Mckeith, F.K.; Rodriguez-zas, S. L. 2005. Evaluation of approaches to detect quantitative trait loci for growth, carcass, and meat quality on swine chromosomes 2, 6, 13, and 18. II. Multivariate and principal component analyses. Journal of Animal Science.83:2471-2481.
Squires, E.J.;Schenkel, F.S. 2010.Managing Boar Taint: Focus
14 Varona, L;, Vidal, O.; Quintanilla, R.; Gil, M.; Sanchez, A.; Folch, J.; Hortos, M.; Rius, M.; Amills, M; Noguera, J. 2005.Bayesian analysis of quantitative trait loci for boar taint in a Landrace outbred population. Journal of Animal Science.83:301-307.
16 Genomic selection for boar taint and carcass traits in a commercial pig line1
ABSTRACT:The present study aimed to compare two different methods (RR-BLUP and Bayesian LASSO) and also to determine which method provides more accurate results for genomic selection in a pig line considering two boar taint traits, concentration of androstenone (andro) and concentration of skatole (ska) and two carcass traits,backfat thickness (fat) and loin depth (loin). A total of 622 boars from the same farm were genotyped for 2,500 SNPsselected, non informative markers with minor allele frequency (MAF) <0.05 and call rate < 0.95 at least. The estimated genomic breeding values (GEBVs) and their accuracy based on Jack-knife cross-validation were calculated in both methods using the R software (packages rrBLUP and BLR). The Bayesian LASSO method reached values of accuracy respectively equal to 0.65, 0.58 and 0.33 forandro, ska and loin,andheritabilities equal to 0.46, 0.26 and 0.08.RR-BLUP accuracy was equal to 0.61 and heritability equal to 0.32 for fat. The genetic correlations estimates between the four traits were computed by the correlations between the GEBVs vectors.These estimates were 0.24, 0.03 respectively between andro and ska, and fat and loin. Due to the fact that the Bayesian LASSO has been more accurate for three traits when compared with RR-BLUP, it was possible to conclude that the genomic selection of the animals could be made with higher accuracy using thismethod.
Keywords: accuracy; breeding; genotype; genetic correlation; heritability
1
17 INTRODUCTION
Most of the progress obtained in quantitative traits has been due to selection based on phenotypes or by estimation of genetic value of derived phenotype.However, with the development of the biotechnology molecular markers became available, mainly single nucleotide polymorphisms (SNPs), enabling the proposal genome wide selection (GWS) (Meuwissen et al., 2001), which consists of the simultaneous analysis of large number of markers widely distributed throughout the genome.
In the pig, studies are still being developed in this context, like Ramos et al. (2009) that idealize a highdensity porcine SNP genotyping Beadchip using the nextgeneration sequencing technologies for the mass identification ofgenetic variation, including identification ofSNPs in regions of the genome that have not been previously sequenced. Harlizius et al. (2011) presented a set of SNPs for paternal identification aiming to reduce the costs of trait recording.Duijvesteijn et al. (2010) presented an association study to find out SNPs associated with androstenone, which together with skatole represent the major components related to boar taint. Furthermore, Ramos et al. (2011) reported another association study to identify SNPs related to skatole levels in the pig carcass.
18 Boar taint is the undesirable smell and taste of pork meat derived from some entire male pigs. Themain causes of boar taint are the two compounds androstenone and skatole (Gregersen et al., 2012).Genomic selection for the traits concentration of androstenone, concentration of skatole, backfat thickness and loin depth (carcass traits) has not yet been proposed.
The aim of the present study was to compare the methods RR-BLUP and Bayesian LASSO to calculate estimated genomic breeding values (GEBVs), and to determine which method provides more accurate results for the genomic selection for boar taint and carcass trais in the pig.
MATERIAL AND METHODS
Animals and phenotype collection
The field experiment was conducted strictly in a white commercialline with the Dutch law on theprotection of animals. In the present study, 622 boars from a farm in the Netherlands were phenotyped for the following traits: concentration of androstenone and concentration of skatole, backfat thickness (HGP backfat), loin depth (HGPloin).
19 SNPs selection
According to the methodology used by Lopes (2011), 2,500 SNPs represent an optimal number for the estimation of genomic relatedness.So that,this was the number of SNPs used in this study for the calculations of estimated genomic breeding values (GEBVs). The SNPs were distributed throughout the chromosomes, with an average of 131 SNPs per chromosome and an average distance between the SNPs equal to 1,038Kb.
Computation of estimated genomic breeding values (GEBVs)
Two methods for genomic selection were used in the study to calculate the estimated genomic breeding values (GEBVs): the ridge regression BLUP (RR-BLUP) and Bayesian LASSO, both using the Rsoftware (R Development Core Team, 2011).
For the ridge regression BLUP (RR-BLUP), Meuwissen et al. (2001), the model used was:
∑
where is the vector of phenotypes, one is the same vector y with dimension of all the inputs equal to 1, is the average of the parameter evaluated, is the SNP marker effect (i = 1,2, .. ., p), is the incidence matrix of each marker , and is the vector of residuals of the model that considers random effects of the markers with normal distribution and homogeneous variance.This variance as the residual variance, is considered unknown and can be estimated along with the effects of the markers by solving equations of mixed models via Restricted Maximum Likelihood method (REML). The following general linear mixed model is adjusted to estimate the effects of markers:
20 2, respectively, for aa, Aa and AA.Thus, the mixed model equations to predict GEBVsby the method RR-BLUP are equal to:
[
( ⁄ )] [ ̂
̂] [ ]
Where: refers to the genetic variance of the trait, refers to the residual variance and is function of the total number of markers weighted by its allele frequencies, given by ∑ where is the allele frequency of the allele . In this method it is assumed that each locus explains ⁄ , meaning that equal parts of the genetic variance are attributable to all loci. Furthermore, the estimated genomic breeding value (GEBV) of the individual is given by:
̂ ̂ ∑ ̂ ̂ ̂ ̂ ̂
Where: ̂ is the average of the population, refers to the incidence matrix of each marker ,̂is the vector of SNP marker effect.
For the RR-BLUP method, it was used therrBLUPR package (Endelman, 2011) via mixed.solve function.
The regression LASSO (Least Absolute Shrinkage and Selection Operator, Tibshirani, 1996), combines variable selection and regularization via shrinkage of the regression coefficients. The implementation of Bayesian LASSO regression (Park&Casella, 2008) was adapted for genomic selection by de Los Campos et al. (2009). In this adaptation, information from relatives and other covariates that do not suffer the effect of regularization are considered in the model. For this last method the R package BLR (de Los Campos, 2010) was used.The Bayesian LASSO is a penalized Bayesian regression procedure (Silva et al., 2011), whose general estimator is given by the following equation where λ is the regularization parameter.
̂ { ̂ ̂ ∑| |
21 When = 0 there is no regularization, and when > 0 there is a shrinkage of the marker effects toward zero with the possibility of setting some identically equal to zero, resulting in a simultaneous estimation and variable selection procedure. When this last parameter is equal to zero, there is no adjustment.In the Bayesian LASSO, this parameter controls the precision of prior distribution assigned to the regression coefficients.
For both methods,hot carcass weight was used as a linear covariate for backfat thickness and loin depth. For the concentrations of androstenone and skatole, hot carcass weight and age were used as linear covariates. Asfixed effect for all traits, contemporary groups were used (month and year of slaughter).
Cross-validation
The training population consisted of 622 animals and the validation population consisted of its subgroups, using the technique of Jack-knife where the predicted genomic breeding value of animal was calculated by ̂ ̂ , where denotes the SNP genotype vector of animal and ̂ denotes the estimated marker effects vector from the analysis that
considered all animals, except the animal . The vector containing all predicted values was ̂ [ ̂ ̂ ] , which was used to calculate the
accuracy(ResendeJúnior et al., 2012), by the following equation: ̂⁄√
where: is the accuracy, ̂is the Pearson’s correlation between the phenotypes of the animals and the predicted GEBVscalculated disregarding their phenotype and taking into account the genomic kinship with animals from the training population and √ is the square root of the heritability of the trait.
Heritability and correlations
22 ̂⁄ ̂ ̂
where: is the heritability, ̂ is the estimated additive genetic variancecalculated by ∑ assuming that in RR-BLUP method is constant and Bayesian LASSO method has one variance for each marker, and ̂ is the estimated residual variance.
The genetic correlations across the four traits were computed by their Spearman’s correlation of the GEBVs in the most accurate method (RR-BLUP or Bayesian LASSO).
The correlation across the effects of the markers were calculated also by theSpearman’s correlation of the vectors effects of each trait in the best method.
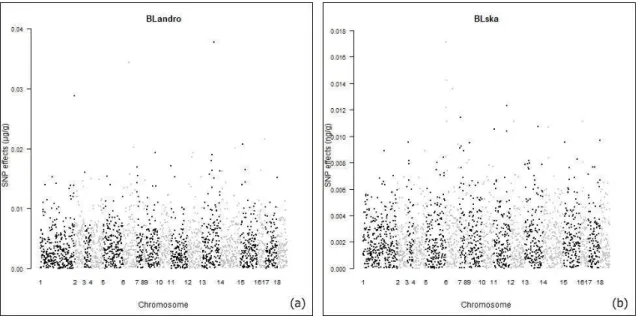
The effects of the markers were distributed throughout the chromosomes for each trait and Manhattan plots were built with package gap in the R software.
RESULTS
The accuracy of the methods was used to support the choice of the best one for genomic selection.For three traits, the Bayesian LASSO reached higher accuracy than RR-BLUP method. For the traits:concentration of androstenone (andro), concentration of skatole (ska)backfat thickness and loin depth (loin)the accuracy values with the Bayesian LASSO were equal to 0.65, 0.58, 0.56 and 0.33, respectively, in contrast of the RR-BLUP that reached the values of accuracy 0.63, 0.57, 0.61 and 0.26, for the four traits respectively.
The heritability of each trait was calculated considering the estimated additive genetic variance computed using the allele frequencies and the estimated residual variance. The values of the heritabilitiesare presented in Table 1, on its diagonal.Genetic correlations across the four
traits were computed by the Spearman’s correlation of the GEBVs of the
23 Table 1.The correlations between the effects of the markers were calculated by the Spearman’s correlation of the vectors of effects of each trait in the best method and the results are shown below the diagonal of Table 1.
Table 1.Heritabilitieson the diagonal, genetic correlationson the upper, right triangle and correlations of estimated effectson the lower left triangle.
T1 T2 T3 T4
T1 0,46 0,24 (p<0,01) -0,01 (p>0,05) -0,02 (p>0,05) T2 0,36 (p<0,01) 0,26 0,03 (p>0,05) -0,13 (p>0,05) T3 0,10 (p<0,01) 0,03 (p>0,05) 0,32 0,03 (p>0,05) T4 -0,09 (p<0,01) -0,07 (p<0,01) 0,01 (p>0,05) 0,10 T1= concentration of androstenone; T2= concentration of skatole;
T3= backfat thickness; T4= loin depth.
The effects of the markers were distributed throughout the chromosomes for the traits and Manhattan plots were built in the R software and it can be seen in Figure 1 and Figure 2.
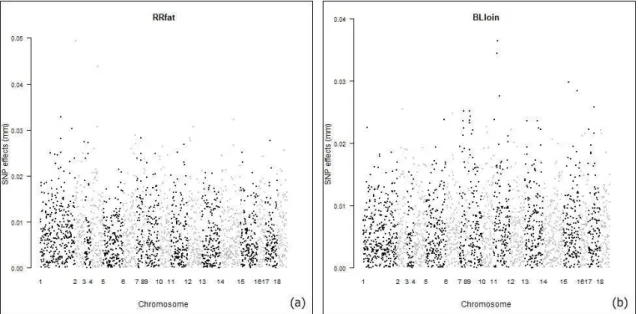
24 Figure 2. Distribution and plot of effects of the markers in carcass traits: (a) backfat thickness, (b) loin depth.
DISCUSSION
25 rangingfrom 0.25 to 0.88 according to Selier et al. (2000) and 0.54 reported by Windig et al. (2012). Lower heritabilitieshave been reported for skatole concentration, between 0.19, 0.41 and 0.55 found respectively by Pederson (1998), Windig et al. (2012) and Tajet et al. (2006). The value found in this study agrees with them. It is worth of mentioning, that all reported studies used only phenotypic data for the estimations.
In the current study, the values of accuracy are consistent with the values reported by Resende et al. (2008)in a simulation study, that showed accuracies ranging from 0.71 to 0.95 for a training population containing 100 and 1,000 individuals, respectively.The accuracy of the genomic selection depends on the factors: heritability of the trait, number of loci controlling the trait and distribution of their effects, number of individuals in the training population, effective size of the population and spacing between markers (Hayes et al., 2009).Considering the third factor, in the present study, as the validation and the training populations were the same, despite the small size of the population and the high kinship across the animals due to their same origin,the value of accuracy of the methods could have been affected by that, moreover, the accuracy could be raised up, increasing the number of individuals. Opportunities for increasing geneticgain through MAS on a given QTL differ depending onwhether the QTL is marked by LE, LD, or direct markers. (Dekkers, 2004).Taking into account that in this study, the 2,500 SNPs were in LE between each other, but the linkage between the markers and the QTLs wereunkown, if a larger number of markers was used in the analysis, it was expected an increase of accuracy, once the reduction on the markers distance would enhance the chance of a marker being in LD with the QTL.
26 slightly higher than unit, these coefficients from Bayesian LASSO method were most close to unit for all phenotypes, providing a low bias in comparison with RR-BLUP. These results are in agreement with those obtained by Ogutu et al. (2012), which using a simulated data set, indicated that LASSO type regressions were more efficient that RR-BLUP for genomic selection, since provided more accurate and less biased predictions.
Although there is no comparison between regression penalized andRR-BLUP breeding pigs, the higher accuracy of LASSO has been reported in other studiesOgutu et al. (2012).
The genomic selection for boar taint traits becomes viable due to the fact that castration of male piglets is a practice that has been banned in some countries because of welfare concerns and reduction of feed conversion efficiency as well as in carcass trait values (Claus et al., 1994). In the near future, if uncastrated males will be finished, boar taint traits need to be prevented (Duijvestijn et al., 2010). The possibility of increasing the number of markers and consequently the accuracy, genomic selection can be an alternative to the costly determination of boar taint compounds.
27 normally distributed, due to the presence of genes of larger effects(Usai et al.,2009).
The genetic correlations were computed across theGEBVs of the four traits.In the present study, it wasshowed that the genetic correlation between the traits backfatthickness and loin depth is equal to zero, but its value was not in accordance with the literature. For instance, Tomiyama et al.(2009) reported an estimate of the genetic correlation between loin eye areaand backfat thickness of –0.40 in pigs and van Wijk et al. (2005) described a genetic correlation between backfat thickness and loin weight equal to -0.60 in pigs. Between the traits concentration of androstenone and skatole, the results showed a genetic correlation equal to 0.24, which is consistent with the study made by Tajet et al. (2006) which reported values equal to 0.36 for Landrace pigs, 0.37 found by Windig et al. (2012).
The correlations calculated between the vector of effects of the traits (shown in Table 1) were useful to demonstrate the relevance of the markers for each trait, thereby it can be assumed that the markers which explain boar taint traits (concentration of androstenone and skatole) had a high positive correlation between their vectors of effects as shown in Table 1.
Taking notice of the distribution of the effects throughout the chromosomes, the markers that had higher peak can be considered the most important markers controlling the traits. Thus, for concentration of androstenone the highest peaks were found on chromosomes SSC1,
SSC6, SSC13 and SSC15. PIGQTLdatabase
28 For the trait concentration of skatole, the highest peaks were found on chromosomes SSC6, SSC7 and SSC12, and PIGQTLdatabase reports 7 QTLs associated with this trait. Ramos et al. (2011) reported a genome-wide association study revealing 16 SNPs located on the proximal region of SSC6 significantly associated with skatole levels. For the chromosome SSC7, Grindflek et al. (2001)reported a QTL associated with smell intensity. For SSC12 there are no reports for the trait concentration of skatole.
With respect to the carcass traits, the highest peaks for backfatthickness were found on SSC1, SSC2, SSC4 and SSC14, and PIGQTLdatabase reports respectively 81, 100, 83 and 11 QTLs associated with this trait at these chromosomes. For the trait loin depth, the highest peaks were found on SSC11, SSC15 and SSC17, PIGQTLdatabase reports respectively 9, 2 and 3 QTLs associated with this trait on these choromosomes.
The presence of these QTLs reported in PIGQTLdatabase and the other studies performed are useful to validate the regions that have markers with minor or major effects on the traits, the sizeof effectsthroughout the chromosomes provide information for future studies on candidate genes and support the implementation of genomic selection in the pig.
29 LITERATURE CITED
Calus, M.P.L., Veerkamp, R.F. 2007.Accuracy of breeding values when using and ignoring the polygenic effect in genomic breeding value estimation with a marker density of one SNP per cM.Journal of Animal Breeding and Genetics.124:362-368.
Claus, R., Weiler, U., Herzoq, A. 1994. Physiological aspects of androstenone and skatole formation in the boar-A review with experimental data.Meat Science. 38(2): 289-305.
de Los Campos, G.; Rodriguez, P.P. 2010.BLR: Bayesian Linear Regression. R package version 1.2.http://CRAN.R-project.org/package=BLR
de Los Campos, G.; Naya, H.; Gianola, D.; Crossa, J.; Legarra, A.; Manfredi, E.; Weigel, K.; Cotes, J. M. 2009.Predicting quantitative traits with regression models for dense molecular markers. Genetics. 182: 375-385.
Dekkers, J.C M. 2004. Commercial applications of marker-and gene-assisted selection in livestock:Strategies and lessons.Journal of .Animal Science.82(E.Suppl.)E313-E328.
Duijvesteijn, N.; Knol, E.; Merks, J.; Crooijmans, R.; Groenen, M.; Bovenhuis, H.; Harlizius, B. 2010. A genome-wide association study on androstenone levels in pigs reveals a cluster of candidate genes on chromosome 6. BMC Genetics.20:11-42.
30 Falconer, D.S., Mackay, T.F.C., 1996.Introduction to Quantitative Genetics. Longman, London 464p.
Goddard,M.E., Hayes,B.J. 2007.Genomic selection. Journal of Animal Breeding and Genetics. 124, 323–330.
Gregersen,V.R., Conley,L.N, Sorensen,K.K, Guldbrandtsen,B., Velander, I.H., Bendixen,C.2012. Genome-wide association scan and
phasedhaplotype construction for quantitative trait lociaffecting boar taint in three pig breeds. BMC Genomics. 13:22.
Grindflek, E.,Szyda, J., Liu, Z., Lien, S. 2001.Detection of quantitative trait loci for meat quality in a commercial slaughter pig cross. Mammalian Genome.12:.299-304.
HabierD.,Fernando R. L., Dekkers J. C. M. 2007. The Impact of Genetic Relationship Information on Genome-Assisted Breeding Values.Genetics. 177:2389–2397.
Hayes, B.J., Visscher, P.M., Goddard, M.E. 2009. Increased accuracy of artificial selection by using the realized relationship matrix.Genetics Research. 91:47-60.
Harlizius, B.; Lopes, M.S.;Duijvesteijn, N.; van de Goor, L.H.P.; van Haeringen, W.A.;Panneman, H.;Guimarães, S.E.F.;Merks, J.W.M.;Knol, E.F. 2011.A SNP set for paternalidentification to reduce the costs of trait recording in commercial pig breeding.Journal of Animal Science. In press.
HennesyGrading Probe-
31 Lopes, M.S.Number of SNP markers for parental identification, kinship and inbreeding estimation in pigs, 2011.47f.Dissertação (MestradoemZootecnia, Universidade Federal de Viçosa)
Meuwissen T.H.E., Hayes B.J., Goddard M.E. 2001.Prediction of total genetic value using genome-wide dense marker maps.Genetics.157:1819–1829.
Ogutu, J.O., Schulz-Streeck, T., and Piepho, H.P. 2012. Genomic selection using regularized linear regression models: ridge regression, lasso, elastic net and their extensions. BMC Proceedings. 6:S10. Available from http://www.biomedcentral.com/1753-6561/6/S2/S10.
Park, T.; Casella, G. 2008.The Bayesian Lasso. Journal of the American Statistical Association.103: 681-686.
Pederson, B. 1998.Heritability of skatole in back fat. In Skatole and boar taintEdited by: Jensen W. Roskilde: Danish Meat Research Institute;129-136.
PIGQTLdatabase- http://www.animalgenome.org/cgi-bin/QTLdb/SS/index
R DEVELOPMENT CORE TEAM, 2011. R: A language and environment for statistical computing.R Foundation for Statistical Computing, Vienna, Austria. ISBN 3-900051-07-0, URL http://www.R-project.org
32 Ramos, M.A.,Duijvesteijn, N., Knol, E.F., Merks, J.W.M, Bovenhuis, H., Crooijmans, R.P.M.A.,Groenen, M.A.M., Harlizius, B. 2011.The distal end of porcine chromosome 6p is involved in the regulation of skatole levels in boars. BMC Genetics. 12:35.
Resende, M. D. V. de; Lopes, P. S.; Silva, R. L.; Pires, I. E. 2008. Seleçãogenômica ampla (GWS) e maximização da eficiência do melhoramento genético. Pesquisa Florestal Brasileira. 56: 63-78.
Resende Jr, M. F. R.; Muñoz, P.; Resende, M. D. V.; Garrick, D. J.; Fernando, R.L.; Davis,J.M.; Jokela, E.J.; Martin, A.; Peter, G. F.; Kirst, M. 2012. Accuracy of Genomic Selection Methods in a StandardData Set of Loblolly Pine (Pinustaeda L.). Genetics. 190: 1503-1510.
Sellier, P., Le Roy, P., Fouilloux, M., Gruand, J., Bonneau, M. 2000.Responses torestricted index selection and genetic parameters for fat androstenonelevel and sexual maturity status of young boars. LivestockProductionScience. 63:265-274.
Silva, F.F; Varona, L.; Resende, M.D.V.; Bueno Filho, J.S.S; Rosa, G.J.M.; Viana, J.M.S. 2011. A note on accuracy of Bayesian LASSO regression on GWS.Livestock Science. 142:310-314.
Szyda, J.,Grindflek, E., Liu, Z., Lien, S. 2003.Multivariate mixed inheritance models for QTL detection on porcine chromosome 6. Genetical Research.81:65-73.
33 Tibshirani, R. 1996. Regression shrinkage and selection via the LASSO, Journals of the Royal Statistical Society Series B (Statistical Methodology).58: 267-288.
Tomiyama, M., Oikawa, T., Hoque, M.A., Kanetani, T., Mori, H. 2009.Influence of early postweaning traits on genetic improvement of meat productivityin purebred Berkshire pigs.Journal of Animal Science.87:1613-1619.
Usai, M. G., Goddard, M.E., Hayes, B.J. 2009. LASSO with cross-validation for genomic selection. Genetics Research. 91:427-436.
vanWijk, H. J., Arts, D. J. G., Matthews, J.O., Webster, M., Ducro, B. J., Knol, E. F. 2005.Genetic parameters for carcass composition and pork quality estimated in a commercial production chain. Journal of Animal Science.83:324–333.
Windig, J.J., Mulder, H.A., ten Napel, J., Knol, E.F., Mathur, P.K., Crump, R.E. 2012. Genetic parameters for androstenone, skatole, indole, and human nose scores as measures of boar taint and their relationship with fi nishing traits.Journal of Animal Science.90:2120–2129.
APPENDIX
Implementation of RR-BLUP in R
setwd("C:\\Users\\Usuario\\Desktop\\Análises_RR\\andro") library(rrBLUP)
#####reading data set############
34 Z1=as.matrix(data.frame(Z[,-(1:5)]),622,2500) #keeping just columns related with markers genotype (0, 1 and 2)
M=matrix(0,nrow(Z1),ncol(Z1)) #transforming 0, 1 and 2 values to -1, 0 and 1 M[Z1==0]<--1
M[Z1==1]<-0
M[Z1==2]<-1 #M is the marker matrix allele=read.table("allele.txt")
############ andro:general adjustment ###############
ym_slg=factor(data$ym_slg) #specifying year-month at slaughter fixed effect
farm=factor(data$farm) #specifying farm fixed effect
hcw=data$hcw #specifying hot carcass weigth fixed effect (linear covariate)
age=data$age #specifying age fixed effect (covariate)
f1=noquote(paste(ym_slg,farm,sep="")) #specifying interaction between year-month at slaughter and farm
f11=factor(f1)
#################################### X= model.matrix(~ f11 + hcw + age)
fit_andro=mixed.solve(data$andro, Z=M, X=X)
va=fit_andro$Vu*sum(2*allele[,1]*allele[,2]) h2_andro= va/(va + fit_andro$Ve)
write.table(h2_andro,"h2andro.txt",row.names=FALSE,col.names=FALSE, quote=FALSE)
GBV1=M%*%fit_andro$u
35 ############ andro:jack-knife ############################## GBV=NULL
for (i in 1:nrow(data)) {
GBV[i]=as.matrix(M[i,]%*%mixed.solve(data$andro[-i], Z=M[-i,], X=X[-i,])$u)
}
write.table(GBV,"GBVandro.txt",row.names=FALSE,col.names=FALSE,qu ote=FALSE)
################# exporting accuracy ############# GBV=read.table("GBVandro.txt")
h2_andro=read.table("h2andro.txt")
acuracia=cor(data$andro,GBV)/sqrt(h2_andro)
write.table(acuracia,"acuracia_andro.txt",row.names=FALSE,col.names=F ALSE,quote=FALSE)
Implementation of Bayesian LASSO in R
setwd("C:\\Users\\USUARIO\\Desktop\\Resultados__RReBL\\Análises_BL \\andro")
library(BLR)
#####reading data set########################
data=read.table("data_novo.txt",h=T) #phenotypes data file
Z=(read.table("marker_novo1.txt",h=T)) #Markers data file
Z1=as.matrix(data.frame(Z[,-(1:5)]),622,2500) #keeping just columns related with markers genotype (0, 1 and 2)
36 M[Z1==1]<-0
M[Z1==2]<-1 #M is the marker matrix allele=read.table("allele.txt")
############ andro:ajustegeral ############################## ym_slg=factor(data$ym_slg) #specifying year-month at slaughter fixed effect
farm=factor(data$farm) #specifying farm fixed effect
hcw=data$hcw #specifying hot carcass weigth fixed effect (linear covariate)
age=data$age #specifying age fixed effect (covariate)
f1=noquote(paste(ym_slg,farm,sep="")) #specifying interaction between year-month at slaughter and farm
f11=factor(f1)
X= model.matrix(~ f11 + hcw + age)
#################################### nIter=10000
burnIn=4000 thin=2
prior=list(varE=list(S=4.5,df=3),
varBR=list(S=.009,df=3),lambda=list(type="random",value=30,shape=.52,r ate=2e-5))
fit_andro=BLR(y=data$andro,XF=X,
XL=M,nIter=nIter,burnIn=burnIn,thin=thin, prior=prior)
sig2_m=fit_andro$varE*fit_andro$tau2 va=sum(sig2_m*2*allele[,1]*allele[,2]) h2_andro= va/(va + fit_andro$varE)
37 GBV1=M%*%fit_andro$bL
write.table(GBV1,"GBV1andro.txt",row.names=FALSE,col.names=FALSE, quote=FALSE)
############ andro:jack-knife ############################## GBV=NULL
for (i in 1:nrow(data)) {
GBV[i]=as.matrix(M[i,]%*%BLR(y=data$andro[-i],XF=X[-i,],XL=M[-i,],nIter=nIter,burnIn=burnIn,thin=thin, prior=prior)$bL)
}
write.table(GBV,"GBVandro.txt",row.names=FALSE,col.names=FALSE,qu ote=FALSE)
############ exporting accuracy ####### acuracia=cor(data$andro,GBV)/sqrt(h2_andro)