Abstract: Guava plays an important role in Brazilian agribusiness. Among other goals, guava breeding programs aim to achieve more productive cultivars and improved fruit quality. Thus, the present study aimed to investigate genetic variability in full-sib progenies of Psidium guajava (guava) and estimate the genetic progress obtained from different selection criteria in order to select the most promising genotypes. This is the first work that uses these criteria of selection to guava. The experiment was conducted in randomized block design with 2 replicates, and 10 progenies were assessed, with 12 plants per plot. Direct and indirect selection and the classic index with 2 economic weights were used for
PlAnt Breeding - Article
Genetic gain estimated by different selection
criteria in guava progenies
Claudia Lougon Paiva, Alexandre Pio Viana*, Eileen Azevedo Santos, Josie Cloviane Oliveira Freitas, Antonio Teixeira do Amaral Junior
Universidade Estadual do Norte Fluminense Darcy Ribeiro - Centro de Ciências e Tecnologias Agropecuárias - Campos dos Goytacazes (RJ), Brazil.
*Corresponding author: [email protected]
Received: Oct. 8, 2015 – Accepted: Feb. 17, 2016
predicting the genetic gain between and within progenies. The 5 best progenies among those analyzed and 4 plants within the progenies were selected. Direct selection provided higher gains for number of fruits, and indirect selection generated small gains for the other traits. When the trial values were used as economic weight, the classic index was the selection criterion that showed the best results for gains in fruit number and fruit weight, being indicated as the most appropriate selection strategy for genetic breeding in the studied population.
intrOdUCtiOn
Brazil is one of the world’s largest producers of red guava, with an annual production of approximately 345,000 tons (IBGE 2014). Guava is cultivated in commercial orchards from Rio Grande do Sul, crossing São Paulo, Minas Gerais and Goiás, to the Northern and Northeastern Brazil (IBGE 2014). The selection of promising genotypes and launching of a cultivar require the evaluation of the traits of agronomic interest, which are mostly of quantitative inheritance and suffer great environmental effect. Many of these traits are associated with each other; thus, the selection of a character may affect others, either positively or negatively (Cruz et al. 2012). Thus, it is important to determine the correlations between traits of interest for improvement, which may arise from gene links or pleiotropy.
Genetic gain can be obtained by using direct and indirect selection for a trait. However, when the traits are correlated, univariate selection criteria may not generate satisfactory genetic gains for all traits assessed. This results from the fact that the traits are evaluated simultaneously and brought together in a single genotype, which makes selection more difficult, since there may be influence from the correlation between traits, whose direction and magnitude depend on the association between them (Berilli et al. 2013).
Thus, in order to select genotypes holding a set of desirable traits and to obtain favorable genetic gains, multivariate analyses have been used, with emphasis on the selection indices (Cruz et al. 2012). The classic indexes of Smith (1936) and Hazel (1943) are the most used. These indexes use only one value for the selection of genotypes with desirable agronomic traits. The value results from the association of different selected variables, in which the performance of simultaneous selection is desired (Cruz et al. 2012). Therefore, selection requires the definition of the best criterion. This choice is associated with the intensity of genetic gains predicted in all traits evaluated and their application.
Until now, there are no records of the selection of promising genotypes with the approach of the selection index and the direct and indirect selection for guava. This is the first work addressing and comparing different selection criteria for this crop. Therefore, it aimed to estimate genetic parameters, verify the correlation between the traits related to the fruit, and compare the genetic gains predicted in different selection indices between and within progenies of guava full-sibs, so as to select the best plants based on fruit-related traits.
MAteriAl And MetHOdS
Plant material
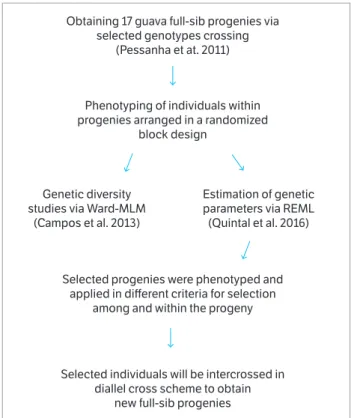
The studied population was derived from controlled 2-parent crossings, obtained between September and October 2008. The parents used for the crosses were selected based on the study on genetic diversity via molecular markers (Pessanha et al. 2011). Since they were originated from parents with considerable degree of heterozygosity, the seeds from these crosses generated an S0 population with large genetic
variability. Thus, the S0 population behaves similarly to an
F2 population, or a segregating one. The variability (Campos
et al. 2013) and genetic parameter estimation via REML (Quintal et al. 2016) of this population were analyzed in previous studies (Figure 1).
Obtaining 17 guava full-sib progenies via selected genotypes crossing
(Pessanha et at. 2011)
Phenotyping of individuals within progenies arranged in a randomized
block design
Selected progenies were phenotyped and applied in different criteria for selection
among and within the progeny
Selected individuals will be intercrossed in diallel cross scheme to obtain
new full-sib progenies Genetic diversity
studies via Ward-MLM (Campos et al. 2013)
Estimation of genetic parameters via REML (Quintal et al. 2016)
Figure 1. Flowchart of guava breeding program developed by UENF.
harvested when they reached the first stage of maturation, with dark green skin. Later, they were evaluated considering the descriptors’ relationship for the species Psidium guajava L.,
according to UPOV (1987) (International Union for the Protection of New Varieties of Plants).
At harvest time, all the fruits were counted and weighed on a precision scale. The average production per genotype (PT) was obtained by multiplying the average fruit weight by the number of fruits. The other variables were obtained from the sampling of 15 fruits collected from each genotype, namely: mesocarp thickness (EM, in cm), measurement of the region from the fruit skin to the beginning of the placenta; skin thickness (EC, in mm), which comprises the white, stiff region preceding the mesocarp; ratio between fruit length and fruit diameter (CM/DM), obtained from the ratio between the length (longitudinal) and the diameter (cross-sectional) of the fruit (dimensionless); pulp yield (RP), calculated from the ratio between fruit mass and pulp mass; and the content of soluble solids (TSS), which was determined by an Atago refractometer number 1, whose results are expressed in °Brix.
Statistical analysis
The analysis of variance was performed according to the following statistical model:
b. Residual variance:
Yijk = μ + pi + bj + eij + dijk
where: Yijkis the observation of genotype k of progeny
in repetition j; μ is the general constant; pi is the effect of the
progeny i; bj is the effect of the repetition j; eij is the experimental
error associated to the progeny i, in repetition j; dijk is the
effect of the individual k of the progeny i in the repetition j. All analyses were performed with the help of the Genes software system (Cruz 2013). Then, the following genetic parameters were estimated: coefficient of experimental variation (CVe); coefficient of genetic variation (CVg); variation
index (CVg/CVe); variance within the progeny (σ2 w); residual
variance (σ2
e), genotypic variance (σ2 g), heritability of average
progenies (h2
m) and heritability of individuals within families
(h2
p). The parameters were calculated as follows:
a. Variance within the parcel:
σ ˆ2w = QMP
c. Genetic variance:
σ ˆ2e = QME / р
σ ˆ2g = (QMG – QME) / (р · r)
h ˆm 2= (QMG – QME) / QMG
h ˆm 2= σ ˆ2g / (σ ˆ2g + σ ˆ2e+ σ ˆ2w )
CVe = (100 ∙√σ ˆ 2 e )/ x –
CVg = (100 ∙√σ 2 g )/ m ˆ
VI = CVg / CVe
σ ˆ2р= QMG / (р · r) d. Phenotypic variance:
e. Heritability based on family average:
f. Heritability of individuals within families:
g. Coefficient of experimental variation:
h. Coefficient of genetic variation:
i. Variation index:
The genetic correlation between the traits was carried out in order to assess the degree of genetic association between 2 quantitative traits. The multicollinearity test was also performed so as to achieve more accurate estimates in a regression model, which is used for obtaining genetic gains. The variance inflation factor (FIV) was used to determine the presence or absence of multicollinearity. FIV values below 10 determined the absence of serious multicollinearity problem.
The prediction of genetic gains allowed the selection of the 5 best progenies and the 4 best plants within the progeny, totaling 40 selected plants, which corresponds to approximately 16.6% of the total genotypes assessed. The selection was simulated for all traits aiming to increase their original averages.
Direct and indirect selection
GSe = h
2
m ∙ DSe and GSe % = 100 ∙ (GSe / x –o)
The economic weights used in the classic index derived from the following experimental data: economic weights for the coefficient of genetic variation of each trait evaluated (ISH1); economic values obtained by trial, with values:
1; 5,000; 1; 5,000; 1 for production, mesocarp thickness, skin thickness, pulp yield, ratio between fruit length and fruit diameter (ISH2), respectively. After several trials, these values
were chosen for generating satisfactory predicted gains for production, without influences.
reSUltS And diSCUSSiOn
The assessed traits are fundamental to the acceptance of the fruit by the consumer market, which requires large and more rounded fruits with good pulp yield and pleasant flavor. The prediction of fruit shape is obtained by the ratio between the fruit length and fruit diameter. This relationship is an estimator of industrial quality, that is, the closer to 1, the rounder the fruit. Thus, measurements of fruit length and diameter alone are of little significance for the characterization of guava fruits (Campos et al. 2013). Therefore, it was observed that the evaluated fruits are within the required standards, and the average ratio between fruit length and fruit diameter is 1.17.
All traits evaluated had p < 0.05 between genotypes, except for TSS. This significant difference indicates that there is variability between genotypes, and this variability allows obtaining genetic gains from the selection between and within the progenies analyzed. The fact that the TSS did not show high difference between genotypes is not a problem for this population, because the values are within the range of values that satisfy both the market of fresh fruit and the juice and confectionery industry, which is from 8 to 12 °Brix (Ali et al. 2014), value between 7 and 14, with average of 8.7 °Brix.
The experimental coefficients of variation (CVe) ranged
from 0.98 (pulp yield) to 14.46 (total production). Ramos et al. (2010) evaluated the agronomic traits of guava and also found higher CVe values for production (25.98%).
Higher coefficient of variation values are observed for traits obtained from counting, such as the number of fruits per plant. This occurs also for production, since the variable is the product of the average weight of fruit per plant and the number of fruits per plant, which is a counting trait. The CVe values obtained for continuous phenotypic traits
GSd = h
2
d ∙ DSd and GSd % = 100 ∙ (GSd / x –o)
GSt = GSe ∙ GSd and GSt % = 100 ∙ (GSt / x –o)
where: GSe, GSd and GStare, respectively, the gains
between families, within families and total; h2
m and h2 d are the
heritability coefficients at the level of averages of families and at the level of plants within families, respectively; DSe and
DSdare, respectively, the selection differentials based on the
average of families and within families selection.
Classic index
I = b1x1 + b2x2 + ... + bx = ∑ n
i = l
bixi
H = a1g1 + a1g2 + angn + ... + angn = ∑ n
i = l
aigi = a΄g
GSl(I) = G ˆ1b ˆ1 (DSl(l1)/σ ˆ2 l1) + G ˆ2b ˆ2 (DSl(l2)/σ ˆ2 l2)
where: n is the number of traits assessed; b’ is the vector with size 1 × n of the weight coefficients of the selection index to be estimated; x is the matrix with the size n × p (plants) of phenotypic values of the traits; a’ is the vector with size 1 × n of the previously established economic weights; g is the matrix with size n × p of the genetic values unknown to the n traits considered.
The prediction of genetic gain for the traits was obtained by the expression:
where: GSl(I) is the expected response in the trait I, when
the selection was performed between and within the index; DSl(I1) and DSl(I2) are differentials of selection observed in
the indices I1 and I2, resulting from the selection between
and within progenies; s2
I1 and s2I2 are the estimators of the
were lower than 10%. These can be considered satisfactory values for experiments with perennial species (Verardi et al. 2011; Santos et al. 2015) since they indicate good experimental precision.
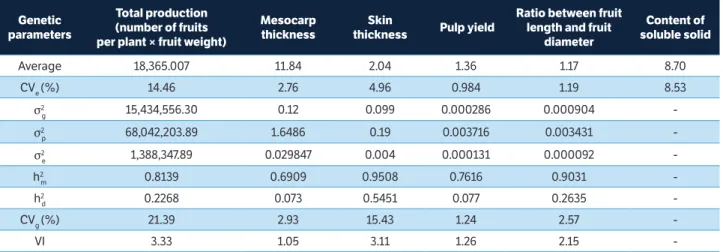
The variation index (VI) assesses how much of the environmental variance predominated over genetic variance. In other words, the closer it is to unity or above it, the less influenced the trait by the environment (Cavalcante et al. 2012). According to Vencovsky (1987), when the VI, which is the ratio between CVg and CVe, tends to 1 or is higher,
the population may achieve gains in the selection. Thus, the genotypes in the present study can be subjected to selection since the evaluated variables presented values above 1, ranging from 1.05 to 3.33.
The heritability coefficients, in relation to the average progeny, ranged from 0.69 to 0.95. The mesocarp thickness (0.95) and the ratio between fruit length and fruit diameter (0.90) were the traits that showed the highest values of heritability estimates for the average progeny (Table 1). Regarding the production of fruits per plant, a variable of great economic interest, a high coefficient of heritability (0.81) was observed, which indicates that the selection for this variable can be performed and provide satisfactory gains. The analysis of the heritability coefficients within families showed that they were much lower than the heritability based on a family average. Other studies have found similar results in clones of Eucalyptus L’Hér (Santos et al. 2015) and
Eucalyptus pellita F. Muell (Hung et al. 2015), which agrees
with this work, since both species are perennial. This result allows inferring that the selection based on the average of the
families can be more efficient than within families. However, the selection between and within families must be carried out so as to use all the existing variability in the population and maximize the genetic gains.
The multicollinearity analysis showed that the variables are uncorrelated within the range that is considered weak multicollinearity, according to the criteria proposed by Cruz et al. (2012). Cabral et al. (2011) stresses the importance of this test when regression, track and selection index analyses are intended. The estimates of the parameters under multicollinearity can admit values that are absurd or non-consistent with the biological phenomena studied (Cruz et al. 2012).
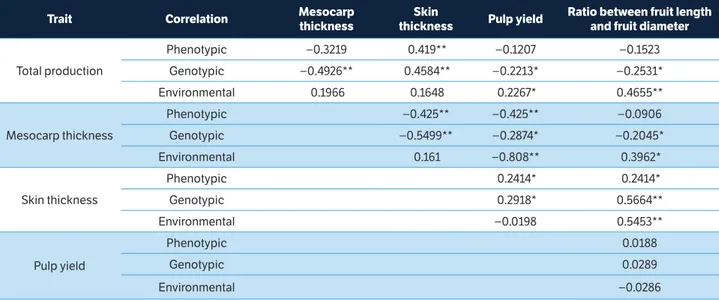
In the analysis, the coefficients of genotypic and phenotypic correlation in average progeny showed low values, including pulp yield × ratio between length and diameter (Table 2). These results indicate that the selection for these variables can be performed without a correlated response. It should be stressed that, for many traits, estimates of genetic correlation were higher than phenotypic correlations, which indicates that the genetic factors are more relevant than the environmental ones.
The estimates of phenotypic, genotypic and environmental correlation between PT and all the traits were negative (Table 2), except for skin thickness; this suggests that, by practicing selection in PT, all other traits may be negatively affected, with an increase in skin thickness, thus, forming a barrier since the meaning of selection is the same for all traits except skin thickness. The negative correlation between total fruit production and pulp yield can be explained by
genetic parameters
total production (number of fruits per plant × fruit weight)
Mesocarp thickness
Skin
thickness Pulp yield
ratio between fruit length and fruit
diameter
Content of soluble solid
Average 18,365.007 11.84 2.04 1.36 1.17 8.70
CVe (%) 14.46 2.76 4.96 0.984 1.19 8.53
σ2
g 15,434,556.30 0.12 0.099 0.000286 0.000904
-σ2
p 68,042,203.89 1.6486 0.19 0.003716 0.003431
-σ2
e 1,388,347.89 0.029847 0.004 0.000131 0.000092
-h2
m 0.8139 0.6909 0.9508 0.7616 0.9031
-h2
d 0.2268 0.073 0.5451 0.077 0.2635
-CVg (%) 21.39 2.93 15.43 1.24 2.57
-VI 3.33 1.05 3.11 1.26 2.15
-table 1. Summary of estimates of genetic parameters related to fruit traits.
σ2
g = Genotypic variance; σ 2
p =Phenotypic variance; σ 2
e = Residual variance; h 2 m and h
2
d = Estimates of the coefficients of heritability at the level of average families
the fact that increased fruit production tends to increase skin weight, which affects pulp weight. Krause et al. (2012) made the same observation when evaluating full-sib families of passion fruit and found negative correlation between yield and pulp weight. Therefore, the increased number of fruits per plant can lead to the production of smaller fruits with lower pulp weight. This information indicates that the selection for fruit production alone may cause undesirable changes in other variables.
The prediction of genetic gains has provided great help for breeding and is considered one of the greatest contributions of quantitative genetics. The use of different selection strategies to verify which one provides the greatest gains for traits of interest is fundamental for breeders and helps them selecting the available genetic material (Bhering et al. 2012). Even with the efficiency of selection indices to identify superior genotypes, no reports are found in works on guava using this approach.
Thus, the best selection method is the one that predicts satisfactory gains for all traits, including those negatively correlated. Since selection criteria predict genetic gains, they also provide effective guidance for breeding programs and decisions on the adoption of successful selective schemes (Cruz et al. 2012), so that the best progenies and the best individuals within this progeny can be identified.
Several studies with fruit trees have been conducted in order to select promising genotypes by comparing different selection criteria in different fruit trees, including yellow passion fruit (Neves et al. 2011) and papaya (Vivas et al.
2013). Distinct selection strategies were evaluated in full-sib progenies of passion fruit in which the selection index provided positive gains in full-sib progenies of yellow passion fruit (Krause et al. 2012).
In all selection criteria analyzed, the estimates of genetic gains were higher for total fruit yield and skin thickness (Table 3). The same was observed in the work of Verardi et al. (2011). It evaluated agronomic traits in rubber tree progenies and found greater gains for girth and bark thickness. In both, the traits that achieved higher genetic gains have the highest coefficient of genotypic variation and high values for the estimates of coefficients of heritability, which may explain the higher genetic gains. It can be observed that, among progeny, there were high heritability values, thus, the selection among progenies promotes higher genetic gains than within progenies.
As expected, direct selection gains were greater than indirect ones. The highest gain expectations, considering the direct selection, were related to skin production and thickness, whose values were 25.17 and 24.72, respectively. The other traits presented low magnitude gains, ranging from 1.11 to 3.22. It results from the low genetic variability found within progenies, which is observed in the individual heritability estimate within progeny (Table 1).
The direct selection in fruit production provided a negatively correlated response between all traits (Table 3), except for skin thickness, due to the genetic correlation between the traits. As expected, the selection for production resulted in unfavorable gains for all traits, since guava
*Significant at 5% probability; **Significant at 1% probability by the t-test.
table 2. Estimates of phenotypic, genotypic and environmental correlations in full-sib family averages, related to the fruit traits studied, in guava.
trait Correlation Mesocarp
thickness
Skin
thickness Pulp yield
ratio between fruit length and fruit diameter
Total production
Phenotypic −0.3219 0.419** −0.1207 −0.1523
Genotypic −0.4926** 0.4584** −0.2213* −0.2531*
Environmental 0.1966 0.1648 0.2267* 0.4655**
Mesocarp thickness
Phenotypic −0.425** −0.425** −0.0906
Genotypic −0.5499** −0.2874* −0.2045*
Environmental 0.161 −0.808** 0.3962*
Skin thickness
Phenotypic 0.2414* 0.2414*
Genotypic 0.2918* 0.5664**
Environmental −0.0198 0.5453**
Pulp yield
Phenotypic 0.0188
Genotypic 0.0289
cultivation disregards increased skin thickness. This was the only variable that achieved positive gains. Thus, direct selection for production could not obtain satisfactory gains for the other traits. The same was observed by Bhering et al. (2012) when they performed direct selection in physic nut. Considerable gains were obtained for yield based on direct selection, but there were no gains for weight of 100 seeds.
The correlated responses provided very low and even negative gains in some traits, as shown in the analysis of variable pulp yield, which obtained 1.11 in the direct selection, and gains lower than 1 for the other traits (Table 3). This shows that the selection based on only one variable was inadequate because it led to a higher final product when considering the number of fruits per plant and generated unfavorable responses in other traits. These results indicate that methods that combine favorable expected gains should be used in the evaluation of these progenies.
Multivariate criteria, known as selection index, was also a strategy used in this study. Among the selection indices, it was used the classic index, proposed by Smith (1936) and Hazel (1943). It presented higher expectations of genetic gains for all traits, except for pulp thickness, which had lower gains, compared to those of direct selection (Table 3). Bhering et al. (2012) compared direct selection and the selection index in
order to choose the best physic nut genotypes in 175 families. They also found higher estimates of genetic gains using the selection index and did not obtain favorable gains from the direct and indirect selection processes.
According to Cruz et al. (2012), the estimation of reliable selection indices depends on the variances and convariance genetic and phenotypic matrix that are well-estimated, and corrected designation and well-established to economic weights. Cruz et al. (2012) suggest using the genetic variation coefficients as economic weights, similarly to this study, since they are directly proportional to the genetic variance of the traits. However, Bhering et al. (2012) verified that the use of the coefficient of genetic variation as economic weight was inadequate, since it did not provide satisfactory genetic gains.
With the selection index, it was possible to obtain small genetic gains with traits negatively correlated. When the genotypic variation coefficient was used, the classic index estimated the highest total gain and generated the highest gain in production (Table 3). However, this index provided greater increase for fruit skin thickness (12.82%). ISH2 obtained
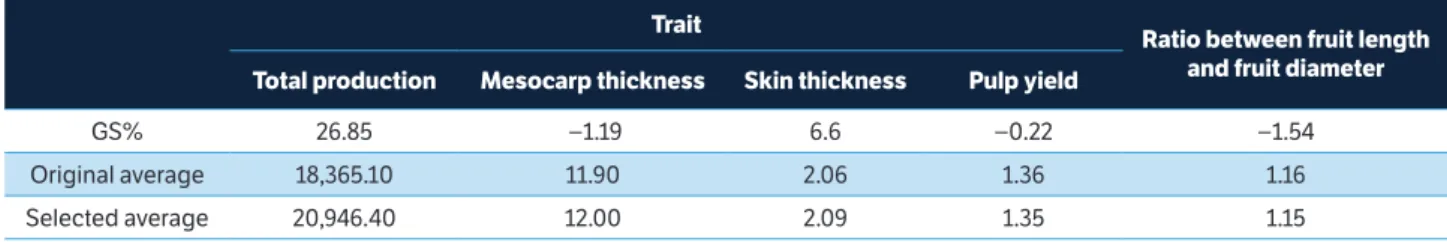
favorable genetic progress and provided satisfactory genetic gains for all traits assessed (Table 4). This index allowed predicting reasonable gain for total fruit production and
Selection
expected response (%) ratio between fruit
length and fruit diameter
total gain (%)
total production Mesocarp
thickness
Skin
thickness Pulp yield
Total production 25.17 −1.83 5.32 0.18 −0.55 27.74
Mesocarp thickness −5.61 2.98 −11.06 −0.53 −0.97 −15.19
Skin thickness 13.57 −2.47 24.72 0.76 2.37 38.95
Pulp yield −3.06 −0.60 3.73 1.11 −1.02 −0.27
Ratio between fruit length
and fruit diameter −6.51 −0.81 10.98 −0.11 3.22 6.66
ISH1 28.66 −2.32 12.82 −0.06 −0.57 38.53
ISH2 26.85 −1.19 6.62 −0.22 −1.54 29.33
table 3. Estimates of genetic advances with direct and indirect selection and classic index between and within full-sib families of guava.
ISH(1,2) = Classic index — Smith (1936) and Hazel (1943); ISH1 = Coefficient of genetic variation; ISH2 = Economic trial values (1; 5,000; 1; 5,000; 1).
trait
ratio between fruit length and fruit diameter
total production Mesocarp thickness Skin thickness Pulp yield
GS% 26.85 −1.19 6.6 −0.22 −1.54
Original average 18,365.10 11.90 2.06 1.36 1.16
Selected average 20,946.40 12.00 2.09 1.35 1.15
lower increase for fruit skin, compared to other selection criteria, without significantly affecting the other variables. This occurred because the values were tested until satisfactory predicted gains for total fruit yield were achieved in a way that the selection did not negatively affect other traits, since this variable has a negative correlation. Freitas et al. (2012), in order to select the best genotypes of passion fruit, compared different weights in the selection index. They indicated that the CVg as weights are inappropriate, providing smaller
weight gains by trial. Berilli et al. (2013), in selection of full-sib progenies of maize, also used random weights for each trait, by trial, to estimate the selection indexes and get height gains.
Even with the use of different selection criteria, a slight variation was observed in the estimation of production gains and total predicted genetic gains. Direct selection and ISH1 selected the same 4 progenies, but different individuals
(Table 5). ISH2, by trial, selected 2 progenies already selected,
thus, confirming the superiority of these families for the evaluated traits. Almeida et al. (2014), in the selection of full-sib families of sugar cane, found that the various economic weights predicted similar genetic gains and identified the same families when different weights were used for the application of the classic index.
was higher when the index was used (Bhering et al. 2012). The classic index was the criterion that provided satisfactory gains in the population under study.
For guava cultivation, priority should be given to the achievement of gains in the number of fruits, accompanied by increased fruit mass, so as to increase productivity and acceptance by the consumer market. The results of this study demonstrate that the selection between and within guava progenies can be implemented aiming to obtain satisfactory and balanced genetic gains between the variables analyzed, by using the classic index.
COnClUSiOn
The variability found in the guava population, both between and within the progenies, allowed the use of selection strategies with satisfactory gains, so as to concentrate favorable alleles for traits of agronomic interest. The maximization of individual gains was observed with the use of direct selection processes. However, when indirect selection was applied, no favorable gains were obtained and some traits obtained even negative gains. Thus, the direct and indirect selection could not achieve a distribution of expected gains that addressed the objectives of this work. The classic selection index proposed by Smith (1936) and Hazel (1943) was the selection criterion that presented the best results for gains in fruit number and fruit weight, being indicated as the most appropriate selection strategy for genetic breeding in the studied population.
ACKnOWledgeMentS
To the Rio de Janeiro Research Foundation (FAPERJ) for the scholarship provided, to the Coordination for the Improvement of Higher Education Personnel (CAPES) and the National Council for Scientific and Technological Development (CNPq) for the financial support for the experiment.
ISH1 = Coefficient of genetic variation; ISH2 = Economic trial values (1; 5,000; 1;
5,000; 1).
table 5. Direct selection for total fruit production per plant, Smith
index (1936) and Hazel (1943) with 2 economic weights (ISH1;2),
selected progenies and percentage gain jointly estimated for the 7 traits assessed.
Method Selected progeny total gain (%)
Direct selection 8 - 10 - 2 - 17 - 1 27.74
ISH1 10 - 8 - 2 - 17 - 6 38.53
ISH2 8 - 10 - 15 - 2 - 12 29.33
In a certain way, no selection criterion is superior to the others for genetic gain estimation. The selection strategy depends on the population studied and its parameters. Thus, in some works, the direct and indirect selections were efficient (Berilli et al. 2013). In other works, gain prediction
Ali, D. O. M., Ahmed, A. R. and Babikir, E. B. (2014). Suitability of local Sudanese guava (Psidium guajava L.) cultivars for
reFerenCeS
Almeida, L. M., Viana, A. P., Amaral Júnior, A. T. and Carneiro Júnior, J. B. (2014). Breeding full-sib families of sugar cane using selection index. Ciência Rural, 44, 605-611. http://dx.doi.org/10.1590/ S0103-84782014000400005.
Berilli, A. P., Cândido, G., Pereira, M. G., Trindade, R. S., Costa, F. R. and Cunha, K. S. (2013). Response to the selection in the 11th
cycle of reciprocal recurrent selection among full-sib families of maize. Acta Scientiarum. Agronomy, 35, 435-441. http://dx.doi. org/10.4025/actasciagron.v35i4.17489.
Bhering, L. L., Laviola, B. G., Salgado, C. C., Sanchez, C. F. B., Rosado, T. B. and Alves, A. A. (2012). Genetic gains in physic nut using selection indexes. Pesquisa Agropecuária Brasileira, 47, 402-408. http://dx.doi.org/10.1590/S0100-204X2012000300012.
Cabral, P. D. S., Soares, T. C. B., Lima, A. B. P., Soares, Y. J. B. and Silva, J. A. (2011). Path analysis of grain yield of common bean (Phaseolus
vulgaris L.) and its components. Revista Ciência Agronômica, 42,
132-138. http://dx.doi.org/10.1590/S1806-66902011000100017.
Campos, B. M., Viana, A. P., Quintal, S. S. R., Gonçalves, L. S. A. and Pessanha, P. G. D. O. (2013). Quantification of the genetic divergence among guava accessions using Ward-MLM strategy. Revista Brasileira de Fruticultura, 35, 571-578. http://dx.doi.org/10.1590/ S0100-29452013000200028.
Cavalcante, M., Andrade Lira, M., Santos, M. V. F., Pita, E. B. A. F., Ferreira, R. L. C. and Tabosa, J. N. (2012). Coefficient of repeatability and genetic parameters in elephant grass. Pesquisa Agropecuária Brasileira, 47, 569-575. http://dx.doi.org/10.1590/ S0100-204X2012000400013.
Cruz, C. D. (2013). GENES - a software package for analysis in experimental statistics and quantitative genetics. Acta Scientiarum. Agronomy, 35, 271-276. http://dx.doi.org/10.4025/actasciagron. v35i3.21251.
Cruz, C. D., Regazzi, A. J. and Carneiro, P. C. S. (2012). Modelos biométricos aplicados ao melhoramento genético. Viçosa: UFV.
Freitas, J. P. X., Oliveira, E. J., Jesus, O. N., Cruz Neto, A. J. and Santos, L. R. (2012). Development of a base population for recurrent selection in yellow passion fruit using selection indexes. Pesquisa Agropecuária Brasileira, 47, 393-401. http://dx.doi.org/10.1590/ S0100-204X2012000300011.
Hazel, L. N. (1943). The genetic basis for constructing selection indexes. Genetics, 28, 476‑490.
Hung, T. D., Brawner, J. T., Meder, R., Lee, D. J., Southerton, S., Thinh, H. H. and Dieters, M. J. (2015). Estimates of genetic parameters for growth and wood properties in Eucalyptus
pellita F. Muell. to support tree breeding in Vietnam. Annals
of Forest Science, 72, 205-217. http://dx.doi.org/10.1007/ s13595-014-0426-9.
Instituto Brasileiro de Geografia e Estatística (2014). Produção nos estabelecimentos agropecuários com mais de 50 pés existentes: Brasil — 2006; [accessed 2015 Jun 12]. http://www.sidra.ibge. gov.br/bda/agric/default.asp?t=2&z=t&o=11&u1=1&u2=1& 3=1&u4=1&u5=1&u6=1
Krause, W., Souza, R. D., Neves, L. G., Carvalho, M. D. S., Viana, A. P. and Faleiro, F. G. (2012). Selection gain in the intra population genetic breeding of yellow passion fruit. Pesquisa Agropecuária Brasileira, 47, 51-57. http://dx.doi.org/10.1590/ S0100-204X2012000100008.
Neves, L. G., Bruckner, C. H., Cruz, C. D., Viana, A. P. and Barelli, M. A. A. (2011). Gain prediction with different selection index for yellow passion fruit characterization. Revista Brasileira de Fruticultura, 33, 1322-1330. http://dx.doi.org/10.1590/S0100-29452011000400033.
Pessanha, P. G. O, Viana, A. P., Amaral Júnior, A. T., Souza, R. M., Texeira, M. C. and Pereira, M. G. (2011). Assessment of genetic diversity in access to Psidumspp. via RAPD markers. Revista Brasileira de Fruticultura, 33, 129-136. http://dx.doi.
org/10.1590/S0100-29452011000100018.
Quintal, S. S. R. , Viana, A.P., Campos, B.M., Vivas, M. and Amaral, A. T. (2016). Seleção via modelos mistos em famílias segregantes de goiabeira baseada em características de produtividade e qualidade. Revista Brasileira de Fruticultura [ahead of print].
Ramos, D. P., Silva, A., Leonel, S., Costa, S. M. and Damatto Júnior, E. V. (2010). Yield and fruit quality of ‘Paluma’ guava pruned at different times in subtropical climate. Revista Ceres, 57, 659-664.
http://dx.doi.org/10.1590/S0034-737X2010000500015.
Santos, G. A., Resende, M. D. V., Silva, L. D., Higa, A. and Assis, T. F. (2015). Genotypes x environments interaction for productivity of Eucalyptus l’hér. Clones in the State of Rio Grande do Sul, Brazil. Revista Árvore, 39, 81-91. http://dx.doi. org/10.1590/0100-67622015000100008.
Union Internationale pour la Protection des Obtentions Vegetales
(1987). Guidelines for the conduct of test for distinctness,
homogeneity and stability. Guava (Psidium guajava L.). Geneva,
Switzerland; [accessed 2016 Jul 20]. http://www.upov.int/edocs/
tgdocs/en/tg110.pdf
Vencovsky, R. (1987). Herança quantitativa. In E. Paterniani and G.
P. Viegas (Eds.), Melhoramento e produção do milho (p. 135-214).
Campinas: Fundação Cargill.
Verardi, C. K., Scaloppi Junior, E. J. and Gonçalves, P. S. (2011). Prediction of direct and indirect genetic gains and genotypic correlations in rubber tree progenies. Pesquisa Agropecuária Brasileira, 46, 1076-1081. http://dx.doi.org/10.1590/ S0100-204X2011000900015.
Vivas, M., Silveira, S. F., Vivas, J. M. S. and Pereira, M. G. (2013). Prediction of genetic gain and progenies selection of papaya for resistance to black-spot. Tropical Plant Pathology, 38, 142-148.