© 2013 Pattanasethanon and Chanthinok, This open access article is distributed under a Creative Commons Attribution (CC-BY) 3.0 license
doi:10.3844/jcssp.2013.114.121 Published Online 9 (1) 2013 (http://www.thescipub.com/jcs.toc)
Corresponding Author: Petcharat Pattanasethanon,Department of Computer Business, Faculty of Accountancy and Management, Mahasarakham University Mahasarakham, Thailand
AN EVALUATION OF THE INFORMATION
SYSTEMS FOR TEACHING AND LEARNING
ONLINE OF THE PUBLIC UNIVERSITY
Petcharat Pattanasethanon and Kriangsak Chanthinok
Department of Computer Business,
Faculty of Accountancy and Management, Mahasarakham University, Thailand
Received 2013-01-06, Revised 2013-02-16; Accepted 2013-03-11
ABSTRACT
This research aims to evaluate the online information system for instructors and students at the undergraduate level of public Universities in Thailand. Tools and data that are collected in this research consist of two parts. The first part is the creation of a web application to educate teachers and students online, while the second part is to create a questionnaire as a tool for assessing the satisfaction of using the online surveys and a questionnaire prepared directly for the students. From collecting over 496 samples of analysis, we found that most of the students and professors that use the online information system in this group are highly satisfied. Overall, the level of significance at 0.5 was obtained from this study, which can be used as a guide for evaluating other different angle of educational activities in the future.
Keywords: Evaluation, Information System Online, Web Application, Acceptance Behavior
1. INTRODUCTION
Information system has been engaged in major parts of our society such as the educational system, the security system, banking system. The rapid change in a form of information system has influenced our daily lives in various ways (Agre, 2002). Knowledge is not restricted only in the classrooms anymore. It can approach us anywhere and everywhere. The education values in the teaching and learning activity via the Internet by students, instructors and classmates can be consulted, shared and exchanged between one and another, which is similar to a regular classroom but in a different form of information delivery (Son, 2008). In addition, by using modern communication and technology, learning and knowledge management is the most cost-effective and limitless form of communication. This research introduces the use of information system technology in public Universities, as they are government organizations that literally provide education and manipulate media as a tool to educate both teachers and
importantly, class’s homework submission and request for appointment with the lecturer can be done online (Gregg et al., 2009). The subsequences of this system are that students tend to pay more attention in regular classes and due to the convenient access of this information system, most students are more independent and capable of revising lessons on their own. Meanwhile, lecturers themselves are more deliberate and it is easier for them to plan the syllabus (Muir-Herzig, 2004). They also can upload what has been left out in class to make sure that the lessons are equally delivered in every section. The second part of this research is the questionnaire and evaluation part. This part creates a survey that allows both instructors and student to complete the questionnaire regarding the system. The total of 496 individuals from Mahasarakham University (2012) have manifests that this system is highly satisfied and that it is effective and appropriate for their needs.
The aim of this research is to evaluate the online information system of instructors and students. After developing the online information system for 3 years, we found out that the population of this system increases annually, which indicates that the online information system have taken an important role in our lives and it includes guidelines for lecturer to gain confidence in creating and providing the diversity of education through certain aspects of learning behavior. This system influences students to study with their maximum potential and encourages them to be engaged in individual learning process. Since, self- study is a requirement and characteristic that the students in the modern days should have, if that student is already eager to learn and they were to be practiced and trained seriously, the knowledge they obtained would last their whole lives. Online information system is an innovative education that is expected to be creative. The creation of other new academic subject is designed to satisfy the needs of student and lecturer to raise the academic standard and the quality of education system at Mahasarakham University and other institution in the country to achieve their goal effectively and efficiently.
1.1. Relative Works
The conception of information system has 2 variables; the instructors’ and students’ statuses. These statuses have an impact on the six-part evaluation of the online information system for instructors and students, which consists of the expectations about the performance of the online information system, expectation about the users effort, attitude toward the use of online information
learners and developers by using UTAUT theory. As a consequence, studying through E-learning in working places is acceptable and holds a potential growth in terms of population (Wagner et al., 2008).
2. MATERIALS AND METHODS
In the first part, this research has developed the information system to browse online by registering the domain name “www.forstd.net” and has developed into a web application for students and teachers inside the faculty of accounting and management in Mahasarakham University, Thailand. The structures are shown in the picture below.
Figure 1 manifests the development model of the online information system. We have created this website as a center of media for the instructor to registered. The domain is then registered for using as a reference to other website that is on the network. The name www.forstd.net means networking and collaborative learning for students and instructors. And by registering for the domain, it also comes with renting a web server or hosting for storing files and data under the Linux operating system. This implies that it has the capability to request and response efficiently. Meanwhile, the researchers also use PHP language in developing the system and mySql as a database for storing data of registered members and other important data such as subject details, class documents, FAQ and transferred data, which these database can be add, remove, edit and display on the website. The principle of creating the online information system of each individual may be dissimilar in accordance with the agenda of the users and must be unique to those who already have registered. Each instructor will receive a URL: uniform resource locator’s, according to the user’s himself. It must not be similar to the registered ones. This is done by creating the folders of each individual for representing their pictures, documents, Question and Answers of each person individually, in spite registering for the same service and website.
Figure 2 is the actual application of the model build in reference of the first picture. It is open to all students, teachers and ordinary viewers to test this system by just registering the user. Users will receive an extra storage in the website to present varieties of learning and teaching materials. The second part is the evaluation of the online information system from guest that enters the website “www.forstd.net.” Both students and instructors are required to answer some online questionnaires. The questionnaires are made directly to
students from each instructor in the classroom, which the details are as listed below.
2.1. Population Sampling
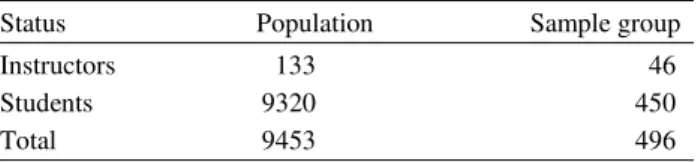
Population sample is denoted through students and instructors from Mahasarakham University year 2555, with the total of 133 instructors and 9320 students. The sample group in this research is 450 students and 46 lecturer of the MSU as described in Table 1 below.
Table 1 represent the data of population and sample groups by dividing into 2 parts, which includes 133 instructors and 9320 students. A sample calculation for a confidence level of 95 percent and 5 percent deviation equal to the number of sample is 46 teachers and 496 students in the sample were men.
2.2. Building Tools for Storing Data
A research questionnaire assesses the use of information technology in teaching and learning online. It is generated according to the methods of questionnaire and the accuracy of the tools. Two experts will have to consider and determine based on the content validity. The appropriateness of the language used is analyzed through the IOC and the selection is more than or equal to 0.5.
2.3. Data Analysis
Data analysis is the statistical analysis of survey research data to personalize the percentage of gender, age, social status and the number of users in information systems. The questionnaires used in evaluating the information system in teaching and learning online are analyzed for the mean (average), standard deviation (One-Way Analysis of Variance) and the ANOVA (F-test) where they are used as a query tool with message options to choose upon the estimation standard (rating scale) up to 5 levels as described below:
• Points imply “Highly Satisfied • Points indicate “Satisfied • Points refer to “Neutral • Points mean “Less Satisfied
• Point is the equivalent to “Least Satisfied
Table 1. The amount of population and sample groups
Status Population Sample group
Instructors 133 46
Students 9320 450
Fig. 1. Information system model for online classroom instructions
Fig. 2. The outline of the application according to the model
3. RESULTS AND DISCUSSION
The result in the first part is about the ability of the information system through teaching and learning online as described and listed as follow:
• The instructor has their own website in the online information system server within a minute by just registering into the server and should not be the same as the previous registered user
• Instructors are provided with an opportunity to publish the documents in the system and create a course that teaches students diversely
• Instructors can inspect the number of documents that to be used and manifested online
• Grading papers for students is available 24/7 • Instructors and students can do a live chat through
the system
• Students can view, download and subscribe documents from their instructors
• Digital file types are eligible for submission through the upload section
• Students are able to suggest, question and raise concerns to instructors or expertise in certain fields to answer it
Table 2. The evaluation of our system through questionnaires based on the users’ social status, age, gender and access frequency
Instructor Student Social --- --- status Amount Percent Amount Percent Gender Male 9 19.50 98 21.73
Female 37 80.50 352 78.27 Age Under 20 - - 207 46.00
years old
Age 21-30 - - 243 54.00 Age 31-40 18 39.10 - - Age 41-50 27 58.70 - - Age 51-60 1 2.20 - - Age above - - - - 61 years old
Frequency Less than - - - - of access once a week
Daily - - - -
Once a week - - - - Twice a week - - 67 14.89 3 days/ week 9 19.57 95 21.11 4 days/ week 12 26.08 88 19.56 5 days/ week 19 41.31 146 32.44 6 days/ week 6 13.04 54 12.00 Total 46 100.00 450 100.00
The second part is an evaluation of the information system of teaching and learning online with the survey research. After collecting data, the analyzed results are as follows.
The results obtained from the analyzed data through system evaluation in the public Universities can be apprehended as follows.
Table 2 displays the summary from the sample group
of instructors and students that has been handed the survey. Overall, most of the instructors’ gender is female that has up to 80.5 percent in total, while the other 19.5 are male. However, the age group in this survey varies among participation sample. At ages of 31-40 years, there are about 18 participants or approximately 39.1 percent in total, while from ages 41-50, 9 more than participants are active in the 30s, which is 58.7 percent. On a contrary, from ages 51-60, only one participant or 2.2 as a percentage is active. In addition, another factor that is hardly ignored is the number of access in the system. Most people use this system for approximately 5 days per week or 41.31 percent, while the other 26.08 percent of the group accesses 4 days per week and 19.57 percent for 3 days. The least access is denoted as 6 days per week or only 13.04 percent. Likewise, 78.27 per cent of the female students actively participate in the survey. Students with the age above 20 have dominantly participated in this survey. The other 46% are under 20
years of age. Obviously, 32.44% claimed that he frequency of their access is as much as 5 days per week, while 12% of students manifest the frequent of their access at 6 days per week.
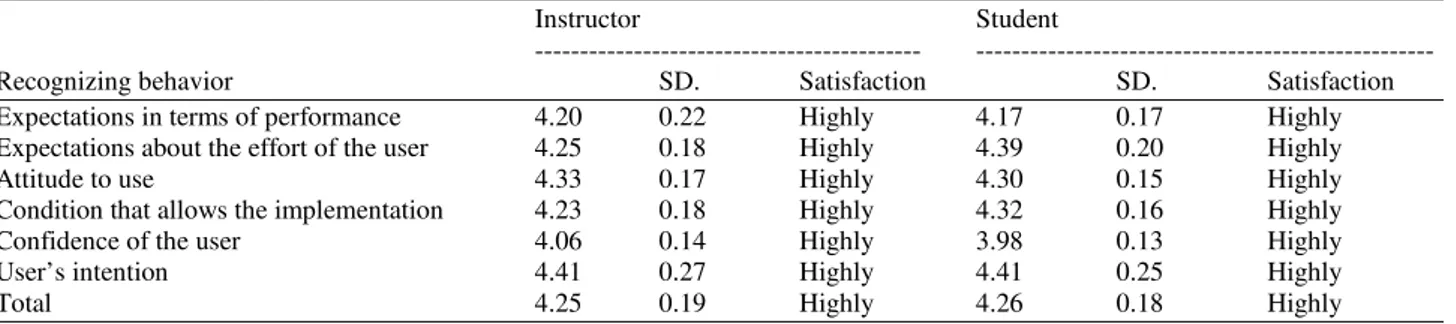
In Table 3, the analysis of accepting behavior of instructor and student in the public university shows the standard deviation and satisfactory level according to the users’ status. It can be implied that the overall performance is acceptable in a high level of satisfaction. The mean(average) of instructors is 4.25 and the students’ mean is 4.26, which implies that the information system for online education has satisfy the instructor and student profusely and also the recognition of the online information system helps improving the education quality effectively.
From Table 4, we can interpret the table as a summary of comparing the behavior of the online information system acceptance from the survey. The survey is divided into 5 sections, which considers the index of “F” (F-test) and index “P” (P-test).The index f is used to compare the ratio of the variance of each of the different questions that affect the behavior of the system’s online activities. The data for each group’s question will have the “F” index that is between 0.71 to 1.67, which means that the statistic of satisfy opinion is high. And based on the result of the query, it has the same direction and independent variables. The index “P” refers to the probability of the occurrence of each group is independent of each other with values between 0.06 and 0.267. However, the data considered in this study is statistically in terms of significance level at 0.05.
Table 3. Shows the recognition of information system through online education of students and instructor
Instructor Student
--- ---
Recognizing behavior SD. Satisfaction SD. Satisfaction
Expectations in terms of performance 4.20 0.22 Highly 4.17 0.17 Highly
Expectations about the effort of the user 4.25 0.18 Highly 4.39 0.20 Highly
Attitude to use 4.33 0.17 Highly 4.30 0.15 Highly
Condition that allows the implementation 4.23 0.18 Highly 4.32 0.16 Highly
Confidence of the user 4.06 0.14 Highly 3.98 0.13 Highly
User’s intention 4.41 0.27 Highly 4.41 0.25 Highly
Total 4.25 0.19 Highly 4.26 0.18 Highly
Table 4. Shows data behavior regarding the users’ acceptability of the online information system
Acceptability F P
Part1. Expectations regarding the performance of the system
Stability of continuous accesses 1.37 0.221
Stability of file upload and submission 1.19 0.176
Part 2. Expectations for the effort of the user
The menu or category of information in this website 0.71 0.232
Convenient of accessing data 1.05 0.218
Part 3: Attitude towards the use of information technology in the education system
Speed browse for spectacular file 0.87 0.236
Convenient of the site access 1.67 0.060
Part 4. An environmental that provide the process (operation)
Convenience in downloading content 1.12 0.168
Part 5. The user’s confidence of information system in teaching and learning
Monitoring and security 1.07 0.141
Part 6. The satisfactory level for applying information technology into educational system
Satisfaction in online information systems 1.08 0.267
Table 5. Compares behavior of acceptability in using the information system technology in learning and teaching of the instructor’s group
Acceptability Mean of square SS df MS F Prob
Information Between groups 0.613 2 0.306 59.78 0.00
system as a tool Within groups 0.055 4 0.013 2.70 0.06
for education Total 0.668 6
Table 6. Compares the acceptability behavior of accessing the information system technology in learning and teaching of the student’s group
Acceptability Mean of Square SS df MS F Prob.
Information Between groups 0.403 2 0.201 20.63 0.00
technology as a Within Groups 0.072 4 0.018 1.84 0.16
tool for education Total 0.475 6
Table 6 is the statistic for the acceptability behavior in terms of accessing this information system technology in teaching and learning for the student’s group. The index “P” has obtained the value of “0”, which means that the populations in the student’s group accept and feel supportive with the information system in teaching and learning (highly). While the Index “F” is the values of comparing variance of two groups. The group (df), with the value of 20.63, manifests that the populations in
index value of 0.16 as the “F” index is 1.84 and for the SS and MS has a value of 0.055 and 0.013, respectively.
4. CONCLUSION
The first part of this evaluation for information system regarding online teaching of instructors and students at public universities can be concluded as the context described below:
• The results of this research lead to the development of a network and a platform of teaching for instructors at Mahasarakham University. Every institution which instructors can share their knowledge and publication of scholarly works together can also implement this system to effectively provide an alternative path for education. • It is a dominant medium for those who want to learn
wider than in classrooms and it encourages interaction such as interaction with learning and/or teaching and interacting with lesson content and learning materials in the form of meeting to discussion and the exchange of ideas (Ellis et al., 2009) and in the form of teaching other than rigid teaching. For example, an exercises or tests those teachers provide to students
• This opens up opportunities for students to display their work among classmates easily. It can be expressed worldwide. Therefore, it can lead student’s motivation to external knowledge; Students has an opportunity to see others work, which can help improve their work better
• It allows opportunities for students to access through expertize in various field. The student can ask for any information that they need from experts directly. Which is hardly possible in the conventional classroom teaching style. It also saves time and financial budget for students, while comparing with inter-communication in the same manner
• The instructor can reconstruct their course content easily because the data on the site is dynamically created, thus the instructor can update their course content to student at any time. While the student themselves will also figure out the changes or movement at all time. In addition, learners can interact and comment on the content of learning material, which is more flexible than traditional learning. Besides, changes that satisfy the needs of students are important
• This is helpful for changing the paradigms of learning, learning is student-centered and
encourages lifelong learning (Life Long Learning) (Collinsa and Halverson, 2010)
• Reduce the usage of hard copy submission and global warming
• Reduce the cost to instructor who wanted to teach online by not hosting or registering the domain, but applying it to the RLM (URL) into their own
In the second part of the analysis of query results, we can summarize the content as follows. Survey respondents include professors and students. The majority of the respondents were women and the amount of individual answering the survey is divided to the female instructor of 80.5 percent, female student 78.27 percent, while male instructor are 19.5 percent and students are 21.73 respectively.
The questionnaires for evaluating the behavior of adopting information technology in teaching and learning are divided into 6 parts:
• Expectations regarding the performance of the system
• Expectations about the effort of the user
• Attitude towards the exploitation of information technology in teaching and learning
• Environment that helps achieving operations • Confidence of users in using information system
technology for teaching and learning
• The intention to use ICT in teaching and learning
The result of the evaluation of adopting information system for online education purpose of professor and students are split into 6 parts. The acceptance was in a profoundly satisfying level and the variance of opinion in response to the question is low (Table 3). Information on the behavior of the online system were evaluated according to the purpose of the six independent components and is directly related to the behavior of the online system by the “F” index value is between 0.71 to 1.67 and “P” index values ranged from 0.06 to 0.267 (Table 4). In conclusion, the behavior of accepting the information system in teaching online on both instructors and students are at the large extent. By using analysis of variance of the data as a whole, the differences are statistically recognized with a significant level at 0.05.
5. ACKNOWLEDGEMENT
6. REFERENCE
S
Agre, P.E., 2002. Real-time politics: The internet and the political process. Inform. Soc., 18: 311-331.
AlAwadhi, S. and A. Morris, 2008. The Use of the UTAUT Model in the adoption of e-Government services in Kuwait. Proceedings of the 41st Annual Hawaii International Conference on System Sciences, Jan. 7-10, IEEE Xplore Press, Waikoloa, HI., pp: 219-219. DOI: 10.1109/HICSS.2008.452 Collinsa, A. and R. Halverson, 2010. The second
educational revolution: Rethinking education in the age of technology. J. Comput. Assis. Learn., 26: 18-27. DOI: 10.1111/j.1365-2729.2009.00339.x Davis, F.D., 1989. Perceived usefulness, perceived ease
of use and user acceptance of information technology. MIS Q., 13: 319-340. DOI: 10.2307/249008
Ellis, J., M. Iturriza, R. Allen, A. Bermingham and K. Brown et al., 2009. Evaluation of four real-time PCR assays for detection of influenza A(H1N1)v viruses. Euro. Surveill,14: 19230-19230.
Gregg, A., J. Mundie and J. Xia, 2009. Overcoming the quantitative divide: Penn State’s approaches to online mathematics. Proceedings of the 25th Annual Conference on Distance Teaching and Learning, (DTL’ 09), pp: 1-5.
Khongmalai, O. and S. Poungmali, 2009. Factors influencing the intention on e-learning continuation: A comparative analysis of learners and developers. Proceedings of the International Conference on Industrial Globalization and Technology, Aug. 19-21, (GT’ 09), Xian, China, pp: 23-35.
Muir-Herzig, R.G., 2004. Technology and its impact in the classroom. Comput. Educ., 42: 111-131. 10.1016/S0360-1315(03)00067-8
Oblinger, D.G. and J.L. Oblinger, 2005. Educating the Net Generation. 1st Edn., Educause, ISBN-10: 0967285321, pp: 264.
Onkhao, W., 1999. Status, needs and problems in media utilization of royal Thai Air Force Colleg of Nursing. Master Thesis, Kasetsart University, Thailand.
Sawasdiyakorn, T., 1998. The Survey of Problem and Need on Instructional Media Utilization of the Undergraduate Architectural Instructors in the Higher Educational Institutes. The Ministry of University Affaires.
Son, J.B., 2008. Using web-based language learning activities based language learning activities. Int. J. Pedagogies Learn., 4: 34-43.
Sumak, B., G. Polancic and M. Hercko, 2010. An empirical study of virtual learning environment adoption using UTAUT. Proceedings of the 2nd International Conference on Mobile, Hybrid and On-Line Learning, Feb. 10-16, IEEE Xplore Press, Saint Maarten, pp: 17-22. DOI:10.1109/eLmL.2010.11 Wagner, N., K. Hassanein and M. Head, 2008. Who is