Adaptability and stability of sweet sorghum cultivars
Vander Fillipe de Souza1*, Rafael Augusto da Costa Parrella2, Flávio Dessaune Tardin², Márcia Regina Costa3, Geraldo Afonso de Carvalho Júnior4 and Robert Eugene Schaffert²
Received 15 February 2012 Accepted 18 October 2012
Abstract - The objective of this study was to evaluate the phenotypic stability and adaptability of 25 sweet sorghum cultivars of Em-brapa Maize and Sorghum. The experiments were conducted in ive Brazilian environments, three in the state of Minas Gerais, and the others in Sinop, Mato Grosso and Pelotas, Rio Grande do Sul. Fresh biomass yield (FBY), and total soluble solids (TSS) of the juice were evaluated in a randomized complete block design with three replications. Analysis of variance showed signiicant genotype by environment interaction for both traits. According to the Annicchiarico methodology analysis, genotypes CMSXS634, BRS506, and CMSXS646 were the most stable and adapted for FBY and TSS concomitantly; CMSXS634 being more adapted to favorable environ-ments and CMSXS646 being more adapted to unfavorable environenviron-ments.
Key words: Sorghum bicolor, genotype x environment interaction, Annicchiarico, biofuel, ethanol.
1 Universidade Federal de São João del-Rei, Departamento de Engenharia de Biossistemas, Praça Dom Helvécio 74, 36.301-160, São João del Rei, MG, Brazil. *E-mail: [email protected]
2 Embrapa Milho e Sorgo, MG 424, km 45, 35.701-970, Sete Lagoas, MG, Brazil
3 Universidade Estadual de Montes Claros, Departamento de Ciências Agrárias, Campus de Janaúba, Reinaldo Viana 2630, 39.440-000, Janaúba, MG, Brazil 4 Texas A&M University, Department of Soil and Crop Sciences, College Station, TX, 77843-2474, USA
INTRODUCTION
Among the main energy crops, sweet sorghum stands out as a very promising feed stock, resulting in many studies by different researches worldwide. Studies related to the bioenergy potential of sweet sorghum for ethanol production have been conducted in Europe (Venturi and Venturi 2003), Asia (Zhang et al. 2010), Oceania (Thomas 2009), Africa (Diaz-Chaves and Jamieson 2010), and the Americas (Kim and Day 2010, Guigou et al. 2011).
Sweet sorghum, similar to sugar cane, has succulent stems with the presence of directly fermentable sugars, which allows for harvesting and processing with the same infrastructure for ethanol production in sugar cane mills (Kim and Day 2010) and sugar cane ethanol plants. Sorghum is a short cycle crop, approximately four months, with established production systems for forage cultivars. The sorghum crop is established from seed and the production system is fully mechanized (Ratnavathi et al. 2010). For this reason, sweet sorghum may be an excellent potential to supply raw feed stock during the off season of sugar cane mills in Brazil from February to April, and thereby strengthen the national
production of ethanol, reduce the idle period of these mills,
and reduce luctuations of ethanol price.
Commercial release of new sweet sorghum cultivars requires understanding the performance of potential geno-types in different environmental conditions. Genotype by environment interactions can complicate the recommendation of cultivars for different environments, making adaptability and stability analyses necessary. The study of adaptability
and stability allows the identiication of genotypes with predictable behavior in speciic or general environments, and the identiication of genotypes sensitive to positive
environmental variations (Cruz et al. 2004).
There are several methods for analyzing adaptability and stability of genotypes when grown in different envi-ronments. The choice of using certain analytical method of experimental data depends mainly on the number of envi-ronments available, the accuracy required, and the type of information desired. Ideally, the assessment methodology should be reliable, easy to interpret, require few statistics, and can be used for both small and large numbers of envi-ronments (Schmildt et al. 2011).
Crop Breeding and Applied Biotechnology 13: 144-151, 2013 Brazilian Society of Plant Breeding. Printed in Brazil
The Annicchiarico (1992) method is based on analysis of variance, and stands out because it is of easy use. This method is based on the estimation of a risk index recom-mendation of using certain cultivar. For that, genotypic averages are converted to a percentage base in relation to
the average values of a speciic environment. Thus, the mean
and standard deviation are estimated for each genotype and environment in relation to the normal distribution adopted to estimate the probability of a genotype to be above aver-age of the sites studied.
In Brazil, some authors have conducted adaptability and stability studies of forage sorghum genotypes (Oliveira et al. 2002, Silva et al. 2005). However, there is a lack of information about the adaptability and stability of sweet sorghum genotypes. Thus, the objective of this study was to evaluate phenotypic stability and adaptability for fresh biomass yield and total soluble sugar of sorghum cultivars, developed by Embrapa Maize and Sorghum.
MATERIALAND METHODS
The experiments were conducted in the 2009/2010
season at ive different locations, three in Minas Gerais
state; Sete Lagoas (lat 19º 27’ 57” S, long 44º 14’ 49” W, alt 767 m asl), Nova Porteirinha (lat 15º 47 ‘ 00’’ S, long 43º 18’ 00’’ W, alt 533 m asl), and Jaíba (lat 15º 20’ 16’’ S, long 43º 40’ 26’’ W, alt 470 m asl); in Sinop – Mato Grosso (lat 11º 50’ 53’’ S, long 55º 38’ 57’’ W, alt 384 m asl), and in Pelotas – Rio Grande do Sul (lat 31º 46’ 19’’ S, long 52º 20’ 34’’ W, alt of 7 m asl), Brazil.
Sowing took place on October 29, in Sete Lagoas; November 17, in Jaíba; December 3, in Nova Porteirinha; December 17, in Pelotas; and February 9, in Sinop. The experiments were conducted during the rainy season in the South and Southeast regions, and the second harvest season in the Sinop, at the central-western Brazil.
Supplemental irrigation was applied at Sete Lagoas, Nova Porteirinha, and Jaíba trials during dry periods. Trials in Sinop and Pelotas were conducted under rainfed condi-tions. Other normally recommended cropping practices were applied during crop development in each region.
Twenty ive cultivars of sweet sorghum belonging to the
breeding program of Embrapa Maize and Sorghum were evalu-ated, 24 varieties (BR500, BR501, BR503, BR504, BR505, BRS506, BRS507, CMSXS629, CMSXS630, CMSXS631, CMSXS632, CMSXS633, CMSXS634, CMSXS635, CMSXS636, CMSXS637, CMSXS638, CMSXS639, CMSXS642, CMSXS643, CMSXS644, CMSXS646, CMSXS647 and CMSXS648), and one hybrid (BRS601).
The experimental plots consisted of four rows, 5 m long, spaced 0.70 m, established in a randomized complete block design with three replications. Fertilization consisted of 400 kg ha-1 of NPK (08-28-16) applied at sowing, and 200 kg ha-1 of urea applied 30 days after sowing. The plant population adopted was 125,000 plants ha-1.
Evaluations were conducted in the two central rows of each plot. Determination of fresh biomass yield (FBY) was determined based on the weight of total plants in each plot, without panicles, harvested at grain physiological maturity, with the weight in kg per plot converted to t ha-1. The content of total soluble solids (TSS) was determined using an automatic digital refractometer, measured in ° Brix.
Analysis of variance was irst conducted for each envi -ronment. After verifying the assumptions of homogeneity of residual variances, analysis of variance for all sites and the Scott-Knott test (1974) at 5% probability were performed. Finally, adaptability and stability analysis was conducted,
after determining signiicant genotype by environment
interaction.
The genetic model adopted for the analysis of variance was Yijk = μ + Gi + Aj + GAij + B/Ajk + eijk, where: Yijk: ob-servation of ith genotype in jth environment, and in kth block;
μ: general mean; Gi: i th
genotype effect (i = 1, 2, …, 25);
Aj: jth environment effect (j = 1, 2, …, 5); GA
ij: interaction
effect of the ith genotype in jth environment; B/A
jk: effect of k th
block in jth
environment (k = 1, 2 and 3); eijk: random error. Genotype and environment effects were considered ixed.
The Annicchiarico (1992) methodology was adopted to study the adaptability and stability. This methodology allows estimating a confidence index (Wi) for a given
genotype classiied above the average performance between
environments. It is considered the ideal genotype that pro-vides the lowest risk of being adopted, in other words, the genotype that presents the greatest absolute value for the
conidence index.
The model for the analysis of adaptability and stability is based on the formula Wi = Y¯i. - Z(1 - α)� Si, where: Wi:
con-idence index (%); Y¯i.: average of ith genotype in percentage;
Z(1 - α): cumulative normal distribution function; Si: standard
deviation of ith genotype in percentages.
High conidence index occur for genotypes that have
higher averages and less deviation for traits evaluated. The value of the standardized normal distribution Z(1 - α) set was 0.2734, for α = 25%, which represents 75% level of
con-idence that the genotypes, at minimum, had values above
After analyzing the adaptability and overall stability, the
conidence index was determined according to favorable
or unfavorable environments, considering the means and the variances related to each type of environment. For this reason, environmental indices (Ij) were calculated as the difference between each environment mean and the overall
mean from all environments. These indices classiied the
environmental conditions during the trials as favorable when positive and unfavorable when negative.
Thus, Wi( f )=Y¯i.( f )-Z(1 - α)�Si( f ) only considers environments
classiied as favorable, and Wi(d)=Y¯i.(d)-Z(1 - α)�Si(d) only considers
environments classiied as unfavorable. All statistical analy -ses were performed using the Genes software (Cruz 2009).
RESULTS AND DISCUSSION
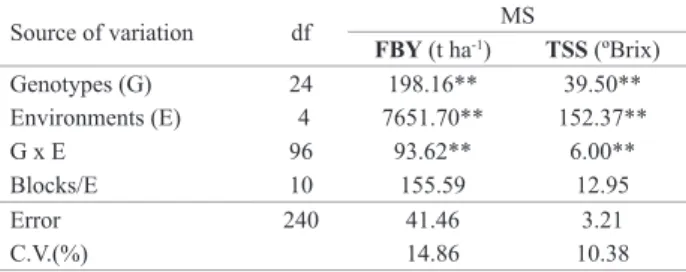
According to F test in the joint analyzes (Table 1),
genotype by environment interaction showed signiicant
effects (P < 0.01) for FBY and TSS. This indicates distinct performance changes of sweet sorghum cultivars evaluated in different environments. The Scott-Knott (1974) cluster
means test was used for classiication of FBY (Table 2) and
TSS means (Table3).
Overall environment means for FBY ranged from 27.31 t ha-1 in Pelotas - RS to 51.62 t ha-1 in Nova Porteirinha - MG. Teixeira et al. (1999) presented similar results when evaluating the sorghum cultivar BR505, in different seasons, with values ranging from 20.85 t ha-1 to 52.70 t ha-1.
The value observed for Pelotas – RS can be considered underestimated due to the occurrence of a prolonged drought without supplemental irrigation during plant growth. In this
environment, there were no signiicant differences between genotypes, and the coeficient of variation of 26.90% was
Table 1. Summary of joint analysis of variance for fresh biomass yield (FBY), and content of total soluble solids (TSS) of 25 genotypes of sweet sorghum, grown in different environments, in 2009/2010 season in Brazil
Source of variation df MS
FBY (t ha-1) TSS (ºBrix) Genotypes (G) 24 198.16** 39.50** Environments (E) 4 7651.70** 152.37**
G x E 96 93.62** 6.00**
Blocks/E 10 155.59 12.95
Error 240 41.46 3.21
C.V.(%) 14.86 10.38
** and *: Signiicant at 1% and 5% probability for the F test, respectively.
Table 2. Average of fresh biomass yield (FBY)*, in t ha-1, of 25 cultivars of sweet sorghum grown in ive environments, in 2009/2010 season in Brazil
Genotypes Environments Means
Sete Lagoas-MG Nova Porteirinha-MG Jaíba-MG Pelotas-RS Sinop-MT
CMSXS629 48.48 b A 53.90 a A 35.76 b B 27.57 a B 51.33 a A 43.41
CMSXS630 57.24 a A 46.52 b A 46.71 a A 26.48 a B 48.10 b A 45.01
CMSXS631 46.00 b A 50.14 b A 39.38 b A 32.33 a B 45.52 b A 42.67
CMSXS632 46.19 b A 43.38 b A 36.81 b B 26.14 a B 45.05 b A 39.51
CMSXS633 49.05 b A 53.81 a A 42.29 a B 22.00 a C 40.19 b B 41.47
CMSXS634 53.81 a A 55.95 a A 32.57 b B 37.29 a B 57.62 a A 47.45
CMSXS635 49.81 b A 49.52 b A 35.29 b B 32.76 a B 49.24 a A 43.32
CMSXS636 40.48 b A 45.29 b A 30.90 b B 15.90 a C 44.48 b A 35.41
CMSXS637 53.43 a A 48.05 b A 28.90 b B 25.67 a B 43.33 b A 39.88
CMSXS638 50.29 b A 54.19 a A 37.90 b B 28.05 a B 37.14 b B 41.51
CMSXS639 47.24 b A 46.90 b A 39.76 b A 23.19 a B 47.33 b A 40.88
BRS506 49.05 b A 59.62 a A 43.05 a B 30.05 a C 55.62 a A 47.48
CMSXS642 48.57 b A 43.48 b A 31.62 b B 28.62 a B 54.48 a A 41.35
CMSXS643 65.14 a A 49.62 b B 41.57 a B 21.14 a C 43.90 b B 44.27
CMSXS644 63.90 a A 63.14 a A 43.22 a B 35.24 a B 45.62 b B 50.22
BR507 48.19 b A 52.29 b A 44.48 a A 25.14 a B 44.48 b A 42.92
CMSXS646 60.19 a A 48.67 b B 44.29 a B 26.62 a C 42.86 b B 44.53
CMSXS647 58.19 a A 60.43 a A 48.43 a B 28.43 a C 61.33 a A 51.36
CMSXS648 47.43 b B 61.29 a A 40.71 a C 31.43 a C 52.86 a B 46.74
BR500 44.19 b A 45.86 b A 30.95 b B 26.81 a B 52.19 a A 40.00
BR501 48.00 b B 57.14 a A 54.29 a A 18.33 a C 41.81 b B 43.91
BR503 52.95 a A 49.76 b A 47.52 a A 23.91 a B 27.05 b B 40.24
BR505 56.29 a A 46.90 b A 37.48 b B 30.86 a B 49.90 a A 44.29
BR504 40.48 b A 44.38 b A 37.33 b A 26.62 a B 46.86 b A 39.13
BRS601 49.71 b A 60.19 a A 45.33 a B 32.29 a C 43.33 b B 46.17
Means 50.97 51.62 39.86 27.31 46.86 43.32
higher compared with all other environments, that showed values ranging from 9.36% to 16.59%.
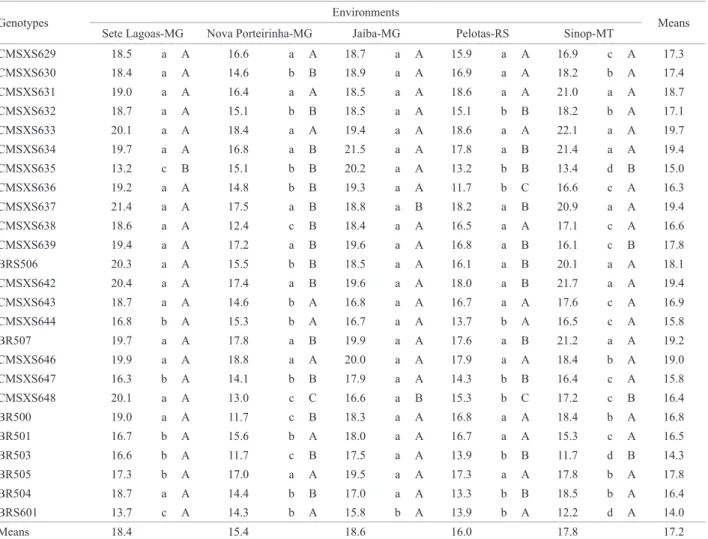
Similarly, the genotypes showed signiicant differences
in all environments for TSS, with the overall mean ranging between 15.4 º Brix in Nova Porteirinha - MG and 18.6 º Brix in Jaíba - MG. The average values for FBY and TSS of
this study conirmed data presented by Channappagoudar et
al. (2007). Since these characters are positively correlated with ethanol production (Guigou et al. 2011), cultivars with the highest values for both characters are the most suitable for agronomic processing.
Thirteen genotypes (CMSXS629, CMSXS630, CMSXS634, CMSXS635, BRS506, CMSXS643, CMSXS644, CMSXS646, CMSXS647, CMSXS648, BR501, BR505 and BRS601) had FBY higher than the overall mean (43.32 t ha-1) across environments, and CMSXS629, CMSXS630, CMSXS634, BRS506, CMSXS646, and BR505
were also present in the group that showed superior perfor-mance for TSS compared to overall environment mean of
17.2 ° Brix. Although the other genotypes showed signiicant
FBY, they had low measurement for TSS, or vice-versa. According to the environments classification, Sete Lagoas – MG, and Sinop - MT were considered favorable environments for both FBY and TSS. Nova Porteirinha -
MG was classiied as favorable for FBY and unfavorable for TSS, and Jaíba - MG was classiied as unfavorable for
FBY and favorable for TSS. Lastly, Pelotas - RS was
clas-siied as unfavorable for both traits (Table 4).
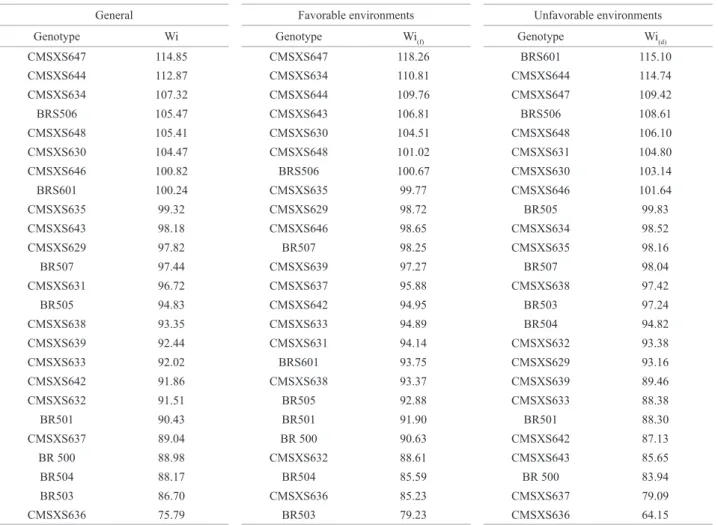
From the adaptability and overall stability assessment, we observed that the genotypes CMSXS647, CMSXS644, CMSXS634, BRS506, CMSXS648, CMSXS630, CMSXS646, CMSXS635 and BRS601 had the lowest risk of having behavior below average for FBY, considering
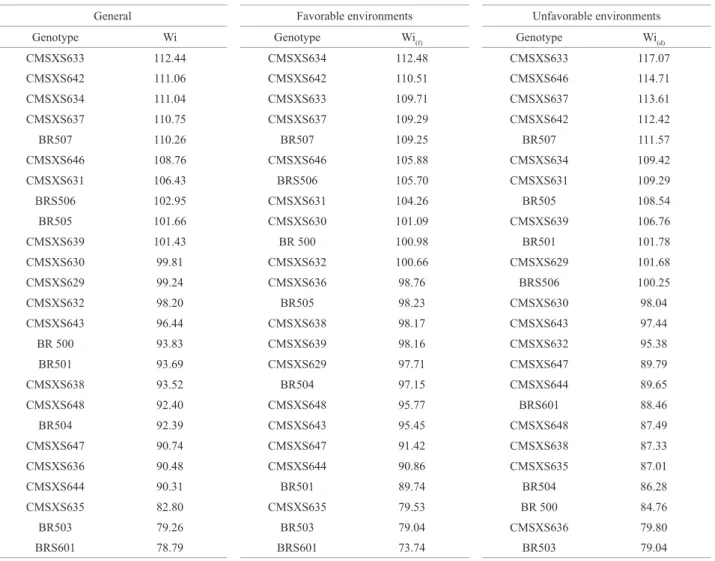
75% conidence (Table 5). For TSS, genotypes CMSXS633,
Table 3. Averages of total soluble solids (TSS)* in ºBrix of 25 cultivars of sweet sorghum grown in ive environments, in 2009/2010 season in Brazil
Genotypes Environments Means
Sete Lagoas-MG Nova Porteirinha-MG Jaíba-MG Pelotas-RS Sinop-MT
CMSXS629 18.5 a A 16.6 a A 18.7 a A 15.9 a A 16.9 c A 17.3
CMSXS630 18.4 a A 14.6 b B 18.9 a A 16.9 a A 18.2 b A 17.4
CMSXS631 19.0 a A 16.4 a A 18.5 a A 18.6 a A 21.0 a A 18.7
CMSXS632 18.7 a A 15.1 b B 18.5 a A 15.1 b B 18.2 b A 17.1
CMSXS633 20.1 a A 18.4 a A 19.4 a A 18.6 a A 22.1 a A 19.7
CMSXS634 19.7 a A 16.8 a B 21.5 a A 17.8 a B 21.4 a A 19.4
CMSXS635 13.2 c B 15.1 b B 20.2 a A 13.2 b B 13.4 d B 15.0
CMSXS636 19.2 a A 14.8 b B 19.3 a A 11.7 b C 16.6 c A 16.3
CMSXS637 21.4 a A 17.5 a B 18.8 a B 18.2 a B 20.9 a A 19.4
CMSXS638 18.6 a A 12.4 c B 18.4 a A 16.5 a A 17.1 c A 16.6
CMSXS639 19.4 a A 17.2 a B 19.6 a A 16.8 a B 16.1 c B 17.8
BRS506 20.3 a A 15.5 b B 18.5 a A 16.1 a B 20.1 a A 18.1
CMSXS642 20.4 a A 17.4 a B 19.6 a A 18.0 a B 21.7 a A 19.4
CMSXS643 18.7 a A 14.6 b A 16.8 a A 16.7 a A 17.6 c A 16.9
CMSXS644 16.8 b A 15.3 b A 16.7 a A 13.7 b A 16.5 c A 15.8
BR507 19.7 a A 17.8 a B 19.9 a A 17.6 a B 21.2 a A 19.2
CMSXS646 19.9 a A 18.8 a A 20.0 a A 17.9 a A 18.4 b A 19.0
CMSXS647 16.3 b A 14.1 b B 17.9 a A 14.3 b B 16.4 c A 15.8
CMSXS648 20.1 a A 13.0 c C 16.6 a B 15.3 b C 17.2 c B 16.4
BR500 19.0 a A 11.7 c B 18.3 a A 16.8 a A 18.4 b A 16.8
BR501 16.7 b A 15.6 b A 18.0 a A 16.7 a A 15.3 c A 16.5
BR503 16.6 b A 11.7 c B 17.5 a A 13.9 b B 11.7 d B 14.3
BR505 17.3 b A 17.0 a A 19.5 a A 17.3 a A 17.8 b A 17.8
BR504 18.7 a A 14.4 b B 17.0 a A 13.3 b B 18.5 b A 16.4
BRS601 13.7 c A 14.3 b A 15.8 b A 13.9 b A 12.2 d A 14.0
Means 18.4 15.4 18.6 16.0 17.8 17.2
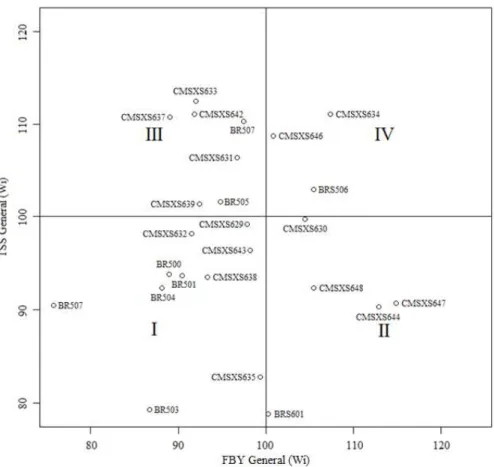
CMSXS642, CMSXS634, CMSXS637, BR507, CMSXS646, CMSXS631, BRS506, BR505 and CMSXS639 had the low-est risk (Table 6). However, only genotypes CMSXS634, BRS506, and CMSXS646 showed high risk indices (Wi> 100) considering FBY and TSS simultaneously, qualifying them as the most stable and suitable for ethanol production in all environments (Figure 1).
Some genotypes, such as CMSXS647 in favorable environments, and BRS601 in unfavorable environments, presented high Wi for FBY, with performances 18.26% and 15.10% higher than average. But for TSS, they were 8.58% and 11.54% lower than average, respectively. The reverse also occurred to CMSXS642 in favorable environments, and CMSXS633 in unfavorable environments, which Table 4. Environmental indices (Ij) and classiication of favorable or unfavorable environments for cultivation, according to the methodology of An -nicchiarico (1992). Values obtained by evaluating the characters of fresh biomass yield (FBY) and content of total soluble solids (TSS) of 25 genotypes
of sorghum, grown in ive environments, in the season 2009/2010 in Brazil
Environment FBY TSS
Index Class Index Class
Sete Lagoas - MG 5.69 Favorable 1.16 Favorable
Nova Porteirinha - MG 6.34 Favorable -1.80 Unfavorable
Jaíba - MG -5.42 Unfavorable 1.31 Favorable
Pelotas - RS -17.97 Unfavorable -1.22 Unfavorable
Sinop - MT 1.58 Favorable 0.55 Favorable
Table 5. Parameters of adaptability and overall stability (Wi) in favorable environments (Wi(f)) and in unfavorable environments (Wi(d)) of 25 genotypes of sweet sorghum for fresh biomass yield (FBY), in t ha-1, based on the methodology of Annicchiarico (1992), according to results obtained in ive
different environments in 2009/2010 season in Brazil
General Favorable environments Unfavorable environments
Genotype Wi Genotype Wi(f) Genotype Wi(d)
CMSXS647 114.85 CMSXS647 118.26 BRS601 115.10
CMSXS644 112.87 CMSXS634 110.81 CMSXS644 114.74
CMSXS634 107.32 CMSXS644 109.76 CMSXS647 109.42
BRS506 105.47 CMSXS643 106.81 BRS506 108.61
CMSXS648 105.41 CMSXS630 104.51 CMSXS648 106.10
CMSXS630 104.47 CMSXS648 101.02 CMSXS631 104.80
CMSXS646 100.82 BRS506 100.67 CMSXS630 103.14
BRS601 100.24 CMSXS635 99.77 CMSXS646 101.64
CMSXS635 99.32 CMSXS629 98.72 BR505 99.83
CMSXS643 98.18 CMSXS646 98.65 CMSXS634 98.52
CMSXS629 97.82 BR507 98.25 CMSXS635 98.16
BR507 97.44 CMSXS639 97.27 BR507 98.04
CMSXS631 96.72 CMSXS637 95.88 CMSXS638 97.42
BR505 94.83 CMSXS642 94.95 BR503 97.24
CMSXS638 93.35 CMSXS633 94.89 BR504 94.82
CMSXS639 92.44 CMSXS631 94.14 CMSXS632 93.38
CMSXS633 92.02 BRS601 93.75 CMSXS629 93.16
CMSXS642 91.86 CMSXS638 93.37 CMSXS639 89.46
CMSXS632 91.51 BR505 92.88 CMSXS633 88.38
BR501 90.43 BR501 91.90 BR501 88.30
CMSXS637 89.04 BR 500 90.63 CMSXS642 87.13
BR 500 88.98 CMSXS632 88.61 CMSXS643 85.65
BR504 88.17 BR504 85.59 BR 500 83.94
BR503 86.70 CMSXS636 85.23 CMSXS637 79.09
presented performance 10.51% and 17.07% higher than average for TSS and presented performance 5.05% and 11.62% below the average for FBY, respectively.
The genotypes that have excelled in favorable envi-ronmental conditions (Sete Lagoas - MG and Sinop - MT) for both characters were CMSXS634, CMSXS630, and
BRS506, since they showed conidence indices above the
environmental average for both FBY and TSS. In percent-age, these genotypes exceeded the environmental average by 10.81%, 4.51% and 0.67% for FBY and by 12.48%, 1.09% and 5.70% for TSS, respectively. Likewise, geno-types CMSXS631, BRS506, and CMSXS646 stood out in unfavorable environment (Pelotas - RS), for presenting
concurrently, conidence indices above average for both
FBY (4.8%, 8.61% and 1.64%) and for TSS (9.29%, 0.25% and 14.71%).
The Annicchiarico method allowed easy interpretation, based on analysis of only one parameter, and also allowed the ranking of genotypes more adapted and stable. Silva et al. (2005), using another method of stability and adaptability to evaluate fresh and dry biomass yield in forage sorghum
cultivars, identiied BRS506, among the materials evaluated,
as the most suitable to favorable and unfavorable environ-ments, in addition to presenting the highest yield for fresh biomass (49.33 t ha-1). In the present study, the cultivar
BRS506 also showed general and speciic adaptability and
stability for favorable and unfavorable environments for both FBY and TSS. However, the genotype CMSXS634 showed superior performance in general adaptation and in particular favorable environments, moreover, genotype
CMSXS646 presented general and speciic adaptation to
unfavorable environments for both traits.
Table 6. Parameters of adaptability and overall stability (Wi) in favorable environments (Wi(f)) and in unfavorable environments (Wi(d)) of 25 genotypes
of sorghum, for total soluble solids (TSS) or ºBrix in the juice, based in the methodology of Annicchiarico (1992), according to results obtained in ive
different environments in the 2009/2010 season in Brazil
General Favorable environments Unfavorable environments
Genotype Wi Genotype Wi(f) Genotype Wi(d)
CMSXS633 112.44 CMSXS634 112.48 CMSXS633 117.07
CMSXS642 111.06 CMSXS642 110.51 CMSXS646 114.71
CMSXS634 111.04 CMSXS633 109.71 CMSXS637 113.61
CMSXS637 110.75 CMSXS637 109.29 CMSXS642 112.42
BR507 110.26 BR507 109.25 BR507 111.57
CMSXS646 108.76 CMSXS646 105.88 CMSXS634 109.42
CMSXS631 106.43 BRS506 105.70 CMSXS631 109.29
BRS506 102.95 CMSXS631 104.26 BR505 108.54
BR505 101.66 CMSXS630 101.09 CMSXS639 106.76
CMSXS639 101.43 BR 500 100.98 BR501 101.78
CMSXS630 99.81 CMSXS632 100.66 CMSXS629 101.68
CMSXS629 99.24 CMSXS636 98.76 BRS506 100.25
CMSXS632 98.20 BR505 98.23 CMSXS630 98.04
CMSXS643 96.44 CMSXS638 98.17 CMSXS643 97.44
BR 500 93.83 CMSXS639 98.16 CMSXS632 95.38
BR501 93.69 CMSXS629 97.71 CMSXS647 89.79
CMSXS638 93.52 BR504 97.15 CMSXS644 89.65
CMSXS648 92.40 CMSXS648 95.77 BRS601 88.46
BR504 92.39 CMSXS643 95.45 CMSXS648 87.49
CMSXS647 90.74 CMSXS647 91.42 CMSXS638 87.33
CMSXS636 90.48 CMSXS644 90.86 CMSXS635 87.01
CMSXS644 90.31 BR501 89.74 BR504 86.28
CMSXS635 82.80 CMSXS635 79.53 BR 500 84.76
BR503 79.26 BR503 79.04 CMSXS636 79.80
These results indicate that improvements have been made in the sweet sorghum breeding program of Embrapa Maize and Sorghum, since higher yielding cultivars, adapted
and stable for both general and speciic environments were
observed, being possible candidates for commercial release. Moreover, they can assist in the decision of farmers in adopt-ing new cultivars. However, new studies of the adaptability and stability in different seasons and in new environments
are important to obtain more complete information on the
performance of genotypes in speciic regions.
ACKNOWLEDGEMENTS
Embrapa Maize and Sorghum, the European Commission
FP7 project “SweetFuel” and Fapemig for inancial support.
Unimontes and Capes for the scholarship.
Adaptabilidade e estabilidade de cultivares de sorgo sacarino
Resumo - O objetivo do presente estudo foi avaliar a adaptabilidade e estabilidade fenotípica de 25 cultivares de sorgo sacarino da Embrapa Milho e Sorgo. Os experimentos foram conduzidos em cinco ambientes, três no Estado de Minas Gerais e os demais nas cidades de Sinop – MT e Pelotas – RS, no delineamento em blocos ao acaso, com três repetições. Foram avaliados a produção de biomassa fresca (PBF) e o teor de sólidos solúveis totais (SST) do caldo. Na análise de variância conjunta, a interação genótipos com ambientes foi signiicativa para os dois caracteres avaliados. Para análise da adaptabilidade e estabilidade, utilizou-se o método de Annicchiarico. Os genótipos CMSXS634, BRS506 e CMSXS646 foram os mais adaptados e estáveis para PBF e SST concomitante -mente, sendo CMSXS634 mais adaptado a ambientes favoráveis e CMSXS646 a ambientes desfavoráveis.
Palavras-chave: Sorghum bicolor, interação genótipos x ambientes, Annicchiarico, biocombustível, etanol.
REFERENCES
Annicchiarico P (1992) Cultivar adaptation and recommendation from alfalfa trials in Northern Italy. Journal of Genetics and Plant
Breeding46: 269-278.
Channappagoudar BB, Biradar NR, Patil JB and Hiemath SM (2007) Assessment of sweet sorghum gentypes for cane yield, juice characters and sugar levels. Karmataka Journal of Agricultural Sciences 20: 294-296.
Cruz CD (2009) Programa Genes- aplicativo computacional em
genética e estatística. Version 2009.7.0. Available at <http://www.
ufv.br/dbg/genes/Genes_Br.htm> Accessed on 15 Feb., 2010.
Cruz CD, Regazzi AJ and Carneiro PCS (2004) Modelos biométricos
aplicados ao melhoramento genético. Editora UFV, Viçosa, 480p.
Diaz-Chaves R and Jamieson C (2010) Biofuels possibilities in the Southern Africa context. Journal of Biobased Materials and
Bioenergy 4: 256-266.
Guigou M, Lareo C, Pérez LV, Lluberas ME, Vázquez D and Ferrari MD (2011) Bioethanol production from sweet sorghum: Evaluation of post-harvest treatments on sugar extraction and fermentation. Biomass
and Bioenergy35: 3058-3062.
Kim M and Day DF (2010) Composition of sugar cane, energy cane, and sweet sorghum suitable for ethanol production at Louisiana sugar Mills.
Journal of IndustrialMicrobiology and Biotechnology 38: 803-807.
Oliveira JS, Ferreira RP, Cruz CD, Pereira AV, Botrel MA, Pinho RG, Rodrigues JAS, Lopes FCF and Miranda JEC (2002) Adaptabilidade e estabilidade em cultivares de sorgo. Revista Brasileira de Zootecnia 31: 883-889.
Ratnavathi CV, Suresh K, Vijaykumar BS, Pallavi M, Komala VV and Seetharama N (2010) Study on genotypic variation for ethanol production from sweet sorghum juice. Biomass Bioenergy 34: 947-952.
Schmildt ER, Nascimento AL, Cruz CD and Oliveira JAR (2011) Avaliação de metodologias de adaptabilidade e estabilidade de cultivares milho.
Acta Scientiarum Agronomy 33: 51-58.
Scott AJ and Knott MA (1974) A cluster analysis method for grouping means in the analysis of variance. Biometrics 30: 507-512.
Silva AG, Rocha VS, Cruz CD, Sediyama T and Pinto GHF (2005) Adaptabilidade e estabilidade de cultivares de sorgo forrageiro semeados em diferentes épocas do ano. Revista Brasileira de Milho
e Sorgo 4: 112-125.
Teixeira CG, Jardine JG, Nicolella G and Zaroni MH (1999) Inluência da
época de corte sobre o teor de açúcares de colmos de sorgo sacarino.
Pesquisa Agropecuária Brasileira 34: 1601-1606.
Thomas G (2009) Integrated processing for proit. International Sugar
Journal 111: 670-675.
Venturi P and Venturi G (2003) Analysis of energy comparison for crops in European agricultural systems. Biomass & Bioenergy 25: 235-255.