Adaptability and stability of semilate and late maturing soybean
genotypes in Minas Gerais state
Edmar Soares de Vasconcelos1*, Múcio Silva Reis2, Cosme Damião Cruz3, Tuneo
Sediyama2 and Carlos Alberto Scapim4
1
Departamento de Engenharia Agrícola, Centro de Ciências Agrárias, Universidade Estadual de Maringá, Rod. PR 182, km 45, BR 182, 87200-000, Cidade Gaucha, Paraná, Brazil. 2Departamento de Fitotecnia, Centro de Ciências Agrárias, Universidade Federal de Viçosa, Viçosa, Minas Gerais, Brazil. 3Departamento de Biologia Geral, Centro de Ciências Biológicas e da Saúde, Universidade Federal de Viçosa, Viçosa, Minas Gerais, Brasil. 4Departamento de Agronomia, Centro de Ciências Agrárias, Universidade Estadual de Maringá, Maringá, Paraná, Brazil. *Author for correspondence. E-mail: [email protected]
ABSTRACT. The purpose of this study was to evaluate the phenotypic adaptability and stability for grain yield of soybean genotypes by the method of Annicchiarico and the Integrated Method of adaptability and stability analysis and to identify the genotypes with best performance under environmental variations. The agronomic performance of semilate and late genotypes maturing, was evaluated in the final evaluation trials of the Program of Soybean Genetic Improvement of the UFV, in Viçosa, Florestal and São Gotardo, State of Minas Gerais, in the 2006/2007 and 2007/2008 growing seasons. All field experiments were arranged in a complete randomized block design with 14 treatments and three replications. Line CS 02736 and cultivar UFV TN 105 were classified as adapted to favorable environments, whereas the performance was medium even in unfavorable environments, according to the Integrated Method of adaptability and stability analysis. Yield adaptability and stability of cultivar Monarca were classified as high by the method of Annicchiarico and by the Integrated Method of adaptability and stability analysis.
Key words:Glycine max, grain yield, genotypes x environments interaction.
RESUMO. Adaptabilidade e estabilidade de genótipos de soja de ciclos semitardios e tardios no Estado de Minas gerais. O objetivo deste trabalho foi avaliar a adaptabilidade e estabilidade fenotípica da produtividade de grãos de genótipos de soja, utilizando o método de Annicchiarico e o Método Integrado de análise de adaptabilidade e estabilidade, para identificar os genótipos de melhor comportamento frente às variações ambientais. Foram avaliados os materiais genéticos de ciclos semitardio e tardio, dos ensaios finais de avaliação do comportamento agronômico do Programa de Melhoramento Genético de Soja do Departamento de Fitotecnia da Universidade Federal de Viçosa, conduzidos em Viçosa, Florestal e São Gotardo, no Estado de Minas Gerais, nos anos agrícolas de 2006/2007 e 2007/2008. Em cada experimento de campo, utilizou-se o delineamento experimental em blocos completos com os tratamentos ao acaso, com três repetições. A linhagem CS 02449 e a cultivar UFV TN 105 foram classificadas como adaptados às condições ambientais favoráveis, apresentando ainda comportamento médio em ambientes desfavoráveis, isto pelo Método Integrado de análise de adaptabilidade e estabilidade. A cultivar Monarca foi classificada como genótipo de elevada adaptabilidade e estabilidade produtiva pelo método de Annicchiarico e pelo Método Integrado de análise de adaptabilidade e estabilidade.
Palavras-chave:Glycine max, produtividade de grãos, interação genótipos x ambientes.
Introduction
Soybean (Glycine max (L.) Merrill) is grown in several regions of the world, in a wide range of environments. This significantly affects the grain yield of the different genotypes due to the genotype x environment (GE) interaction. It is believed that this interaction plays a key role in phenotypic expression, and must be estimated and considered when indicating cultivars for breeding programs (PRADO et al., 2001).
Acta Scientiarum. Agronomy Maringá, v. 32, n. 3, p. 411-415, 2010 opportunity to be exploited. Adaptation of genotypes
to specific environments can make the difference between a good and an excellent variety (GAUCH; ZOBEL, 1996). But, in order to explore these positive interaction effects, statistical methods capable of capturing such information are needed.
To know the GE interaction, many alternatives have been and are being proposed, e.g., the analysis of phenotypic stability and adaptability using linear regression models (EBERHART; RUSSELL, 1966; SILVA; BARRETO, 1986; CRUZ et al., 1989). These analyses have been used to evaluate yield adaptability and stability of different crops in different environments (SILVA; DUARTE, 2006; MAIA et al., 2006, BARROS et al., 2008).
Several analysis methods of the GE interaction and of adaptability and stability do not make use of linear regression, for example: the method of Lin and Binns (1988), Annicchiarico (1992) and the Centroid method for adaptability analysis (ROCHA et al., 2005), among others. These methods are also used for GE interaction analysis in different crops (CARVALHO et al., 2002b; VICENTE et al., 2004). Silva and Duarte (2006) however recommend the use of either the method of Annicchiarico or of Lin and Binns, since the two are strongly associated, which would not justify the use of both.
In the method proposed by Annicchiarico (1992), stability is measured by the superiority of a genotype in relation to the mean of each environment. This method is based on the estimation of an index of recommendation or confidence, which measures the probability that the performance of a given genotype is superior over the others.
The Centroid method of adaptability analysis allows the analysis of genotypes with enhanced exploitation of the GE interaction. This method compares the values of Cartesian distance between the genotypes and reference points (ideotypes), created based on experimental data (ROCHA et al., 2005). The method has been used for adaptability analysis in different crops: eucalyptus (ROCHA et al., 2005), soybean (PELÚZIO et al., 2008), alfalfa (VASCONCELOS et al., 2008). A modification of this method was proposed by Nascimento et al. (2009), generating the Integrated method for analysis of adaptability and phenotypic stability.
The purpose of this study was to estimate the adaptability and phenotypic stability of grain yield of soybean genotypes by two analyses methods (Integrated and Annicchiarico) to identify the best-performing soybean genotypes in different environments.
Material and methods
Semilate and late soybean lines and cultivars were evaluated in the final testing of agronomic evaluation of the performance of the Soybean Improvement Program in the Department of Crop Production, Federal University of Viçosa, conducted in the State of Minas Gerais, in two growing seasons, 2006/2007 and 2007/2008. The experiments were conducted at three locations: Viçosa, Florestal and São Gotardo, all in both growing seasons.
In 2006, sowing was performed on December 1, 2, 12 in Viçosa, Florestal and São Gotardo, respectively. In 2007, sowing was done on November 9 and 29 and December 12, in Viçosa, Florestal and São Gotardo, respectively.
Fertilization was performed in the planting hole with 250 kg ha-1 of the compound NPK fertilizer 00-20-20 in all experiments of the 2006/2007 growing season. The same dose of a single fertilizer was used in the growing season 2007/2008, except in Florestal, where 360 kg ha-1 of NPK fertilizer 00-20-20 was applied in the planting hole. Fertilizer was applied based on soil analysis.
The experimental design of each field experiments was based on randomized blocks with three replications. The plots consisted of four 5-m-long rows spaced 0.5 m apart and plants were thinned to 14 per meter. The genotype yield was determined based on the production of a 4.0 m2 area, corresponding to the two central rows, 4 m long, discarding 0.5 m at either end. Cultural treatments were applied whenever necessary and according to the crop development.
The same ten lines and four cultivars were evaluated at all locations and in all growing seasons: Conquista; CS 02449; CS 02736; Monarca; UFV 18; UFV Pop V-15; UFV Pop V-5; UFV Pop V-7; UFV TN 105; UFV01823281B; UFV01878397B; UFV01928443B; UFV998972162 and UFV99CRR768.
The experiments were analyzed in a triple factorial design, with 2 growing seasons, 3 locations and 14 genotypes (2 x 3 x 14). For the GE interaction analysis (G - genotypes and E - environments), the two growing seasons and three locations were designated as agricultural environments, generating six different environments. The experiments conducted in Viçosa, Florestal and São Gotardo in the 2006/2007 growing season generated environment one, two and three, respectively and environment four, five and six, in the 2007/2008 growing season.
transformation. Individual analysis of variance of data was performed to verify the homogeneity of variance (Cochram test), whether transformation was needed or not, of the number of degrees of freedom of the residue for the combined analysis.
The following methods were used to analyze adaptability and stability of grain yield of the different soybean genotypes under environmental variations: method of Annicchiarico (1992) and the Integrated Method of adaptability and stability analysis. Statistical analyses were run using software "Genes" (CRUZ, 2006).
Results and discussion
The errors showed normal distribution by the Lilliefors test, facilitating the use of parametric analyses and homogeneity of variance by the method of Cochram, allowing the application of variance analysis. The relationship between the largest and the smallest mean square was 3.13 (Table 1). An adjustment of the degrees of freedom of the residue for the combined analysis of the experiments was not required.
The analysis of variance (Table 1) indicated the existence of significant interaction between growing seasons, locations and genotypes, suggesting a differential performance of genotypes within each site in each growing season (environment). Regarding soybean yield, several authors (DI MAURO et al., 2000; CARVALHO et al., 2002a; YOKOMIZO et al., 2000) verified the existence of interaction between genotypes and environments. They classified the causes of this interaction as related to physiological and adaptive factors and to the scale of variable measurement.
Table 1 shows the R2 values, which indicate the magnitude of GE interaction (already considering environments as the association of the different growing seasons with the different locations). The GE interaction was decomposed into the effects of genotype x growing season, genotype x location and genotype x location x growing season, which were all quantified. Thereby it is possible to check how much each one contributes to the GE interaction. The results indicated that the genotype x location x growing season (G x L x Y) contributed most to the GE interaction, calling for a more detailed study).
Due to the interaction detected between genotypes and environments (locations and growing seasons), the adaptability and stability of grain yield was analyzed by the method of Annicchiarico (Table 2) and by the Integrated Method of adaptability and stability analysis (Table 3). For these tests, the different locations in each growing season were
considered environments; consequently, the two growing seasons at three locations represented six environments.
Table 1. Summary of analysis of variance of the yield data of semilate/late soybean cultivars and lines established in the final tests (EFIs) of the UFV soybean breeding program, conducted at different locations in the State of Minas Gerais in the growing seasons 2006/2007 and 2007/2008.
Sources of variation DF MS Probability of Error type I R
2
(Blocks/Locations)/ Growing season
12 442696.40 - - -
Genotypes (G) 13 1141675.83 0.02 * - Growing seasons (Y) 1 93167488.40 0.19 NS
- Locations (L) 2 46931420.38 0.35 NS -
G x Y 13 400456.20 1.00 NS 11.73
G x L 26 619305.70 1.00 NS 36.28
Y x L 2 25023978.74 0.00 ** - G x L x Y 26 887480.62 0.00 ** 51.99
Error 156 249952.03 - - -
Total 251
Mean 2310.19
CV. (%) 21.64
Difference between the greatest and smallest MS Error 3.13
NSNS - not significant by the F test, **, *Significant at 1 and 5% probability level by the
F test, respectively; R2- Value of the contribution of the above variation sources to the
GE interaction.
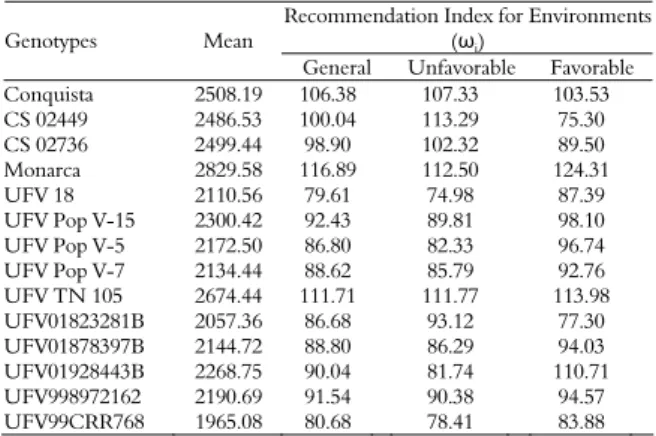
Table 2. Adaptability and phenotypic stability of grain yield of semilate/late soybean cultivars and lines established in the final tests (EFIs) of the UFV soybean breeding program, conducted at different locations in the State of Minas Gerais in the growing seasons 2006 / 2007 and 2007/2008, by the method of Annicchiarico.
Recommendation Index for Environments (ωi)
Genotypes Mean
General Unfavorable Favorable Conquista 2508.19 106.38 107.33 103.53 CS 02449 2486.53 100.04 113.29 75.30
CS 02736 2499.44 98.90 102.32 89.50
Monarca 2829.58 116.89 112.50 124.31 UFV 18 2110.56 79.61 74.98 87.39
UFV Pop V-15 2300.42 92.43 89.81 98.10 UFV Pop V-5 2172.50 86.80 82.33 96.74 UFV Pop V-7 2134.44 88.62 85.79 92.76 UFV TN 105 2674.44 111.71 111.77 113.98 UFV01823281B 2057.36 86.68 93.12 77.30 UFV01878397B 2144.72 88.80 86.29 94.03 UFV01928443B 2268.75 90.04 81.74 110.71 UFV998972162 2190.69 91.54 90.38 94.57 UFV99CRR768 1965.08 80.68 78.41 83.88
Acta Scientiarum. Agronomy Maringá, v. 32, n. 3, p. 411-415, 2010 genotype in relation to the environmental quality, the
method of Annicchiarico considers genotypes with minor variations as more stable plant material, when used in environments in general. The analysis of favorable and unfavorable environments gives an idea of the adaptability of these genotypes. Consequently, this method allows inferences about the adaptability and stability of the genotypes.
The recommendation index for unfavorable environments of the lines CS 02449 and CS 02736 was above 100. Theses lines were therefore adapted to unfavorable environmental conditions only, where, generally speaking, less investments are made. The recommendation index of line UFV01 928443B for favorable environments was above 100 and was classified as adapted to favorable environmental conditions by the method of Annicchiarico (1992). This means that this genotype can be recommended for the condition of low investment only, which is not very desirable, in the practice.
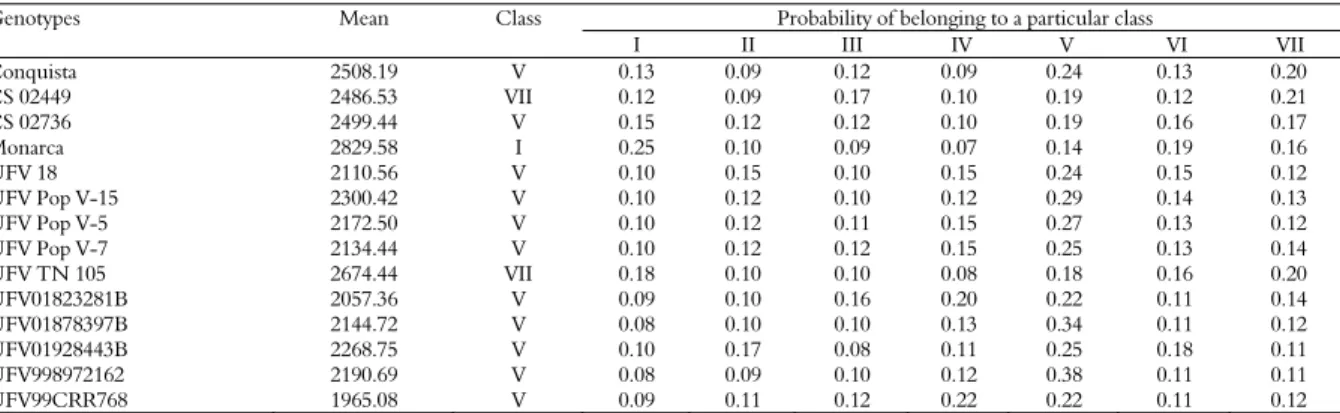
Table 3 shows the results of the Integrated Method of adaptability and stability analysis of grain yield of the genotypes evaluated. This method generates a probability value associated with the distance between the genotype and ideotype, referring to the chance of the genotype study to be closer to a given ideotype. The ideotype are determined by the method for integrated analysis of adaptability and phenotypic stability (NASCIMENTO et al., 2009). Thus, the highest value of probability for each genotype indicates to which class of stability and adaptability it belongs.
The specific adaptability to favorable and unfavorable environments of the genotypes CS 02449 and UFV TN 105 was classified as maximum for stability by the Integrated Method. This means that the response of the genotypes CS02449 and UFV TN 105 was positive to the environmental conditions with sufficient input
and also to rougher environmental conditions, with a lower technology level.
When the adaptability of a given genotype is classified as general by the Integrated Method, this indicates that the yield was close to the maximum at all experimental locations, which is one of the main objectives of breeders. The adaptability to environments of cultivar Monarca was general, because the probability value of Monarca belonging to class I was highest. The phenotypic stability of the other genotypes was classified as maximum and the probability of being close to the mean yield in each environment was great (ideotype V) (Table 3). In the case of the Integrated Method, which is a method that makes use of multivariate analysis to determine the adaptability, we can infer that the genotypes with a close to average performance in all environments will be classified as genotypes with general stability (class V). The performance expected from this genotype is therefore average in the different cultivation environments.
Barros et al. (2008) investigated soybean genotypes in Rondonopolis, Campo Verde, Nova Brazilândia and in Vera, in the State of Mato Grosso, to find that the methods of Lin and Binns, Annicchiarico and Centroid are mutually consistent and can identify the genotypes with highest yield, stability and adaptability. Silva and Duarte (2006) recommend the use of the method of Annicchiarico to analyze adaptability and phenotypic stability in soybean, since this method is strongly associated with the method of Lin and Binns for the analysis of GE interaction. When processed by the Annicchiarico and Integrated methods, the data obtained in this study also indicated three genotypes (Monarca, CS 02449 and UFV TN 105) as best in terms of adaptability and phenotypic stability in the evaluation environments.
Table 3. Adaptability and phenotypic stability of grain yield of semilate/late soybean cultivars and lines established in the final tests (EFIs) of the UFV soybean breeding program, conducted at different locations in the State of Minas Gerais in the 2006/2007 and 2007/2008 growing seasons, by the Integrated Method of adaptability and stability analysis.
Probability of belonging to a particular class
Genotypes Mean Class
I II III IV V VI VII
Conquista 2508.19 V 0.13 0.09 0.12 0.09 0.24 0.13 0.20
CS 02449 2486.53 VII 0.12 0.09 0.17 0.10 0.19 0.12 0.21
CS 02736 2499.44 V 0.15 0.12 0.12 0.10 0.19 0.16 0.17
Monarca 2829.58 I 0.25 0.10 0.09 0.07 0.14 0.19 0.16
UFV 18 2110.56 V 0.10 0.15 0.10 0.15 0.24 0.15 0.12
UFV Pop V-15 2300.42 V 0.10 0.12 0.10 0.12 0.29 0.14 0.13 UFV Pop V-5 2172.50 V 0.10 0.12 0.11 0.15 0.27 0.13 0.12 UFV Pop V-7 2134.44 V 0.10 0.12 0.12 0.15 0.25 0.13 0.14 UFV TN 105 2674.44 VII 0.18 0.10 0.10 0.08 0.18 0.16 0.20
UFV01823281B 2057.36 V 0.09 0.10 0.16 0.20 0.22 0.11 0.14
UFV01878397B 2144.72 V 0.08 0.10 0.10 0.13 0.34 0.11 0.12
UFV01928443B 2268.75 V 0.10 0.17 0.08 0.11 0.25 0.18 0.11
UFV998972162 2190.69 V 0.08 0.09 0.10 0.12 0.38 0.11 0.11
UFV99CRR768 1965.08 V 0.09 0.11 0.12 0.22 0.22 0.11 0.12
Conclusion
The method of Annicchiarico classified the adaptability to the evaluation environments of the genotypes Conquista, Monarca and UFV TN 105 as general, indicating them for recommendation for planting at different locations, with different technology levels.
Line CS 02449 and cultivar UFV TN 105 were classified as adapted to favorable environmental conditions, while the performance was intermediate, even in unfavorable environments, by the Integrated Method of adaptability and stability analysis.
The adaptability and yield stability of cultivar Monarca was classified as high by the method of Annicchiarico and by the Integrated Method of adaptability and stability analysis.
References
ANNICCHIARICO, P. Cultivar adaptation and recommendation from alfafa trials in Northern Italy. Journal of Genetics and Breeding, v. 46, n. 1, p. 269-278, 1992.
BARROS, H. B.; SEDIYAMA, T.; TEIXEIRA, R. C.; CRUZ, C. D. Análises paramétricas e não-paramétricas para determinação da adaptabilidade e estabilidade de genótipos de soja. Scientia Agraria, v. 9, n. 3, p. 299-309, 2008.
CARVALHO, C. G. P.; ARIAS, C. A. A.; TOLEDO, J. F. F.; ALMEIDA, L. A.; KIIHL, R. A. S.; OLIVEIRA, M. F. Interação genótipos x ambientes no desempenho produtivo da soja no Paraná. Pesquisa Agropecuária Brasileira, v. 37, n. 7, p. 989-1000, 2002a.
CARVALHO, H. W. L.; SILVA, M. L.; CARDOSO, M. J.; SANTOS, M. X.; TABOSA, J. N.; CARVALHO, C. L.; LIRA, M. A. Adaptabilidade e estabilidade de cultivares de milho no Nordeste brasileiro no triênio de 1998 a 2000. Pesquisa Agropecuária Brasileira, v. 37, n. 11, p. 1581-1588, 2002b.
CRUZ, C. D. Programa GENES: estatística experimental e matrizes. 1. ed., Viçosa: UFV, 2006.
CRUZ, C. D.; CARNEIRO, P. C. S. Modelos biométricos aplicados ao melhoramento genético. 2. ed., Viçosa: UFV, 2006.
CRUZ, C. D.; TORRES, R. A.; VENCOVSKY, R. An alternative approach to the stability analysis proposed by Silva and Barreto. Revista Brasileira de Genética, v. 12, n. 3, p. 567-580, 1989.
DI MAURO, A. O.; CURCIOLI, V. B.; NÓBREGA, J. C. M.; BANZATO, D. A.; SEDIYAMA, T. Correlação entre medidas paramétricas e não-paramétricas de estabilidade em soja. Pesquisa Agropecuária Brasileira, v. 35, n. 4, p. 687-696, 2000.
EBERHART, S. A.; RUSSELL, W. A. Stability parameters for comparing varieties. Crop Science, v. 6, n. 1, p. 36-40, 1966.
GAUCH, H. G.; ZOBEL, R. W. AMMI analyses of yield trials. In: KANG, M. S.; GAUCH, H. G. (Ed.).
Genotype by environment interaction. Boca Raton: CRC Press, 1996. p. 85-122.
LIN, C. S.; BINNS, M. R. A superiority measure of cultivar performance for cultivars x location data. Canadian Journal of Plant Science, v. 68, n. 1, p. 193-198, 1988.
MAIA, M. C. C.; VELLO, N. A.; ROCHA, M. M.; PINHEIRO, J. B.; SILVA, N. F. Adaptabilidade e estabilidade de linhagens experimentais de soja selecionadas para caracteres agronômicos através de método uni-multivariado. Bragantia, v. 65, n. 2, p. 215-226, 2006.
NASCIMENTO, M.; CRUZ, C. D.; CAMPANA, A. C. M.; TOMAZ, R. S.; SALGADO, C. C.; FERREIRA, R. P. Alteração no método centroide de avaliação da adaptabilidade genotípica. Pesquisa Agropecuária Brasileira, v. 44, n. 3, p. 263-269, 2009.
PELÚZIO, J. M.; FIDELIS, R. R.; GIONGO, P.; SILVA, J. C.; CAPPELLARI, D.; BARROS, H. B. Adaptabilidade e estabilidade de cultivares de soja em quatro épocas de semeadura no sul do Estado do Tocantins. Revista Ceres, v. 55, n. 1, p. 34-40, 2008.
PRADO, E. E. P.; HIRIMOTO, D. M.; GODINHO, V. P. C.; UTUMI, M. M.; RAMALHO, A. R. Adaptabilidade e estabilidade de cultivares de soja em cinco épocas de plantio no cerrado de Rondônia. Pesquisa Agropecuária Brasileira, v. 36, n. 4, p. 625-635, 2001.
ROCHA, R. B., MURO-ABAD, J. I., ARAÚJO, E. F., CRUZ, C. D. Avaliação do método do Centróide para estudo de adaptabilidade ao ambiente de clones de Eucalyptus grandis. Ciência Florestal, v. 15, n. 3, p. 255-266, 2005.
SILVA, J. G. C.; BARRETO, J. N. An application of segmented linear regression to the study of genotype x environment interaction. Biometrics, v. 41, n. 4, p. 1093-1093, 1986.
SILVA, W. C. J.; DUARTE, J. B. Métodos estatísticos para estudo de adaptabilidade e estabilidade fenotípica em soja. Pesquisa Agropecuária Brasileira, v. 41, n. 1, p. 23-30, 2006.
VASCONCELOS, E. S.; BARIONI JÚNIOR, W.; CRUZ, C. D.; FERREIRA, R. P.; RASSINI, J. B.; VILELA, D. Seleção de genótipos de alfafa pela adaptabilidade e estabilidade da produção de matéria seca. Acta Scientiarum. Agronomy, v. 30, n. 3, p. 339-343, 2008.
VICENTE, D.; PINTO, R. J. B.; SCAPIM, C. A. Análise da adaptabilidade e estabilidade de linhagens elite de soja. Acta Scientiarum. Agronomy, v. 26, n. 3, p. 301-307, 2004. YOKOMIZO, G. K.; DUARTE, J. B.; VELLO, N. A.; Correlações fenotípicas entre tamanho de grãos e outros caracteres em topo cruzamento de soja tipo alimento com tipo grão. Pesquisa Agropecuária Brasileira, v. 35, n. 11, p. 2235-2241, 2000.
Received on September 15, 2009. Accepted on December 12, 2009.