www.atmos-chem-phys.net/12/11165/2012/ doi:10.5194/acp-12-11165-2012
© Author(s) 2012. CC Attribution 3.0 License.
Chemistry
and Physics
Supermicron modes of ammonium ions
related to fog in rural atmosphere
X. H. Yao1and L. Zhang2
1Key Lab of Marine Environmental Science and Ecology, Ministry of Education, Ocean University of China,
Qingdao 266100, China
2Air Quality Research Division, Science and Technology Branch, Environment Canada, 4905 Dufferin Street,
Toronto, Ontario, M3H 5T4, Canada
Correspondence to:L. Zhang (leiming.zhang@ec.gc.ca) and X. H. Yao (xhyao@ouc.edu.cn) Received: 26 January 2012 – Published in Atmos. Chem. Phys. Discuss.: 21 February 2012 Revised: 16 November 2012 – Accepted: 19 November 2012 – Published: 26 November 2012
Abstract. Fog-processed aerosols were identified and ana-lyzed in detail from a large-sized database in which size-segregated atmospheric particles and gases were simultane-ously measured at eight Canadian rural sites. In ten samples collected during or following fog events, at least one super-micron mode of particulate NH+4 was observed. The super-micron modes were likely associated with fog events since they were absent on non-fog days. The supermicron mode of NH+4 in the 5–10 µm size range probably reflected the di-rect contribution from fog droplets. Based on detailed anal-ysis of the chemical compositions and the extent of neutral-ization, the supermicron mode of NH+4 in the 1–4 µm size range was believed to be caused by fog-processing of am-monium salt aerosols. These aerosol particles consisted of incompletely neutralized sulfuric acid aerosols in NH3-poor
conditions or a mixture of ammonium nitrate and ammonium sulfate aerosols in NH3-rich conditions. Interstitial aerosols
and fog droplets presented during fog events likely yielded a minor direct contribution to the measured NH+4. The mass median aerodynamic diameter (MMAD) of the 1–4 µm mode of NH+4 strongly depended on ambient temperature (T) and can be grouped into two regimes. In one regime, the MMAD was between 1.1 and 1.7 µm in four samples, when fog oc-curred atT >0◦C, and in two samples, at T >−3◦C. The MMAD of NH+4 in this size range was also observed in vari-ous atmospheric environments, as discussed in the literature. In the other regime, the MMAD was between 2.8 and 3.4 µm in four samples when fog occurred at T <−4◦C, a phe-nomenon that was first observed in this study. The MMAD was not related to chemical composition and concentration
of ammonium salts. Further investigations are needed in or-der to fully unor-derstand the cause of the MMAD. The larger supermicron mode of ammonium salts aerosol observed at T <−4◦C has added new knowledge on the size distribu-tions and chemical composidistribu-tions of fog-processed aerosols under various ambient conditions.
1 Introduction
or even negative (Moore et al., 2004; Herckes et al., 2007). Thus, direct observation of the fog-processed aerosols is rare. Knowledge of the size distributions and chemical compo-sitions of fog-processed aerosols is limited and the factors that determine these aerosol properties are poorly understood (Law and Stohl, 2007; Yu et al., 2011).
The 1–2 µm mode of secondary particulate species in mass size distribution was recently frequently observed in specific polluted environments (Liu et al., 2008; Guo et al., 2010; Nie et al., 2010; Li et al., 2012; Tsai et al., 2012), but the fre-quency of occurrence of the mode was low in less polluted environments (Zhao and Gao, 2008; Plaza et al., 2011). The 1–2 µm mode was reported to be associated with fog events in some studies (Plaza et al., 2011; Tsai et al., 2012), but it was unclear whether it was due to fog-processed aerosols post fog events or interstitial aerosols or fog droplets present during fog events. In most of these studies, the mode was observed under humid weather conditions (Liu et al., 2008; Zhao and Gao, 2008; Guo et al., 2010; Nie et al., 2010; Li et al., 2012). Secondary particulate species in the mode have also been shown to act as one of the major contributors to some particle pollution events (Guo et al., 2010; Nie et al., 2010; Tsai et al., 2012). Unlike well-documented accumula-tion modes of secondary particulate species in the submicron size range (Ondov and Wexler, 1998), the origins of the 1– 2 µm mode need more investigations.
In addition, enhanced particle pollution in mass concen-tration was recently reported to be caused by fog-processing events (Sun et al., 2006; Biswas et al., 2008; Yu et al., 2011; Tsai et al., 2012). These episodes could be associated with chemical species newly-formed in fog droplets and a longer residence time of the species relative to the duration of the fog events. In general, fog droplets with smaller sizes should have longer residence times. However, the size distribution of fog droplets has been found to be highly variable in differ-ent fog evdiffer-ents (Frank et al., 1998; Ming and Russell, 2004; Herckes et al., 2007; Quan et al., 2011), depending on super-saturation and other factors. Thus, it is highly unpredictable
whether a fog event removes aerosols from the atmosphere or additional particulate mass is created. The same difficult situation is faced when designing field experiments for ob-serving fog-processed aerosols. A practical approach would be to search for the fog-processed aerosols from databases that have a large number of aerosol samples collected at var-ious locations and time periods.
The purpose of the present study is to identify fog-processed aerosols from a suite of field measurements made at seven inland rural sites and one coastal rural site in Canada (Zhang et al., 2008a, b) and to investigate the size distribu-tions, neutralization extents, and chemical compositions of these aerosols under various ambient conditions. The mea-surements include 192 MOUDI samples each with a duration of 6–96 h. In ten samples collected during or following fog events (Table 1), at least one supermicron mode of particulate NH+4 was observed. The origins of the measured NH+4 in the supermicron modes associated with the fog events are stud-ied in terms of fog-processed aerosols, interstitial aerosols (inactivated into droplets) and fog droplets. The variability of the chemical composition of fog-processed aerosols is ex-plored in terms of neutralization extents of acidic species and air mass histories. In addition, the variability of the size dis-tributions of the measured NH+4 is investigated with particu-lar attention on the impact of ambient temperature. The new findings, i.e., the 3–4 µm mode of ammonium salt aerosols and its dependence on ambient temperature, add new knowl-edge on size distributions of fog-processed aerosols and their probable controlling factors.
2 Methodology
2.1 Data
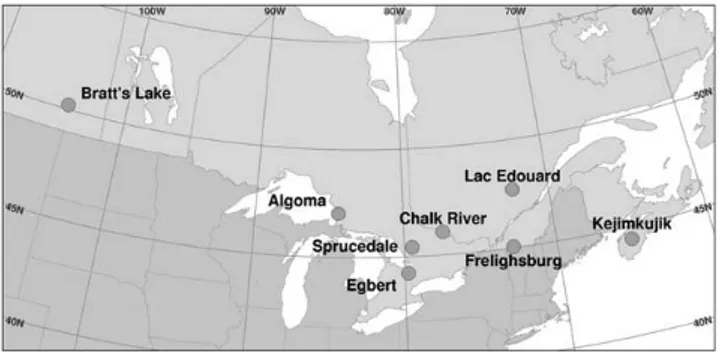
Fig. 1.Map of sampling sites.
in eastern and central Canada (Fig. 1). A total of 192 samples were collected in both cold and warm seasons. The duration of each sample varied from 6 to 96 h. Approximately 20 % of the total samples had a 48–96-h duration and were mostly collected on weekends. Approximately 60 % of the total sam-ples had a 16–29-h duration, while the remaining samsam-ples had a 6–10-h duration. Simultaneously, a PM2.5 sampler,
equipped with a Na2CO3-coated denuder and a
citric-acid-coated denuder, was also used to collect SO2, HNO3 and
NH3 gases, and PM2.5. Inorganic ions in particles were
de-termined by an ion chromatograph while organics were not measured. In addition, SO2, NOx, NOy and O3 analyzers
were used to measure their mixing ratios in minutes. On-site meteorological data were recorded to support data analysis. Fog events were judged by a combination of on-site observed relative humidity (RH>95 %) and the record (weather re-port) obtained from the meteorological station nearest to the sampling sites (http://www.wunderground.com/history). De-tailed information about the sampling sites and chemical analysis can be found in Zhang et al. (2008a, b) and Yao and Zhang (2011).
2.2 Relative acidity
The relative acidity (RA) is an important parameter for in-vestigating chemical properties of atmospheric particles. In this study, RA was calculated using all of the observed ion species in their equivalent concentrations (Kerminen et al., 2001):
RA=([NH+4] + [Na+] + [Ca2+] + [Mg2+] + [K+])/ ([SO24−] + [NO−3] + [Cl−]) (1) where [NH+4], [Na+], [Ca2+], [Mg2+], [K+], [SO2−
4 ], [NO
−
3]
and [Cl−] are equivalent concentrations of these water-extracted ions. Considering that analytical errors of ionic concentrations were generally about 5 %, except for some low concentration episodes, RA≤0.9 was thereby consid-ered a threshold used to judge the presence of acidic parti-cles in this study, while RA≥1.1 indicated that the particle was completely neutralized. When RA ranged from 0.9 to 1.1, the equivalent ratio of [NO−3]/[SO24−] was further used
to substantiate the judgment. For the episodes of low con-centration, the extent of neutralization was judged by a com-bination of (1) RA, (2) RA in the neighboring size bin, and (3) the equivalent ratio of [NO−3]/[SO24−]. The missing RA in this study was due to the concentrations of the major ion being close to the detection limit when the relative analytical error was large.
3 Results and discussion
3.1 Overview of ten samples collected during and/or post fog events
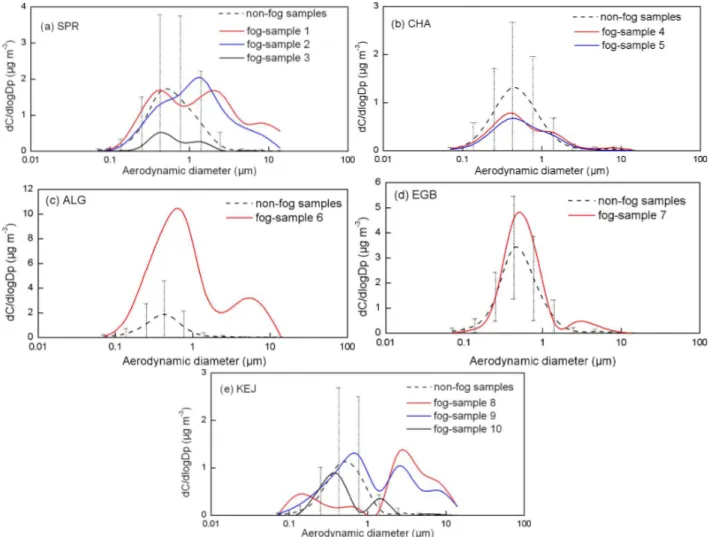
Among the total of the 192 MOUDI samples, ten samples (or about 5 % of the total) had one or two supermicron par-ticle modes of ammonium salts (6-h duration for one sam-ple, 17–29-h duration for eight samples, and 48-h duration for one sample, solid lines in Fig. 2). For the one sample with the 6-h duration, fog did not appear during the sam-pling period but appeared four hours prior to the samsam-pling. For the other nine samples, fog appeared during part of the sampling periods and also appeared some hours prior to the sampling due to the long sampling durations of these sam-ples. Supermicron modes of ammonium salts were absent in 158 non-fog samples (dashed lines in Fig. 2) where ammo-nium salt aerosols were dominantly distributed in the sub-micron particle size. Subsub-micron modes of ammonium salt aerosols in the atmosphere have been well characterized in the literature, i.e., the 0.2±0.1 µm mode due to gas-particle condensation, the 0.4±0.1 µm mode due to either primary emissions or hygroscopic growth of 0.2 µm mode particles together with chemical reactions, and the 0.7±0.2 µm mode due to in-cloud processing of aerosols (Ondov and Wexler, 1998). The supermicron mode of ammonium salts coexisted with the 0.7±0.2 µm mode of ammonium salts in four of the ten samples and coexisted with the 0.4±0.1 µm mode in the rest of the samples. The measured concentrations of NH+4 in the supermicron atmospheric particles in the ten samples were statistically higher than those in the non-fog samples at a 95 % level of confidence. Thus, the observed supermicron modes of NH+4 were probably associated with fog events, e.g., fog-processed aerosols post fog events or interstitial aerosols and fog droplets during fog events. Fog process-ing of ammonium salt aerosols involves both physical and chemical processes. For example, gases and aerosols can be scavenged by fog droplets; additional sulfuric acid and nitric acid can be formed inside the droplets enabling the droplets to absorb more NH3 in order to neutralize the acids. Thus,
Fig. 2.Mass size distributions of NH+4 in fog and non-fog samples: dashed line and error bar represent the average and standard deviation of all non-fog samples in each campaign and each colored line represents one fog-sample defined in Table 1.
It should be noted that, in 10 % of the 192 samples which might have gone through foggy days, the supermicron modes of NH+4 were not apparent. One explanation could be the high efficiency of the fog in removing large particles from the ambient air during the sampling periods. This could happen if the sampling duration was much longer than the fog event. Another possibility could be the low efficiency of MOUDI in collecting fog droplets larger than 10 µm and the fog-processed aerosols exceeded that size.
In the sections below, the origins of the measured NH+4 in supermicron atmospheric particles were analyzed in detail for each of the ten samples identified. The analysis was or-ganized as warm fog with ambient temperature (T)>0◦C (Sect. 3.2) and cold fog under T <0◦C (Sect. 3.3) since the size distribution of NH+4 in the supermicron atmospheric particles was closely related toT. One sample collected at Kejimkujik (KEJ), two at Chalk River (CHA), and two at Sprucedale (SPR) were discussed in Sect. 3.2. One sample collected at Egbert (EGB), one at Algoma (ALG), two at KEJ, and one at SPR were discussed in Sect. 3.3. The
vari-ability of the mass median aerodynamic diameter (MMAD) of NH+4 in the 1–4 µm particles was further explored in Sect. 3.4 in terms ofT effects and other factors.
3.2 Warm fog (T >0◦C)
3.2.1 Supermicron mode of incompletely neutralized ammonium salt aerosols
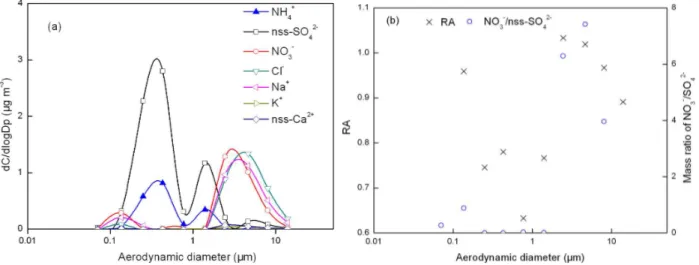
Fig. 3.Mass size distributions of ions, relative acidity (cross symbol) and mass ratio of NO−3/SO24−(circle symbol) for fog-sample 10 listed in Table 1.
median mass aerodynamic diameters (MMAD) at 0.3 and 1.4 µm, respectively (Fig. S1a). In the 1–1.8 µm size bin, NH+4 and non-sea-salt-SO24−(nss-SO24−)were two dominant inorganic species while Ca2+ and K+ were negligible. The latter suggested that the contributions of soil and biomass burning sources to the NH+4 at the 1.4 µm mode were prob-ably negligible, although soil particles and biomass burning aerosols can have a supermicron mode (Eck et al., 2003; Yao et al., 2003). The calculated air mass back trajectory showed that the air was from clear southwestern marine environ-ments (Fig. S2a, b), supporting a high contribution of sea-salt aerosols at 2–10 µm (Fig. 3a) and negligible contributions from soil particles and biomass burning aerosols. Thus, there were three potential sources for the measured NH+4 at the 1.4 µm mode, i.e., fog-processed aerosols collected after the first fog event (from 05:00 p.m. on 9 November to 11:00 a.m. on 10 November) or interstitial aerosols or fog droplets col-lected during the second fog event (from 08:00 p.m. on 10 November to 12:00 a.m. on 11 November). These three po-tential sources are explored in detail below.
The RA value of the 1–1.8 µm size bin was 0.77, indi-cating that the measured particles were acidic and that the sulfuric acid was not completely neutralized by the NH+4 (note that the relative error of RA at the 0.093–0.18 µm, 0.54–1.0 µm and 10–18 µm bins could be larger than 10 % since the measured concentrations of the major ions were just above five times the detection limits, but errors for the other size ranges were expected to be smaller). When the acidic fog droplets evaporated, the formed aerosols could have been acidic and could have contained a much smaller amount of nitrate through the evaporation of HNO3gas (Yao
et al., 2011). This was exactly what was observed for the 1– 1.8 µm size bin, where the concentration of NO−3 was negli-gible. Thus, the 1.4 µm mode of NH+4 observed in this sample was likely from the fog-processed ammonium salt aerosols.
Moore et al. (2004) and Liu et al. (2008) have also reported the mode of NH+4 at 1–2 µm after fog events. The water mole fraction of the 1–2 µm aerosols in this sample was calculated to be 0.85 using an Aerosol Inorganic Model (AIM-II, Clegg, et al., 1998; http://www.aim.env.uea.ac.uk/aim/aim.php). In modeling, the chemical composition of inorganic species in the 1–2 µm size range, as well as the averaged tempera-ture and relative humidity during the sampling period, were used as input and the gas-aerosol equilibrium was disabled since the equilibrium was unable to be achieved for incom-pletely neutralized aerosols (Yao et al., 2006, 2007). The cal-culated water mole fraction was lower, compared to that in fog droplets, where the water mole fraction has been shown to reach over 0.999 (Moore et al., 2004). The estimated in-situ pH of the 1–2 µm aerosols reached as low as 0.6 units, which does not allow the existence of NH4NO3in the
parti-cle phase.
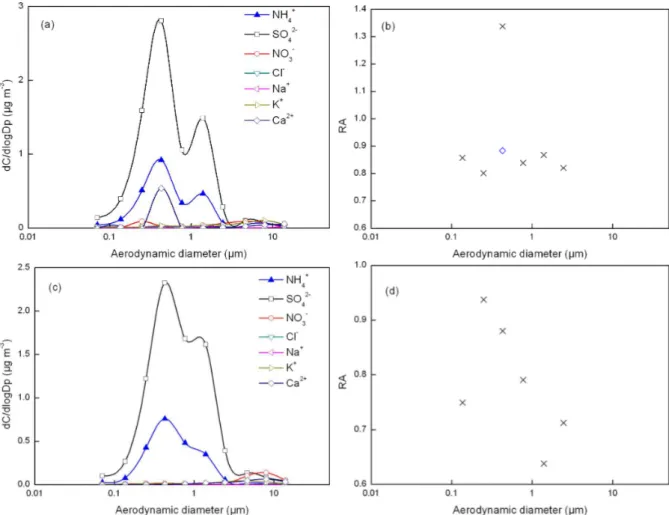
Fig. 4.Mass size distributions of ions and RA for fog-sample 4 (aandb) and fog-sample 5 (candd). The diamond symbol in(b)represents RA in which Ca2+was excluded from the estimation.
et al., 1998, 2004). Thus, it was almost impossible to form this high of a percentage of incompletely neutralized sulfuric acid on inactivated 1–1.8 µm aerosols. Alternatively, the high percentage of the incompletely neutralized sulfate acid can be formed in fog droplets (Hoag et al., 1999). Moreover, fog droplets have also been reported to contain a large amount of NH+4, SO24−and NO−3 (Klemm et al., 1994; Collett Jr. et al., 1999; Moore et al., 2004; Ming and Russell, 2004; Biswas et al., 2008; Str¨ater et al., 2010; Watanabe et al., 2010). The negligible concentration of nitrate in the 1–2 µm mode sug-gested that the measured concentration of NH+4 in this sam-ple was unlikely from the direct collection of fog drosam-plets. A significantly high concentration of ammonium nitrate salt was indeed observed at the 5–10 µm mode in some samples in this study, in which the ammonium nitrate was probably from the direct collection of fog droplets, as discussed later.
It can be argued that several factors might also cause the 1–2 µm mode of ammonium salt aerosols, e.g., variability in the relative length of time when fog was sampled, differing degrees of drying, and potential splashing of droplets in the impactor. If the 1–2 µm mode was indeed caused by these
Fig. 5.Same as in Fig. 3 except for fog-sample 1 (aandb) and fog-sample 2 (candd).
the measured NH+4 was also ascribed to fog-processed am-monium salt aerosols (incompletely neutralized). In addition, the 1.3 µm mode of the measured NH+4 on 14–15 June 2004 can also be the result of fog-processing of ammonium salt aerosols (Fig. S1c) and the NH+4 was also overwhelmingly associated with SO24−.
3.2.2 Supermicron modes of completely neutralized ammonium salt aerosols
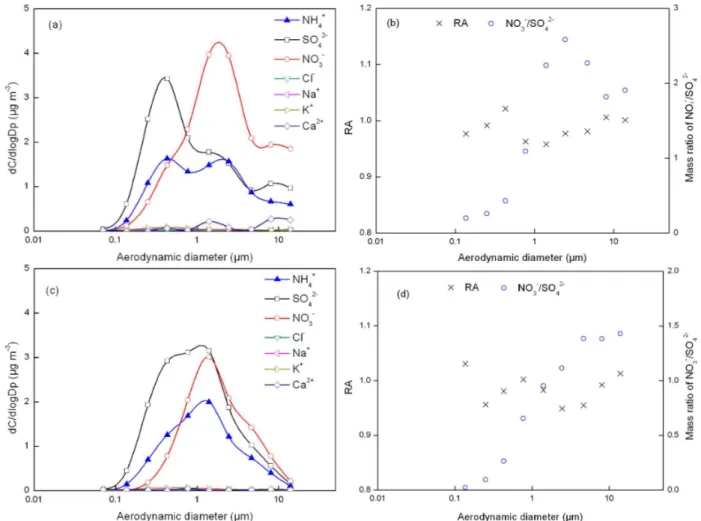
The two samples collected at SPR on 16–17 November and on 17–18 November 2004 contained significant amounts of NH+4 in supermicron particles (Fig. 5a, c) when T was higher than 0◦C. Fog occurred from 08:00 to 10:00 a.m. on 16 November (T varied from−1.9 to 0◦C) prior to the sampling, from 09:00 p.m. on 16 November to 10:00 a.m. on 17 November and from 05:00 p.m. on 17 November to 09:00 a.m. on 18 November judging by the observed RH and weather records at stations over a radius of 100 km during the two days. The RAs (0.95–1.03) narrowly oscillated around unity in the different size bins of the two samples (Fig. 5b, d), suggesting that the measured particles were neutral. In
the 1–3 µm particles, about 90 % of the SO24−and NO−3 were probably associated with NH+4. In the particles>3 µm, there was still about 70 % of the SO24−and NO−3 associated with NH+4 and the remaining less than 30 % of the SO24−and NO−3 appeared to be associated with metal ions. The elevated con-centrations of NH3gas (Table 1) apparently led to the neutral
particles and the elevated concentrations of NO2and NOz, as
well as NH3(Table 1), also favored the formation of
ammo-nium nitrate. The calculated air mass back trajectories also showed that the air came from industrial areas in the south-west (Fig. S2c, d, e).
Fig. 6.Same as in Fig. 3 except for fog-sample 7.
Hoag et al. (1999) reported an evident increase of NH+4 (neutralized sulfate) mass concentration in the 5–10 µm size range during fog events. Fahey et al. (2005) also found that the mass concentration of NH+4 (neutralized sulfate) peaked in 7–13 µm fog droplets due to a rapid formation of ammo-nium sulfate. The NH+4 at the 7.9 µm mode from the SPR 16–17 November sample was most likely caused by the di-rect collection of fog droplets. Also in the same studies by Hoag et al. (1999) and Fahey et al. (2005), the simulated concentration of NH+4 in the 1–3 µm interstitial aerosols and droplets was several times less than that in the 5–10 µm fog droplets. However, the measured concentration of NH+4 in the 1–3 µm particles in this SPR sample was over two times that in the 5–10 µm particles. Thus, the direct collection of in-terstitial aerosols and fog droplets probably yielded a minor contribution to the NH+4 at the 1.6 µm mode in this sample. Like the 1–2 µm mode of incompletely neutralized ammo-nium salt aerosols, the 1.6 µm mode of NH+4 was also mainly from fog-processed aerosols.
Two supermicron modes (at 1.2 and 5.0 µm) of NH+4 were also identified for the second SPR sample collected on 17–18 November 2004 (Fig. S1e). Following the same analysis ap-proach as for the first SPR sample, the 1.2 µm mode of NH+4 was mainly due to fog-processing of a mixture of ammonium nitrate and ammonium sulfate aerosols with an equivalent ra-tio of [NO−3]/[SO24−] at 0.74, while the 5.0 µm mode of NH+4 was probably due to the direct collection of fog droplets.
It is interesting that the mass concentrations of NH+4 in the 1.2 µm mode aerosols were higher than those in the 0.3 µm mode aerosols on 17–18 November 2004 at SPR, indicating that fog probably increased the concentration of ammonium salt in the atmosphere in this sample. Moreover, mass size distributions of fog droplets have been shown to strongly rely on supersaturation and the chemical and physical properties of the preexisting aerosols before fog events (Frank et al., 1998; Ming and Russell, 2004). Thus, it is not surprising that
the 5.0–10 µm mode of NH+4 was sometimes observed, but at other times was not detected.
3.3 Cold fog (T <0◦C)
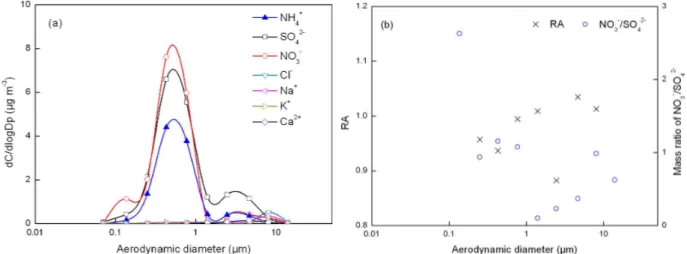
No fog occurred during the sampling period between 12:40 to 18:10 on 6 March 2002 at Egbert (EGB); however, fog lasted for four hours prior to sampling whenT was at−4 to−5◦C, and dissipated after 10:00 (less than three hours prior to sampling). The calculated air mass trajectory during the fog event showed that the air came from industrial areas in the west (Fig. S2f, g). A supermicron mode of NH+4 had the MMAD at 3.2 µm in this sample (Figs. 6a, b and S1f) and NH+4 was overwhelmingly associated with SO24−. The sum of [Ca2+] and [K+] was only 25 % of the [NH+
4] at this mode,
suggesting a minor contribution from soil and biomass burn-ing sources. The 3.2 µm mode of NH+4 was probably due to fog-processing of ammonium salt aerosols before sampling since the half lifetimes of particles in this size range were more than five hours based on their typical dry deposition velocity (e.g., on the order of 1 cm s−1).
In addition, a very high concentration of HNO3 gas
(1.7 ppb, Table 1) was observed during the sampling period. The value was even higher than the maximum daily-averaged concentration of HNO3gas observed in the winter in urban
areas of North American cities, e.g., Toronto (Godri et al., 2009) and New York (Ren et al., 2006), even under high NO2 concentration conditions. Photochemical formation of
HNO3in the gas-phase under such cold conditions and low
NO2concentrations at EGB should not be able to produce the
observed high concentration of HNO3gas. Besides, the mass
ratio of NO−3 to SO24−at the 3.2 µm mode was substantially lower than the ratio in the submicron sizes (Fig. 6b). All of this evidence points to the possibility that a large quantity of HNO3was released into the gas phase when the fog droplets
Fig. 7.Same as in Fig. 3 except for fog-sample 8 (aandb) and fog-sample 9 (candd).
RA (0.88) of the 1.8–3.2 µm size bin. The estimated in-situ pH of aerosols at this size bin was as low as 0.04, while the water mole fraction was estimated to be 0.83. In such an acidic and concentrated aerosol solution, NO−3 would be released as HNO3into the gas phase. RAs of all the
supermi-cron size bins (except 1.8–3.2 µm) in this sample were in the range of 1.0 and 1.03, which could be explained by the re-lease of HNO3that decreased the particle acidity. Thus, the
post process of fog-processing during this sampling period may have been a source of HNO3gas.
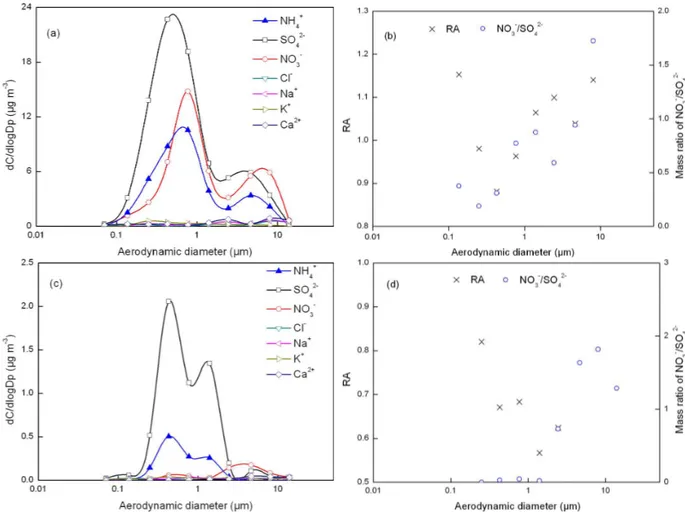
Two samples collected at KEJ encountered fog under T <0◦C conditions. One sample was collected during 8– 9 November 2002 (Fig. 7a, b) and another one was during 9–10 November 2002 (Fig. 7c, d). The ambient temperature ranged from−2.6 to −8.8◦C during the first sampling pe-riod (Table 1) and fog occurred from 05:00 to 08:00 a.m. on 8 November, judging by the measured RH. In this sam-ple, NH+4 and nss-SO24−were two dominant ionic species in the particles that were<3 µm where the RA varied from 0.7 to 0.9, suggesting that the ammonium salt was incompletely neutralized. Two supermicron modes of NH+4 had MMADs at 2.8 and 7.5 µm, respectively, in this sample (Fig. S1h).
Fig. 8.Same as in Fig. 3 except for fog-sample 6 (aandb) and fog-sample 3 (candd).
and/or the differing degrees of drying, played any significant role on the formation of the 2.8 µm mode (otherwise, the in-completely neutralized acids would be consistent for parti-cles of the 2.8 µm mode and larger partiparti-cles).
The second sample on 9–10 November at KEJ was the sample collected immediately after the first sample on 8–9 November. Similar to the findings in sample 1, the NH+4 in supermicron particles also had two modes at 2.8 and 7.5 µm, respectively (Figs. 7c, d, S1i). The 2.8 µm mode of NH+4 observed on 9–10 November was likely associated with the fog event atT <−4◦C before sampling. The NH+
4 was
ap-parently associated with SO24− and the ammoniated sulfu-ric acid salt aerosols were incompletely neutralized (Yao and Zhang, 2012). Fog occurred from 05:00 p.m. on 9 November to 11:00 a.m. on 10 November whenT >0◦C. The 7.5 µm mode of NH+4 was likely due to the direct collection of fog droplets.
The highest concentration of NH+4 in supermicron parti-cles was observed on 19–20 February 2003 at ALG (Fig. 8a, b) whenT ranged from−5.2 to−8.8◦C. Fog occurred from 07:00 to 10:00 a.m. on 19 February with−8.0< T <−7.0, and from 08:00 p.m. on 19 February to 11:00 a.m. on
20 February with −8.8< T <−5.2◦C. Two supermicron modes of NH+4 had MMADs at 3.4 and 7.5 µm (Fig. S1g). Following the analysis of bi-modal supermicron modes of NH+4 presented above, the NH+4 in the 3.4 µm mode was mainly ascribed to fog-processed ammonium salt aerosols prior to the sampling (air mass came from the northeast, Fig. S2h) while the NH+4 in the 7.5 µm mode was probably from the direct contribution of fog droplets in the sampling (air mass came from the southeast, Fig. S2i).
Fig. 9.Variations of MMAD and dCmaxof fog-processed NH+4 aerosol versus lowest hourly average ofT in the fog event associated with
the aerosols, and [NO−3]/[SO24−] versus RA in fog-processed aerosol (dCmax/dlogDpwas obtained when log-normal functions were fitting
the size distribution of NH+4), high [NO−3]/[SO24−] in (b, the circled point) is because ammonium salt externally coexisted with nitrate (Yao and Zhang, 2012).
3.4 Variability of MMAD of fog-processed ammonium salt aerosols
When the MMAD of fog-processed ammonium salt aerosols (<4 µm) was plotted against the lowest hourly average of T during the fog event associated with the aerosols, it was found that the MMAD could be grouped into two regimes (Fig. 9a). In Regime 1, the MMAD was between 2.8 and 3.4 µm, when the lowest hourly average of T during the fog events was less than−4◦C. In Regime 2, the MAAD was be-tween 1.1 and 1.7 µm, when the lowest hourly average ofT was over−3◦C and most of theT was over 0◦C. The con-centrations of the measured NH+4 in Regime 1 were some-times higher and other some-times lower than those in Regime 2 (Fig. 9a). Thus, the differences of MMADs between the two regimes were not likely determined by the concentrations of NH+4. Neither were the differences likely determined by the chemical compositions and neutralization extents of ammo-nium salts, as shown in Fig. 9b.
Theoretically, the MMAD of fog-processed aerosols should be determined by four factors, i.e., chemical com-position, the absolute amount of different chemical species, ambient temperature, and relative humidity. The relative hu-midity can affect the mole fractions of water and change the MMAD. The calculated mole fractions of water were simi-lar between the two regimes. For example, the fraction was 0.85 for the 1.4 µm mode aerosol collected at KEJ during 10–11 November 2002; 0.83 for the 3.2 µm mode aerosol collected at EGB on 6 March 2002; and 0.84 for the 2.8 µm mode aerosol collected at ALG on 19–20 February 2003. The liquid water content was thus unlikely to explain the mode size differences between the two regimes (note that only in-organic species are included in the AIM model). The mass
transfer of water could not be the cause for the mode size differences because the time scale to attain an equilibrium between water vapor and liquid water is within a few min-utes (Kerminen, 1997; Chan and Chan, 2005; DeMott et al., 2009).
It should be noted that our analysis was based on the mea-sured inorganic species. Yao et al. (2011) reported that am-monium salts were usually internally mixed with organics in atmospheric particles in eastern Canada. Organics can play an important role in fog events (Ming and Russell, 2004; Russell et al., 2009; Moore et al., 2011; Asa-Awuku et al., 2011; Gierlus et al., 2012). Rehbein et al. (2011) recently reported that more semi-volatile species can partition in the particulate phase in those lowT fog events. The impact of organics on the two regimes should be investigated further in the future.
4 Conclusions
T, but not to the chemical compositions and concentrations of ammonium salts.
Supplementary material related to this article is
available online at: http://www.atmos-chem-phys.net/12/ 11165/2012/acp-12-11165-2012-supplement.pdf.
Acknowledgements. We appreciate R. Vet, A. Wiebe, C. Mihele, S. Iqbal for data collection and data quality control, Yujiao Zhu for providing assistance in figure preparation, and L. Paige Murphy for editing the paper.
Edited by: L. M. Russell
References
Aikawa, M., Hiraki, T., Suzuki, M., Tamaki, M., and Kasahara, M.: Separate chemical characterizations of fog water, aerosol, and gas before, during, and after fog events near an industrialized area in Japan, Atmos. Environ., 41, 1950–1959, 2007.
Asa-Awuku, A., Moore, R. H., Nenes, A., Bahreini, R., Holloway, J. S., Brock, C. A., Middlebrook, A. M., Ryerson, T. B., Jimenez, J. L., DeCarlo, P. F., Hecobian, A., Weber, R. J., Stickel, R., Tanner, D. J., and Huey, L. G.: Airborne cloud condensation nuclei mea-surements during the 2006 Texas Air Quality Study, J. Geophys. Res., 116, D11201, doi:10.1029/2010JD014874, 2011.
Biswas, K. F., Ghauri, B. M., and Husain, L.: Gaseous and aerosol pollutants during fog and clear episodes in South Asian urban atmosphere, Atmos. Environ., 42, 7775–7785, 2008.
Chan, M. N. and Chan, C. K.: Mass transfer effects in hygro-scopic measurements of aerosol particles, Atmos. Chem. Phys., 5, 2703–2712, doi:10.5194/acp-5-2703-2005, 2005.
Clegg, S. L., Brimblecombe, P., and Wexler, A. S.: A thermody-namic model of the system H+-NH+4-SO24−-NO−3-H2O at
tropo-spheric temperatures, J. Phys. Chem. A, 102, 2137–2154, 1998. Collett Jr., J. L., Hoag, K. J., Rao, X., and Pandis, S. N.: Internal
acid buffering in San Joaquin Valley fog drops and its influence on aerosol processing, Atmos. Environ., 33, 4833–4847, 1999.
Res. Lett., 30, 2035, doi:10.1029/2003GL017861, 2003. Fahey, K. M., Pandis, S. N., Collett Jr., J. L., and Herckes, P.: The
in-fluence of size-dependent droplet composition on pollutant pro-cessing by fogs, Atmos. Environ., 39, 4561–4574, 2005. Frank, G., Martinsson, B. G., Cederfelt, S.-I., Berg, O. H.,
Swi-etlicki, E., Wendisch, M., Yuskiewicz, B., Heintzenberg, J., Wiedensohler, A., Orsini, D., Stratmann, F., Laj, P., and Ricci, L.: Droplet formation and growth in polluted fogs, Contr. Atmos. Phys., 71, 65–85, 1998.
Gierlus, K. M., Laskina, O., Abernathy, T. L., and Grassian, V. H.: Laboratory study of the effect of oxalic acid on the cloud conden-sation nuclei activity of mineral dust aerosol, Atmos. Environ., 46, 125–130, 2012.
Godri, K. J., Evans, G. J., Slowik, J., Knox, A., Abbatt, J., Brook, J., Dann, T., and Dabek-Zlotorzynska, E.: Evaluation and ap-plication of a semi-continuous chemical characterization sys-tem for water soluble inorganic PM2.5 and associated precur-sor gases, Atmos. Meas. Tech., 2, 65–80, doi:10.5194/amt-2-65-2009, 2009.
Guo, S., Hu, M., Wang, Z. B., Slanina, J., and Zhao, Y. L.: Size-resolved aerosol water-soluble ionic compositions in the summer of Beijing: implication of regional secondary formation, Atmos. Chem. Phys., 10, 947–959, doi:10.5194/acp-10-947-2010, 2010. Herckes, P., Chang, H., Lee, T., and Collett Jr., J. L.: Air pollution processing by radiation fogs, Water Air Soil Poll., 181, 65–75, 2007.
Hoag, K. J., Collett Jr., J. L., and Pandis, S. N.: The influence of drop size-dependent fog chemistry on aerosol processing by San Joaquin Valley fogs, Atmos. Environ., 33, 4817–4832, 1999. Kaul, D. S., Gupta, T., Tripathi, S. N., Tare, V., and Collett Jr., J.
L.: Secondary organic aerosol: a comparison between foggy and nonfoggy days, Environ. Sci. Technol., 45, 7307–7313, 2011. Keene, W. C., Sander, R., Pszenny, A. A. P., Vogt, R., Crutzen, P. J.,
and Galloway, J. N.: Aerosol pH in the marine boundary layer: A review and model evaluation, J. Aerosol Sci., 29, 339–356, 1998. Keene, W. C., Pszenny, A. A. P., Maben, J. R., Stevenson, E., and Wall, A.: Closure evaluation of size-resolved aerosol pH in the New England coastal atmosphere during summer, J. Geophys. Res., 109, 307, doi:10.1029/2004JD004801, 2004.
Kerminen, V.-M., Hillamo, R., Teinil¨a, K., Pakkanen, T., Allegrini, I., and Sparapani, R.: Ion balances of size resolved tropospheric aerosol samples: implications for the acidity and atmospheric processing of aerosols, Atmos. Environ., 35, 5255–5265, 2001. Klemm, O., Bachmeier, A. S., Talbot, R. W., and Klemm, K. I.:
Fog chemistry at the New England coast: Influence of air mass history, Atmos. Environ., 28, 1181–1188, 1994.
Lan, Z.-J., Chen, D.-L., Li, X., Huang, X.-F., He, L.-Y., Deng, Y.-G., Feng, N., and Hu, M.: Modal characteristics of carbonaceous aerosol size distribution in an urban atmosphere of South China, Atmos. Res., 100, 51–60, 2011.
Law, K. S. and Stohl, A.: Arctic air pollution: origins and impacts, Science, 315, 1537–1540, 2007.
Li, X., Wang, L., Wang, Y., Wen, T., Yang, Y, Zhao, Y., and Wang, Y.: Chemical composition and size distribution of airborne par-ticulate matters in Beijing during the 2008 Olympics, Atmos. En-viron., 50, 278–286, 2012.
Liu, S., Hu, M., Slanina J., He, L. Y., Niu, Y. W., Bruegemann, E., Gnauk, T., and Herrmann, H.: Size distribution and source analysis of ionic compositions of aerosols in polluted periods at Xinken in Pearl River Delta (PRD) of China, Atmos. Environ., 42, 6284–6295, 2008.
Ming, Y. and Russell, L. M.: Organic aerosol effects on fog droplet spectra, J. Geophys. Res., 109, D10206, doi:10.1029/2003JD004427, 2004.
Moore, K. F., Sherman, D. E., Reilly, J. E., Hannigan, M. P., Lee, T., and Collett Jr., J. L.: Drop size-dependent chemical compo-sition of clouds and fogs. Part II: Relevance to interpreting the aerosol/trace gas/fog system, Atmos. Environ., 38, 1403–1415, 2004.
Moore, M. J. K., Furutani, H., Roberts, G. C., Moffet, R. C., Gilles, M. K., Palenik, B., and Prather, K. A.: Effect of organic com-pounds on cloud condensation nuclei (CCN) activity of sea spray aerosol produced by bubble bursting, Atmos. Environ., 45, 7462– 7469, 2011.
Nie, W., Wang, T., Gao, X., Pathak, R. K., Wang, X., Gao, R., Zhang, Q., Yang, L., Wang, W.: Comparison among filter-based, impactor-based and continuous techniques for measuring atmo-spheric fine sulfate and nitrate, Atmos. Environ., 44, 4396–4403, 2010.
Ondov, J. M. and Wexler, A. S.: Where do particulate toxins reside? An improved paradigm for the structure and dynamics of the ur-ban mid-Atlantic aerosol, Environ. Sci. Technol., 32, 2547–2555, 1998.
Pandis, S. N., Seinfeld, J. H., and Pilinis, C.: Chemical composition differences in fog and cloud droplets of different sizes, Atmos. Environ., 24, 1957–1969, 1990.
Plaza, J., Pujadas, M., G´omez-Moreno, F. J., S´anchez, M., and Art´ı˜nano, B.: Mass size distributions of soluble sulfate, nitrate and ammonium in the Madrid urban aerosol, Atmos. Environ., 45, 4966–4976, 2011.
Quan, J., Zhang, Q., He, H., Liu, J., Huang, M., and Jin, H.: Analy-sis of the formation of fog and haze in North China Plain (NCP), Atmos. Chem. Phys., 11, 8205–8214, doi:10.5194/acp-11-8205-2011, 2011.
Rehbein, P. J. G., Jeong, C.-H., McGuire, M. L., Yao, X. H., Corbin, J. C., and Evans, G. J.: Cloud and fog processing enhanced gas-to-particle partitioning of trimethylamine, Environ. Sci. Tech-nol., 45, 4346–4352, 2011.
Ren, X., Brune, W. H., Mao, J., Mitchell, M. J., Lesher, R. L., Sim-pas, J. B., Metcalf, A. R., Schwab, J. J., Cai, C., Li, Y., Demer-jian, K. L., Felton, H. D., Boynton, G., Adams, A., Perry, J., He, Y., Zhou, X., and Hou, J.: Behavior of OH and HO2in the winter
atmosphere in New York City, Atmos. Environ., 40, S252–S263, 2006.
Russell, L. M., Hawkins, L. N., Frossard, A. A., Quinn, P. K., and Bates, T. S.: Carbohydrate-like composition of submicron atmo-spheric particles and their production from ocean bubble burst-ing, P. Natl. Acad. Sci., 107, 6652–6657, 2009.
Str¨ater, E., Westbeld, A., and Klemm, O.: Pollution in coastal fog at Alto Patache, Northern Chile, Environ. Sci. Pollut. Res. (Interna-tional), 17, 1563–1573, 2010.
Sun, J. and Ariya, P. A.: Atmospheric organic and bio-aerosols as cloud condensation nuclei (CCN): a review, Atmos. Environ., 40, 795–820, 2006.
Sun, Y., Zhuang, G., Tang, A. A., Wang, Y., and An, Z.: Chemi-cal characteristics of PM2.5and PM10 in haze-fog episodes in
Beijing, Environ. Sci. Technol., 40, 3148–3155, 2006.
Tsai, J.-H., Lin, J.-H., Yao, Y.-C., and Chiang, H.-L.: Sized and water soluble ions of ambient particulate matter on episode and non-episode days in southern Taiwan, Aerosol Air Qual. Res., 12, 263–274, 2012.
Watanabe, K., Honoki, H., Iwai, A., Tomatsu, A., Noritake, K., Miyashita, N., Yamada, K., Yamada, H., Kawamura, H., and Aoki, K.: Chemical characteristics of fog water at Mt. Tateyama, near the coast of the Japan Sea in central Japan, Water Air Soil Poll., 211, 379–393, 2010.
Yao, X. H. and Zhang, L.: Sulfate formation in atmospheric ultrafine particles at Canadian inland and coastal rural environments, J. Geophys. Res., 116, D10202, doi:10.1029/2010JD015315, 2011. Yao, X. H. and Zhang, L.: Chemical processes in sea-salt chloride depletion observed at a Canadian rural coastal site, Atmos. Env-iron., 46, 189–194, 2012.
Yao, X. H., Lau, A. P. S., Fang, M., Chan, C. K., and Hu, M.: Size distributions and formation of ionic species in atmospheric par-ticulate pollutants in Beijing, China: 1 – inorganic ions, Atmos. Environ., 37, 2991–3000, 2003.
Yao, X. H., Ling, T. Y., Fang, M., and Chan, C. K.: Comparison of thermodynamic predictions for in-situ pH in PM2.5, Atmos.
Environ., 40, 2835–2844, 2006.
Yao, X. H., Ling, T. Y., Fang, M., and Chan, C. K.: Size dependence of in-situ pH in submicron atmospheric particles in Hong Kong, Atmos. Environ., 41, 382–393, 2007.
Yao, X. H., Rehbein, P. J. G., Lee, C. J., Evans, G. J., Corbin, J., and Jeong, C.-H.: A study on the extent of neutralization of sul-phate aerosol through laboratory and field experiments using an ATOFMS and a GPIC, Atmos. Environ., 45, 6251–6256, 2011. Yu, X., Zhu, B., Yin, Y., Yang, J., Li, Y., and Bu, X.: A
compara-tive analysis of aerosol properties in dust and haze-fog days in a Chinese urban region, Atmos. Res., 99, 241–247, 2011. Zhang, L., Vet, R., Wiebe, A., Mihele, C., Sukloff, B., Chan,
E., Moran, M. D., and Iqbal, S.: Characterization of the size-segregated water-soluble inorganic ions at eight Canadian rural sites, Atmos. Chem. Phys., 8, 7133–7151, doi:10.5194/acp-8-7133-2008, 2008a.

![Fig. 9. Variations of MMAD and dC max of fog-processed NH + 4 aerosol versus lowest hourly average of T in the fog event associated with the aerosols, and [NO − 3 ]/[SO 2−4 ] versus RA in fog-processed aerosol (dC max /dlogD p was obtained when log-normal](https://thumb-eu.123doks.com/thumbv2/123dok_br/18185236.331658/11.892.83.809.94.357/variations-processed-aerosol-average-associated-aerosols-processed-obtained.webp)
