Submitted11 February 2016
Accepted 16 March 2016
Published5 April 2016
Corresponding author
Hiroshi Nishiura, nishiurah@gmail.com
Academic editor
Giovanni Benelli
Additional Information and Declarations can be found on page 12
DOI10.7717/peerj.1904 Copyright
2016 Nah et al.
Distributed under
Creative Commons CC-BY 4.0 OPEN ACCESS
Estimating risks of importation and local
transmission of Zika virus infection
Kyeongah Nah1,2,3, Kenji Mizumoto1,3,4, Yuichiro Miyamatsu1,2,3, Yohei Yasuda1,
Ryo Kinoshita1,2,3and Hiroshi Nishiura1,2,3
1Graduate School of Medicine, The University of Tokyo, Tokyo, Japan 2CREST, Japan Science and Technology Agency, Saitama, Japan 3Graduate School of Medicine, Hokkaido University, Sapporo, Japan
4Graduate School of Arts and Sciences, The University of Tokyo, Tokyo, Japan
ABSTRACT
Background. An international spread of Zika virus (ZIKV) infection has attracted global attention. ZIKV is conveyed by a mosquito vector,Aedes species, which also acts as the vector species of dengue and chikungunya viruses.
Methods.Arrival time of ZIKV importation (i.e., the time at which the first imported case was diagnosed) in each imported country was collected from publicly available data sources. Employing a survival analysis model in which the hazard is an inverse function of the effective distance as informed by the airline transportation network data, and using dengue and chikungunya virus transmission data, risks of importation and local transmission were estimated.
Results.A total of 78 countries with imported case(s) have been identified, with the arrival time ranging from 1 to 44 weeks since the first ZIKV was identified in Brazil, 2015. Whereas the risk of importation was well explained by the airline transportation network data, the risk of local transmission appeared to be best captured by additionally accounting for the presence of dengue and chikungunya viruses.
Discussion. The risk of importation may be high given continued global travel of mildly infected travelers but, considering that the public health concerns over ZIKV infection stems from microcephaly, it is more important to focus on the risk of local and widespread transmission that could involve pregnant women. The predicted risk of local transmission was frequently seen in tropical and subtropical countries with dengue or chikungunya epidemic experience.
SubjectsMathematical Biology, Epidemiology, Infectious Diseases, Public Health
Keywords Zika virus, Importation, Risk, Mathematical model, Transmission, Statistical estimation, Network, Epidemiology
INTRODUCTION
to have been caused by ZIKV infection among pregnant women (Staples et al., 2016). The causal relationship between ZIKV infection and microcephaly has yet to be fully established, but an increasing amount of scientific evidence strongly supports the epidemiological link of ZIKV with microcephaly (Mlakar et al., in press; Brasil et al., in press; Nishiura et al., 2016b). Considering the expected impact on neurological manifestations including microcephaly and Guillain-Barré Syndrome (GBS), the World Health Organization issued the Public Health Emergency of International Concern (PHEIC) on 1 February 2016.
ZIKV shares self-limiting clinical signs and symptoms with dengue virus (DENV) and chikungunya virus (CHIKV) (Ioos et al., 2014). Moreover, these viruses are also conveyed by the common mosquito vector,Aedes species. Technically, the infected cases could be observed in any part of the world in the presence ofAedes species, but the risk of transmission in Latin American and Caribbean countries has been anticipated to be high (Musso, Cao-Lormeau & Gubler, 2015;Bogoch et al., 2016). The transmission potential of ZIKV infection has been shown to be comparable to those of DENV and CHIKV (Nishiura et al., 2016a). Considering that there are no specific treatments for these arboviruses, it is of utmost importance to intervene transmission by preventing mosquito biting (e.g., the use of repellent) or controllingAedesspecies, most notably by targeting highly invasive species including Aedes aegyptiandAedes albopictus. The control option ofAedesspp. includes source reduction (i.e., removal of water and covering water storage containers), the use of ovitrap, chemical control, bioinsecticides and biological control (e.g., mosquitofish) (Anonymous, 2016), while recent approaches include transgenic and symbiont-based approaches and the use of plant-borne molecules (Adelman & Tu, 2016;Benelli, 2016; Benelli & Mehlhorn, 2016).
To plan for forthcoming potential local transmission at each country level, it is fruitful to understand the actual risk of Zika virus epidemic in a quantitative manner. The present real-time study aimed to identify countries at high risk of importing ZIKV infection and also of local transmission as a part of risk assessment practice and for improved understanding of the predicted risk of the spread, with distinct differentiation of ZIKV importation alone from that of local transmission.
MATERIALS & METHODS
Epidemiological data
transmission, the median week was used as the week of importation. The latest time at which the importation week was systematically examined was 31 January 2016.
In addition to the importation data, we collected the list of countries with local transmission of ZIKV from theEuropean Centre for Disease Prevention and Control (2016) andGatherer & Kohl (2016). ECDC resource has specified countries or territories with reported confirmed autochthonous cases of ZIKV infection in the past 9 months. Since theEuropean Centre for Disease Prevention and Control (2016)list misses countries that experienced local transmission in 2014 or earlier, we extracted the list of those earlier countries from Gatherer & Kohl (2016). Again, the virus isolation from mosquitoes or primates other than humans was regarded as a signature of local transmission.
As additional input of prediction models, an open source airline transportation network data were extracted. Using theGlobal Flights Network (2016)derived from the OpenFlights database as of 10 November 2014 (Contentshare, 2016), we obtained the total number of flight routes between each pair of countries (a total of 230 airports and 4,600 flight routes). Furthermore, the country-specific presence of Aedesspecies, especially focusing onAedes albopictus,Aedes aegyptiandAedes africana,was explored (Kraemer et al., 2015; The Walter Reed Biosystematics Unit, USA, 2016). The list of countries with at least one of the abovementionedAedes species was prepared, because the local human-vector-human transmission of ZIKV infection occurs only where the vector species are present. Similarly, we also retrieved the country-specific data regarding DENV and CHIKV epidemic (Centers for Disease Control and Prevention, 2016a;Centers for Disease Control and Prevention, 2016b), because they share major vector species with ZIKV and their epidemics indicate that the vector species have been actively involved in local transmission. Moreover, it has been explicitly discussed that international spread of Zika virus followed the geographic path of CHIKV (Musso, Cao-Lormeau & Gubler, 2015). The presence of Aedesspecies, DENV and CHIKV were all dealt with as dichotomous variable.
Prediction model
We estimated the risk of importing ZIKV and that of local transmission using a survival analysis model. LetT be a continuous random variable with probability density function of the time from importation in Brazil to importation in countryj,fj(t), and cumulative
distribution functionFj(t)=Pr(T<t). The functionFj(t) describes the probability that
ZIKV has been already imported to a countryj by timet. The timet=0 corresponds to the time at which ZIKV infection was first recognized in Brazil and started to rapidly spread across countries (i.e., week 12 of 2015). We parameterize the hazard functionλ(t) using the effective distance, the metric derived from the airline transportation network (Contentshare, 2016). Let{n1,n2,...nl} be the sequence of transit countries at which a
traveler starting from countryn1(with a destinationnl) stops over. The length of path of
that travel isl. The effective length of the path,dn1nl, is defined by
dn1nl=l−log l−1 Y
k=1
wherePji denotes the conditional probability that an individual that lefti moves toj.
Assuming that the number of passengers is identical among all international flights, the transition matrix is calculated asPji=Pwji
kwki, wherewkiis the number of direct flights from country ito countryk per unit time derived from airline transportation network data (Contentshare, 2016). Finally, the effective distancemj of a countryjfrom the country of
origin (i.e., Brazil) is calculated as the minimum of the all possible effective lengths of path that goes from the origin country to the countryj. The effective distance has been known as an excellent predictor of the arrival time of SARS (severe acute respiratory syndrome) and influenza pH1N1 2009 (Brockmann & Helbing, 2013). Considering that the effective distance is a critical indicator of the risk of importation, we assume that the hazard function is an inverse of the effective distance, i.e.,
λj(t)=
k mj
, (2)
wherek is a constant. Using the hazard function, the abovementioned density function is modeled as
fj(t)=λj(t)exp(− Z t
0
λj(s)ds). (3)
Modeling fj(t) in this way, the mean arrival time of the ZIKV to a countryj would be
proportional to the effective distance from the origin of spread (i.e., Brazil in our case study).
Using the calculated risk of importation, we subsequently model the country specific risk of local transmission. Letpj be the conditional probability of ZIKV transmission given an
importation event in a countryj. Since our time scale of examining the risk of importation is much longer than the generation time of ZIKV infection, we ignore the time-lag that is required for observing the transmission cycle, and the risk of the local transmission of ZIKV in a countryjis modeled as
gj(t)=pjfj(t). (4)
In order to estimatepj, the conditional probability of experiencing local transmission, we
use datasets of the presence ofAedesspecies, CHIKV and DENV in each country. More specifically, we modelpj by employing a logit model
pj=
1 1+exp
− a0+Piβixji
, (5)
wherea0is an intercept,xji is the dichotomous variable that describes the presence of
Aedesmosquitoes (fori=1), CHIKV (fori=2) and DENV (fori=3) in countryj, andβi
represents the coefficient for corresponding variablei.
Parameter estimation and risk assessment
We estimate parametersk,a0and threeβi using a maximum likelihood method. Since
2015), countries that had imported ZIKV in advance (e.g., Africa and South Pacific) were removed before the implementation. In total, we predict the risks of importation and local transmission among a total of 189 countries. The model was fitted at week 46 since importation in Brazil (and the week 46 corresponds to the latest time at which our systematic survey of importation dates was completed in January 2016). Although five countries (Aruba, Trinidad and Tobago, Marshall Islands, Saint Vincent and the Grenadines, and American Samoa) were specified as countries with local transmission by ECDC data source (European Centre for Disease Prevention and Control , 2016), these countries have experienced importation and confirmation in February 2016, and were thus removed from the list of countries with importation as well as local transmission.
The likelihood of importation risk adhered to survival model. That is, among countries that have already imported ZIKV by then, the arrival timetj was used for parameter
estimation. Countries that have not imported ZIKV by week 46 were dealt with as the censored observation. In other words, the survival time for those countries is considered to be at least as long as the duration of our study. The likelihood function reads
L k,a0,βi;tj,xj,tm
=Y
j∈A
pjfj(tj) Y
j∈B
(1−pj)fj tj Y
j∈C
(1−Fj(tm)), (6)
whereArepresents the set of countries which experienced local transmission of ZIKV by time of observationtm (31 January 2016),Brepresents countries which imported ZIKV
before tm but without local transmission, and C is the set of countries which has not
imported bytm. Once the parameterk is estimated, we are able to predict the probability
of countryj to experience local transmission of ZIKV by timet as
Gj(t)=pj(1−e −kt
mj). (7)
We assessed the diagnostic performance of our models in predicting risks of importation and local transmission by employing the receiver operating characteristic (ROC) curve and measuring the area under the curve (AUC) (Greiner, Pfeiffer & Smith, 2000). The predictors of local transmission inEq. (5)were varied by using 1–3 variables (by examining all possible combinations ofAedes, DENV and CHIKV), and we compared AUC to identify the best predictive model. To avoid serious collinearity amongAedes, DENV and CHIKV, Cohen’s kappa, an agreement statistic, was computed to examine correlations between two dichotomous explanatory variables. For each model, the optimal cut-off value of estimated risk was calculated using Youden’s index. While model fit was assessed in week 46, the prediction has been made in week 92 that corresponds to the end of 2016.
RESULTS
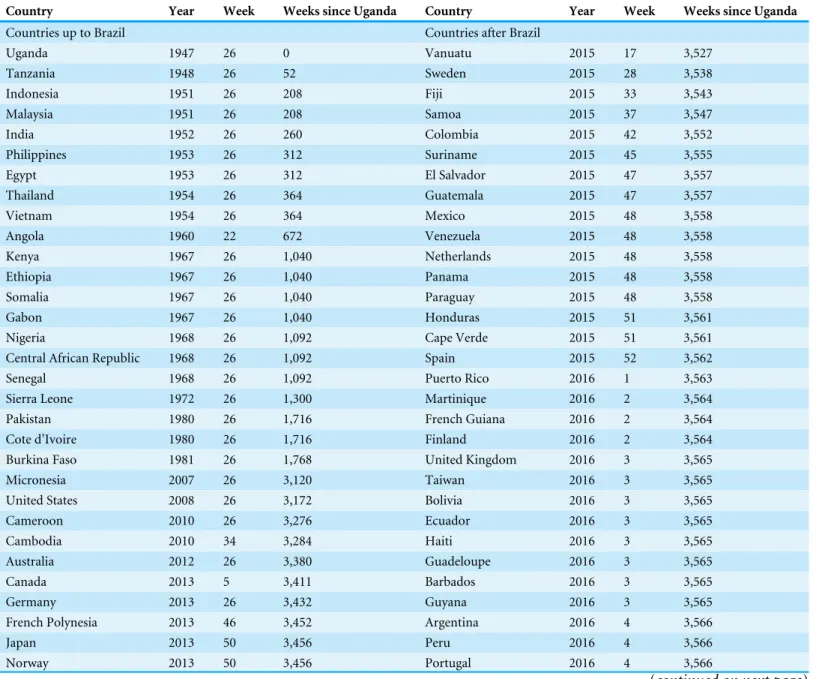
Table 1 The list of countries that experienced importation of Zika virus infection.The earliest date at which an infected individual has likely to have entered the country is shown as the week counting from week 26, 1946. Extracting the dataset from the World Health Organization source, the week number of the report has been originally written and we used it as the week of importation. When the exact week was unavailable, the mid-point of the available time window was used as the week of importation. The first day of the year was set to be the first Sunday of January. One year was calculated to be exactly equal to 52 weeks in our analysis. Although three confirmed cases of ZIKV infection were reported in Chile on 2 Febru-ary 2016, that data was ignored in the present study because the latest time was set at fourth week of 2016. We also did not count a case report from Easter Island, a Chilean island in the southeastern Pacific Ocean, because the island is geographically distant from other parts of Chile and has only one airport (World Health Organization, Western Pacific Region, 2016). In Australia, although one imported case is reported, there were no available sources of information to identify the date of confirmation. Instead, given that the corresponding article was received on 16 January 2013, we con-sider that the importation event took place in the previous year, 2012, and took the mid-point of the year as the week of importation (Kwong, Druce & Leder, 2013). In Zambia, a cross sectional study was conducted, but there was no available information to identify the date of importation or sur-vey. Thus, the year of the acceptance of the article, 2015, was assumed as the year of importation (Babaniyi et al., 2015).
Country Year Week Weeks since Uganda Country Year Week Weeks since Uganda
Countries up to Brazil Countries after Brazil
Uganda 1947 26 0 Vanuatu 2015 17 3,527
Tanzania 1948 26 52 Sweden 2015 28 3,538
Indonesia 1951 26 208 Fiji 2015 33 3,543
Malaysia 1951 26 208 Samoa 2015 37 3,547
India 1952 26 260 Colombia 2015 42 3,552
Philippines 1953 26 312 Suriname 2015 45 3,555
Egypt 1953 26 312 El Salvador 2015 47 3,557
Thailand 1954 26 364 Guatemala 2015 47 3,557
Vietnam 1954 26 364 Mexico 2015 48 3,558
Angola 1960 22 672 Venezuela 2015 48 3,558
Kenya 1967 26 1,040 Netherlands 2015 48 3,558
Ethiopia 1967 26 1,040 Panama 2015 48 3,558
Somalia 1967 26 1,040 Paraguay 2015 48 3,558
Gabon 1967 26 1,040 Honduras 2015 51 3,561
Nigeria 1968 26 1,092 Cape Verde 2015 51 3,561
Central African Republic 1968 26 1,092 Spain 2015 52 3,562
Senegal 1968 26 1,092 Puerto Rico 2016 1 3,563
Sierra Leone 1972 26 1,300 Martinique 2016 2 3,564
Pakistan 1980 26 1,716 French Guiana 2016 2 3,564
Cote d’Ivoire 1980 26 1,716 Finland 2016 2 3,564
Burkina Faso 1981 26 1,768 United Kingdom 2016 3 3,565
Micronesia 2007 26 3,120 Taiwan 2016 3 3,565
United States 2008 26 3,172 Bolivia 2016 3 3,565
Cameroon 2010 26 3,276 Ecuador 2016 3 3,565
Cambodia 2010 34 3,284 Haiti 2016 3 3,565
Australia 2012 26 3,380 Guadeloupe 2016 3 3,565
Canada 2013 5 3,411 Barbados 2016 3 3,565
Germany 2013 26 3,432 Guyana 2016 3 3,565
French Polynesia 2013 46 3,452 Argentina 2016 4 3,566
Japan 2013 50 3,456 Peru 2016 4 3,566
Norway 2013 50 3,456 Portugal 2016 4 3,566
Table 1(continued)
Country Year Week Weeks since Uganda Country Year Week Weeks since Uganda
Italy 2014 1 3,459 Austria 2016 4 3,566
New Caledonia 2014 1 3,459 Costa Rica 2016 4 3,566
Cook Islands 2014 9 3,467 Switzerland 2016 4 3,566
Solomon Islands 2014 12 3,470 Dominican Republic 2016 4 3,566
Zambia 2014 26 3,484 Jamaica 2016 4 3,566
Belgium 2014 38 3,496 Denmark 2016 4 3,566
Brazil 2015 12 3,522 Virgin Islands 2016 4 3,566
Nicaragua 2016 4 3,566
Tonga 2016 4 3,566
Table 2 Predictive performance of risk models of importation and local transmission.
ID Predicted risk (variables) AUCa(95% CIb) Cut-off (%) Sensitivity (95% CIb) Specificity (95% CIb)
NA Importation 0.84 (0.69,1.00) 20.6 77.5 (64.6, 90.4) 85.9 (80.3, 91.5)
1 Local transmission (Aedes) 0.80 (0.55, 1.00) 16.2 64.3 (46.5, 82.0) 85.1 (79.6, 90.6)
2 Local transmission (Chikungunya) 0.89 (0.62, 1.00) 18.6 71.4 (54.7, 88.2) 93.2 (89.3, 97.1)
3 Local transmission (Dengue) 0.84 (0.54, 1.00) 17.4 67.9 (50.6, 85.2) 91.9 (87.7, 96.1)
4 Local transmission (Aedes& Chikungunya) 0.89 (0.61, 1.00) 14.7 85.7 (72.8, 98.7) 80.1 (74.0, 86.3)
5 Local transmission (Aedes& Dengue) 0.86 (0.55, 1.00) 13.7 82.1 (68.0, 96.3) 74.5 (67.8, 81.3)
6 Local transmission (Chikungunya & Dengue) 0.90 (0.60, 1.00) 9.71 96.4 (89.6, 100.0) 67.7 (60.5, 74.9)
7 Local transmission (Aedes& Chikungunya & Dengue) 0.76 (0.38, 1.00) 51.2 89.3 (77.8, 100.0) 70.8 (63.8, 77.8)
Notes.
aAUC, area under the curve. The confidence intervals were calculated using Mann–Whitney method (Gengsheng & Hotilovac, 2008). bCI, confidence interval.
first identified ZIKV case in 1947, Uganda (Dick, 1952), but the country was not specified as the origin, because a long time has passed since the emergence and the path of global spread must not have followed a static network. Note that 39 countries which had already imported ZIKV prior to importation event in Brazil were excluded from the analysis.
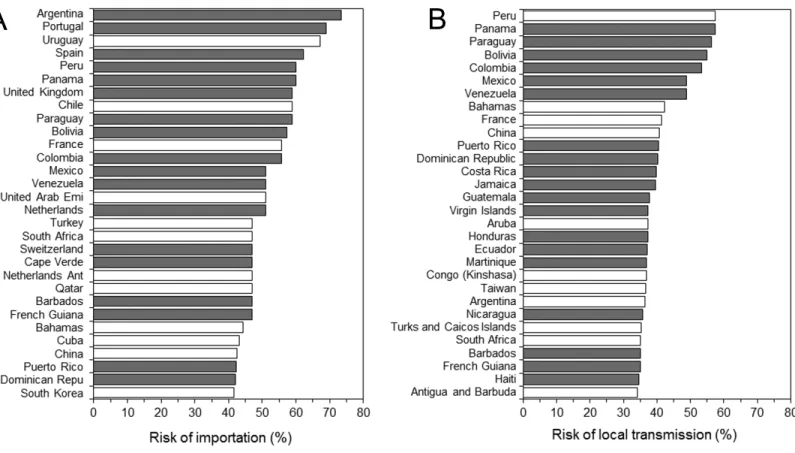
Using Brazil, 2015 as the origin (Figs. 1Aand1C), the model appeared to crudely capture the risk of importation (AUC=0.84 (95% CI [0.69–1.00])). Maximum likelihood estimate of the constant parameterk was 0.044 (95% CI [0.031–0.059]). Sensitivity and specificity were estimated at 77.5% (95% CI [64.6–90.4]) and 85.9% (95% CI [80.3–91.5]), respectively.Figure 2shows the global distribution of the risk of importation. High risks of importation are identified in South America and the western part of European countries. Among the top 30 countries predicted at high risk of ZIKV importation in the end of 2016 (Fig. 3), 18 countries (60%) had already imported ZIKV before week 46.
Figure 1 Predicted risks of ZIKV infection.(A–B) Distribution of estimated risks of importation and local transmission by country. The effective distance was used for (A), while the presence of dengue and chikungunya viruses was additionally considered for (B). (C–D) Receiver operator characteristic curves of predicted risks of importation and local transmission. (C) shows the evaluation results of the risk of im-portation that rested on the effective distance from Brazil, while (D) shows the risk of local transmission additionally accounted for dengue and chikungunya virus epidemic data.
Table 3 Estimated parameters for describing the local transmission risk of Zika virus infection.
Estimated values (95% CI)
Adjusted odds ratio (95% CI)
Intercept 2.06 (−4.23,−0.51) NA
Chikungunya virus 3.13 (1.19, 5.47) 22.90 (3.30, 238.34)
Dengue virus 2.04 (−0.02, 4.30) 7.68 (0.98, 73.64)
Notes.
NA, not applicable. Results from the best model that included Chikungunya and Dengue as explanatory variables are shown. Dependent nominal variable=local transmission. CI, confidence interval.
Table 3shows parameter estimates of the best fitted model. Compared with the absence of Chikungunya virus, the risk of local transmission in the presence of this virus was shown to be indicative of 22.9 times (95% CI [3.3–238.3]) higher. The presence of dengue was not statistically significant, but the adjusted odds ratio was estimated to be 7.7 (95% CI [1.0–73.6]).Table 4shows correlations between two dichotomous variables as measured by Cohen’s kappa. No particular correlation that could lead to multi-collinearity (e.g., kappa > 0.60) was identified.
Figure 3 Countries at high risk of ZIKV infection.(A–B) List of top 30 countries with the estimated highest risks. (A) shows the risk of importa-tion, while (B) shows the risk of local transmission. The risks shown on horizontal axes represent our estimates by the end of 2016 (week 92). Bars filled with grey represent countries that have already experienced importation of ZIKV infected case(s) by 31 January 2016 (week 46).
Table 4 Agreement statistic kappa between two dichotomous variables.
Combination of variables Cohen’s kappa, an agreement
statistic (95% CIa)
Aedesand Chikungunya 0.442 (0.327, 0.556) Aedesand Dengue 0.366 (0.235, 0.496)
Chikungunya and Dengue 0.523 (0.405, 0.642)
Notes.
aCI, confidence intervals.
tropical and subtropical areas.Figure 3Bshow the top 30 countries with high risk of local transmission by week 92, using Brazil as the origin of spread. Among the total, 19 countries (63.3%) were predicted to have already allowed local transmission before week 46.
DISCUSSION
countries has motivated us to explore the risks of importation and local transmission fuelled by travellers. Our model is not as sophisticated as mapping precise risk of transmission using seasonal population dynamics of Aedes species and temperature/climatological data (Bogoch et al., 2016;Nah et al., in press), but the findings at country levels from our study are broadly consistent with what has been briefly described at finer scales (Bogoch et al., 2016). Without using finer scale spatial data (e.g., ecological data on Geographic Information Systems), our approach has crudely and clearly distinguished the risk of local transmission from importation risk at country levels using a more tractable approach. We have shown that the predicted risk of local transmission was frequently seen in tropical and subtropical countries with DENV or CHIKV epidemic experience, while the risk of importation was more scattered around the world. The diagnostic performance of risk model for local transmission was well supported by AUC value of 0.90.
Finally, we estimated the importation risk of ZIKV in a country as a risk of importing ZIKV from Brazil to the country. Therefore, our model cannot capture the risk of importing ZIKV from other endemic area such as South Pacific.
Despite a clear need to improve predictions in the future, the present study successfully devised a simple global risk prediction of importation and local transmission. Countries with DENV and CHIKV epidemic experience are likely to be at particular high risk, and such countries should be prepared for vector control measures such as avoiding daytime biting and the use of mosquito repellent. To further improve model predictions, it is essential to have laboratory capacity built up in every single country at risk of local transmission.
CONCLUSIONS
Risks of importation and local transmission of Zika virus infection were estimated, analyzing epidemiological, ecological and mobility data. Whereas the risk of importation was well explained by the airline transportation network data, the risk of local transmission appeared to be best captured by additionally accounting for the presence of an epidemic of dengue and chikungunya viruses.
ADDITIONAL INFORMATION AND DECLARATIONS
Funding
HN received funding support from the Japanese Society for the Promotion of Science (JSPS) KAKENHI Grant Numbers 26670308 and 26700028, Japan Agency for Medical Research and Development, the Japan Science and Technology Agency (JST) CREST program and RISTEX program for Science of Science, Technology and Innovation Policy. KM received funding support from the Japanese Society for the Promotion of Science (JSPS) KAKENHI Grant Number 15K20936. The funders had no role in study design, data collection and analysis, decision to publish, or preparation of the manuscript.
Grant Disclosures
The following grant information was disclosed by the authors: Japanese Society for the Promotion of Science: 26670308, 26700028. Japan Agency for Medical Research and Development.
Japan Science and Technology Agency. CREST program.
RISTEX program for Science of Science, Technology and Innovation Policy. Japanese Society for the Promotion of Science: 15K20936.
Competing Interests
The authors declare there are no competing interests.
Author Contributions
• Kenji Mizumoto analyzed the data, contributed reagents/materials/analysis tools, wrote the paper, prepared figures and/or tables.
• Yuichiro Miyamatsu performed the experiments, analyzed the data, contributed reagents/materials/analysis tools, wrote the paper, prepared figures and/or tables.
• Yohei Yasuda and Ryo Kinoshita analyzed the data, wrote the paper, prepared figures and/or tables.
• Hiroshi Nishiura conceived and designed the experiments, performed the experiments, analyzed the data, wrote the paper, reviewed drafts of the paper.
Data Availability
The following information was supplied regarding data availability: The raw data were supplied asSupplemental Information.
Supplemental Information
Supplemental information for this article can be found online athttp://dx.doi.org/10.7717/ peerj.1904#supplemental-information.
REFERENCES
Adelman ZN, Tu Z. 2016.Control of mosquito-borne infectious diseases: sex and gene drive.Trends in Parasitology32(3):219–229DOI 10.1016/j.pt.2015.12.003.
Anonymous. 2016.Controlling dengue outbreaks. Scitable.Available athttp:// www. nature.com/ scitable/ topicpage/ controlling-dengue-outbreaks-22403714(accessed 15 March 2016).
Babaniyi OA, Mwaba P, Songolo P, Mazaba-Liwewe ML, MweeneNdumba I,
Masaninga F. 2015.Seroprevalence of Zika virus infection specific IgG in Western and North-Western Provinces of Zambia.International Journal of Public Health and Epidemiology 4(1):110–114.
Benelli G. 2016.Plant-mediated biosynthesis of nanoparticles as an emerging tool against mosquitoes of medical and veterinary importance: a review.Parasitology Research 115(1):23–34DOI 10.1007/s00436-015-4800-9.
Benelli G, Mehlhorn H. 2016.Declining malaria, rising of dengue and Zika virus: insights for mosquito vector control.Parasitology ResearchEpub ahead of print Mar 02 2016DOI 10.1007/s00436-016-4971-z.
Bogoch II, Brady OJ, Kraemer MU, German M, Creatore MI, Kulkarni MA, Brownstein JS, Mekaru SR, Hay SI, Groot E, Watts A, Khan K. 2016.Anticipating the interna-tional spread of Zika virus from Brazil.The Lancet 387(10016):335–336
DOI 10.1016/S0140-6736(16)00080-5.
Brasil P, Pereira Jr JP, Raja Gabaglia C, Damasceno L, Wakimoto M, Ribeiro Nogueira RM, Carvalho de Sequeira P, Machado Siqueira A, Abreu de Carvalho LM, Cotrim da Cunha D, Calvet GA, Neves ES, Moreira ME, Rodrigues Baião AE, Nassar de Carvalho PR, Janzen C, Valderramos SG, Cherry JD, Bispo de Filippis AM, Nielsen-Saines K. 2016.Zika virus infection in pregnant women in Rio de Janeiro - preliminary Report.New England Journal of MedicineIn Press
Brockmann D, Helbing D. 2013.The hidden geometry of complex, network-driven contagion phenomena.Science342(6164):1337–1342DOI 10.1126/science.1245200. Campos GS, Bandeira AC, Sardi SI. 2015.Zika virus outbreak, Bahia, Brazil.Emerging
Infectious Diseases21(10):1885–1886DOI 10.3201/eid2110.150847.
Centers for Disease Control and Prevention (CDC), USA. 2016a.Chikungunya virus, Geographic Distribution.Available athttp:// www.cdc.gov/ chikungunya/ geo/
(accessed 7 March 2016).
Centers for Disease Control and Prevention (CDC), USA. 2016b.Dengue homepage. Available athttp:// www.cdc.gov/ dengue/ epidemiology/(accessed 7 March 2016). Contentshare. 2016.Openflight database. Singapore: Contentshare.Available athttp:
// openflights.org (accessed 28 January 2016).
Dick GW. 1952.Zika virus. II. Pathogenicity and physical properties.Transactions of the Royal Society of Tropical Medicine and Hygiene46:521–534
DOI 10.1016/0035-9203(52)90043-6.
European Centre for Disease Prevention and Control (ECDC). 2016.Countries and territories with local Zika transmission.Available athttp:// ecdc.europa.eu/ en/ healthtopics/ zika_virus_infection/ zika-outbreak/ Pages/ Zika-countries-with-transmission.aspx (accessed 7 March 2016).
Gatherer D, Kohl A. 2016.Zika virus: a previously slow pandemic spreads rapidly through the Americas.Journal of General Virology97(2):269–273
DOI 10.1099/jgv.0.000381.
Gengsheng Q, Hotilovac L. 2008.Comparison of non-parametric confidence intervals for the area under the ROC curve of a continuous-scale diagnostic test.Statistical Methods in Medical Research17:207–221.
Global Flights Network. 2016.USA: General Electric Company and Seed Media Group. Available athttp:// www.visualizing.org/ datasets/ global-flights-network(accessed 28 January 2016).
Greiner M, Pfeiffer D, Smith RD. 2000.Principles and practical application of the receiver-operating characteristic analysis for diagnostic tests.Preventive Veterinary Medicine45:23–41DOI 10.1016/S0167-5877(00)00115-X.
Ioos S, Mallet HP, Leparc Goffart I, Gauthier V, Cardoso T, Herida M. 2014.Current Zika virus epidemiology and recent epidemics.Médecine et Maladies Infectieuses 44(7):302–307DOI 10.1016/j.medmal.2014.04.008.
Korhonen EM, Huhtamo E, Smura T, Kallio-Kokko H, Raassina M, Vapalahti O. 2016.Zika virus infection in a traveller returning from the Maldives, June 2015. Eurosruveillance21(2):Article 30107DOI 10.2807/1560-7917.ES.2016.21.2.30107. Kraemer MU, Sinka ME, Duda KA, Mylne A, Shearer FM, Brady OJ, Messina JP, Barker
CM, Moore CG, Carvalho RG, Coelho GE, Van Bortel W, Hendrickx G, Schaffner F, Wint GR, Elyazar IR, Teng HJ, Hay SI. 2015.The global compendium ofAedes aegyptiandAe. albopictusoccurrence.Scientific Data2: 150035.
of Zika fever imported from French Polynesia to Japan, December 2013 to January 2014.Eurosurveillance19(4): 20683.
Kwong JC, Druce JD, Leder K. 2013.Zika virus infection acquired during brief travel to Indonesia.American Journal of Tropical Medicine and Hygiene89(3):516–517 DOI 10.4269/ajtmh.13-0029.
Mlakar J, Korva M, Tul N, Popović M, Poljšak-Prijatelj M, Mraz J, Kolenc M, Resman Rus K, Vesnaver Vipotnik T, Fabjan Vodušek V, Vizjak A, Pižem J, Petrovec M, Avšič Županc T. 2016.Zika virus associated with microcephaly.New England Journal of MedicineIn PressDOI 10.1056/NEJMoa1600651.
Musso D, Cao-Lormeau VM, Gubler DJ. 2015.Zika virus: following the path of dengue and chikungunya?Lancet 386(9990):243–244DOI 10.1016/S0140-6736(15)61273-9. Nah K, Otsuki S, Chowell G, Nishiura H. 2016.Predicting the international spread of
Middle East respiratory syndrome (MERS).BMC Infectious DiseasesIn Press.
Nishiura H, Kinoshita R, Mizumoto K, Yasuda Y, Nah K. 2016a.Transmission potential of Zika virus infection in the South Pacific.International Journal of Infectious Diseases 45:95–97DOI 10.1016/j.ijid.2016.02.017.
Nishiura H, Mizumoto K, Rock KS, Yasuda Y, Kinoshita R, Miyamatsu Y. 2016b.A the-oretical estimate of the risk of microcephaly during pregnancy with Zika virus infec-tion.EpidemicsEpub ahead of print Mar 18 2016DOI 10.1016/j.epidem.2016.03.001. Petersen E, Wilson ME, Touch S, McCloskey B, Mwaba P, Bates M, Dar O, Mattes F,
Kidd M, Ippolito G, Azhar EI, Zumla A. 2016.Rapid spread of Zika virus in the americas-implications for public health preparedness for mass gatherings at the 2016 Brazil Olympic Games.International Journal of Infectious Diseases44:11–15 DOI 10.1016/j.ijid.2016.02.001.
Staples JE, Dziuban EJ, Fischer M, Cragan JD, Rasmussen SA, Cannon MJ, Frey MT, Renquist CM, Lanciotti RS, Muñoz JL, Powers AM, Honein MA, Moore CA. 2016. Interim guidelines for the evaluation and testing of infants with possible congenital Zika virus infection—United States, 2016.Morbidity and Mortality Weekly Report 65(3):63–67DOI 10.15585/mmwr.mm6503e3.
Tappe D, Rissland J, Gabriel M, Emmerich P, Gunther S, Held G, Smola S, Schmidt-Chanasit J. 2014.First case of laboratory-confirmed Zika virus infection imported into Europe, November 2013.Eurosurveillance19(4): 20685.
The Walter Reed Biosystematics Unit, USA. 2016.Aedes africana.Available athttp:// www.wrbu.org/ SpeciesPages_non-ANO/ non-ANO_A-hab/ AEafr_hab.html(accessed 7 March 2016).