Submitted 26 June 2015 Accepted 21 July 2015 Published11 August 2015
Corresponding author
John G. Blake, [email protected]
Academic editor Stuart Pimm
Additional Information and Declarations can be found on page 16
DOI10.7717/peerj.1177
Copyright 2015 Blake and Loiselle
Distributed under
Creative Commons CC-BY 4.0
OPEN ACCESS
Enigmatic declines in bird numbers in
lowland forest of eastern Ecuador may be
a consequence of climate change
John G. Blake1and Bette A. Loiselle2
1Department of Wildlife Ecology and Conservation, University of Florida, Gainesville, Florida,
USA
2Department of Wildlife Ecology and Conservation and Center for Latin American Studies,
University of Florida, Gainesville, Florida, USA
ABSTRACT
Bird populations have declined in many parts of the world but most of those declines can be attributed to effects of human activities (e.g., habitat fragmentation); declines in areas unaffected by human activities are not common. We have been sampling bird populations at an undisturbed site in lowland forest of eastern Ecuador annually since 2001 using a combination of mist nets and direct observations on two 100-ha plots. Bird numbers fluctuated on both plots during the first 8 years but did not show a consistent pattern of change. Since about 2008, numbers of birds on both plots have declined; capture rates in 2014 were∼40% less than at the start of the study and observation rates were∼50% less. Both understory and canopy species declined in abundance. Overall, insectivores showed the most pronounced declines but declines varied among trophic groups. The period from 2008 onward also was a period of stronger La Ni˜na events which, at this study site, are associated with increased rainfall. The mechanism for the declines is not known but likely reflects a combination of reduced reproductive success coupled with reduced survival associated with changing climate.
Subjects Biodiversity, Conservation Biology, Ecology
Keywords Birds, Conservation, Long-term, Population declines, Tropical, Birds, Ecuador, Neotropics, Climate change
INTRODUCTION
Bird populations can vary in abundance over time and space because of variation in rainfall, changes in resources, alteration of habitat, and other factors (Blake et al., 1994;
Ballard et al., 2003;Jones, Doran & Holmes, 2003;Stouffer et al., 2011;Shaw et al., 2013). Much attention has focused on long-term declines in migrant populations both on breeding and wintering grounds (e.g.,Ballard et al., 2003;Faaborg et al., 2013). Much less attention has been given to long-term changes in populations of tropical species (Latta et al., 2011); few studies have followed populations on an annual basis using consistent methods, although the need for such studies has been recognized (Harris et al., 2011).
is some evidence for stability in, for example, territories and flock structure (Martinez & Gomez, 2013), other studies have demonstrated considerable variation in population sizes, community composition, and life-history traits over different spatial and temporal scales (Loiselle & Blake, 1992;Brawn et al., 2011;Latta et al., 2011). Further, rainfall in most tropical regions varies seasonally and over longer time scales (Condit et al., 2004;Dejean et al., 2011) so tropical environments are not necessarily stable. Given that even small changes in humidity may affect distribution patterns on a local scale (Karr & Freemark, 1983), it would not be surprising for distribution and abundance patterns to be affected by longer-term or larger spatial scale variation in rainfall or other climatic factors.
Most studies on declining populations of tropical bird species have focused on effects of fragmentation, and other types of habitat alteration (Robinson, 1999;Robinson, 2001;Stouffer et al., 2011;Shaw et al., 2013). Yet, large-scale climatic cycles, such as El Ni˜no-Southern Oscillation (ENSO) can affect bird populations over large regions, with effects varying geographically (Ballard et al., 2003;LaManna et al., 2012). Changes in rainfall patterns may affect resource abundance (Sillett, Holmes & Sherry, 2000;Jones, Doran & Holmes, 2003) with noticeable effects on survival, fecundity, and other life-history traits (Sillett, Holmes & Sherry, 2000;Nott et al., 2002;Mazzerolle et al., 2005;LaManna et al., 2012), although not all species are affected (Brawn et al., 2011;Styrsky & Brawn, 2011). Studies on effects of climate change on tropical birds often have focused on changes in distributions along elevational gradients (Forero-Medina et al., 2011;Harris et al., 2011;
Anderson et al., 2013;Jankowski et al., 2013;Freeman & Freeman, 2014). Less attention has been given to the possibility that climate cycles might affect bird populations in lowland forests (e.g.,Styrsky & Brawn, 2011;Wolfe, Ralph & Elizondo, 2015). Similarly, although many studies have examined changes in bird populations in areas directly affected by human activities (e.g., fragmentation and loss of forest; see above), few long-term studies have been conducted in tropical lowland forests that have not been affected to a noticeable extent by human activities (Martinez & Gomez, 2013). Yet, even “undisturbed” forests may be affected by large-scale climatic cycles such as ENSO and, thus, may still be affected indirectly by human activities if those activities affect climate cycles. Detecting any such effects requires long-term studies that examine bird populations on an annual basis with consistent sampling protocols. Without such studies, much variation in populations may either not be recorded or, if studies are too short, may provide incomplete pictures of the extent of variation given that populations may change in response to short-term changes in environmental conditions or to longer (decadal) patterns in climate.
Here, we use data gathered over a 14-year period to examine changes in bird populations in an apparently undisturbed forest of lowland eastern Ecuador. In particular, we focus on substantial declines in overall bird numbers that have occurred over the last 5 to 6 years and discuss possible causes for those declines.
METHODS
Study site
Research was conducted at Tiputini Biodiversity Station (TBS), Orellana Province, Ecuador (ca0◦37′S, 76◦10′W, 190–270 m above sea level). TBS is located adjacent to
Yasun´ı National Park on a tract of largely undisturbed (by human activities) lowland rain forest within Yasun´ı Biosphere Reserve, one of the most diverse regions of the world (Bass et al., 2010). The biosphere reserve encompasses Yasun´ı National Park (∼982,000 ha), the adjacent Waorani Ethnic Reserve (∼800,000 ha), and a 10 km buffer zone. TBS is located approximately 22 km east of an offshoot of the Maxus Road,∼25 km east of the nearest Waorani settlement,∼12 km from an oil access road to the northwest,∼20 km south of the Napo River, and approximately 17–19 km from the nearest settlements along the Napo River. Thus, the station is surrounded by extensive areas of intact forest. The station and nearby areas are dominated byterra firmeforest;v´arzeaforest, palm swamps, and various successional habitats also are present. Mean annual precipitation at Yasun´ı Research Station, approximately 28 km west of TBS, is about 3,100 mm.
Twoca100-ha plots (ca1 km×1 km each) were established interra firmeforest during 2001. Both plots are gridded (100×200-m grid lines) and marked with 1.5-m PVC tubes. The Harpia plot ranges from∼201 to 233 m elevation and is characterized by more dissected upland forest. The Puma plot is flatter overall although elevation range is similar, from∼209 to 235 m. Both areas experience partial inundation when small streams back up as the Tiputini River rises; Puma has more areas that fill with persistent standing water during the rainy season. Dominant vegetation on both plots is tall, evergreen forest.
Bird sampling
Mist nets
Birds were captured with mist nets (12×2.6 m, 36-mm mesh) set at ground level. Nets were arranged in a series of eight sets of 12 nets on each plot (96 sites per plot). Each set of 12 nets formed a rectangle (100×200 m) with nets set∼50 m apart; maximum distance between nets on a plot was approximately 920 m. Each set of nets was run for one day (∼0600 to 1200 h) in January (peak of breeding for many species) and one day in March (late breeding season for many species), starting in March 2001 and ending in March 2014. Captured birds were identified and most (except some hummingbirds) were banded with aluminum leg bands. SeeBlake & Loiselle (2009)for more details on netting protocols.
Direct observations
1–1.4 km of transects were covered during a morning; starting positions were distributed throughout the plots to ensure, as much as possible, that all parts of the plots were covered early in the morning when vocal activity is greatest. Each plot took∼12–13 days to cover; transects were not walked more than once during a given sample. Total effort expended (i.e., numbers of hours and numbers of kilometers) was equivalent between plots and among samples, except in some later samples when heavy rains interrupted samples. Counts started well before light, when the first diurnal birds were beginning to sing and when many nocturnal species were still vocalizing. Vocal activity typically was high until
∼2 h after sunrise, when it often declined rapidly; thus, counts were confined to the first few hours of the morning. Periods of rain occasionally interrupted or ended counts early.
Not all species or groups of species were equally well sampled. For example, some canopy tanagers (Tangaraspp.), small flycatchers and hummingbirds in the canopy likely were often overlooked, as were other canopy birds that do not vocalize much (e.g., some puffbirds). In contrast, highly vocal species with distinctive songs likely were not missed and may be relatively over-represented. Yet, because counts were conducted in the same way on both plots, between-plot comparisons and among-year comparisons should not be affected. Hawks, psittacids, and other species flying above the canopy were noted but not included in most analyses if they were not observed using the plot. Swifts and swallows were seen flying over the forest but numbers were not estimated and are not included in results. SeeBlake (2007)for more details on observation methods. Taxonomy follows
Remsen et al. (2015).
Analyses
Approval for this research was obtained from Non-Regulatory Animal Research Committee (018-10WEC) at University Florida and, previously, from IACUC, University of Missouri. Work at Tiputini Biodiversity Station was conducted in accordance with research permit number 13-IC-FAU-DFN (and subsequent renewals), Ministerio del Ambiente, Distrito Forestal Napo, Tena, Ecuador.
RESULTS
Overall summary
We accumulated 7,302 captures (2,780 recaptures) of 155 species in 14,862 mnh on Harpia and 7,598 captures (2,938 recaptures) of 154 species in 14,263 mnh on Puma; 178 species were captured in total. We did not use mist nets to sample birds on either plot during March 2013 or on Puma during 2014 because heavy rains reduced our opportunities for netting. We accumulated 20,391 records of 276 species on Harpia and 17,427 records of 275 species on Puma; 306 species were recorded on both plots combined.
All species combined
Annual capture rates (birds 100-mnh−1)were highly correlated between plots (Table 1)
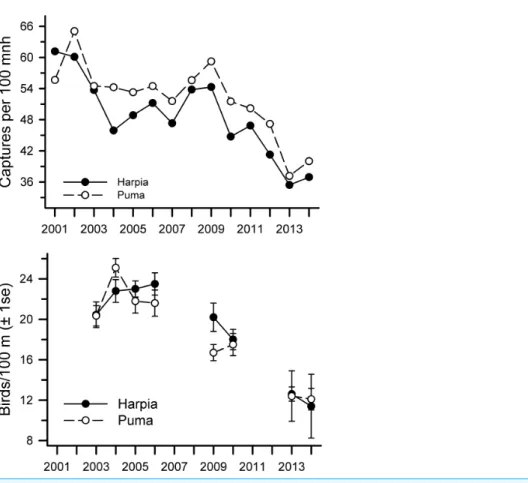
but were somewhat higher overall on Puma (Harpia: mean=48.7±2.1 SE, CV=15.8; Puma: 52.1±1.9, CV=13.7; pairedt-test,t=3.91, df=13,P<0.002). Although overall capture rates declined from 2001 to 2014 on both plots (Table 1), declines were most pronounced from 2009 to 2014 (r= −0.47 and−0.23 from 2001 to 2009 on Harpia and Puma respectively;r= −0.92 and−0.94 from 2009 to 2014 on Harpia and Puma, respectively) (Fig. 1A). Capture rates on Puma in 2009, for example, were as high as they were in 2001.
Overall observation rates also were correlated between plots (r=0.93,P<0.001) but showed no difference between plots (pairedt-test,t=0.9, df=7,P=0.40;Fig. 1B). Observation rates were correlated with capture rates on each plot (Harpia:r=0.87, P<0.005; Puma:r=0.74,P<0.05). Observation rates did not vary significantly from 2003 to 2006 (Fig. 1B) but were much lower in later years (correlations across all years combined Harpia:r= −0.90,P<0.005; Puma:r= −0.93,P<0.001); rates in 2014 were approximately half those observed during the first years of the study.
Foraging guilds
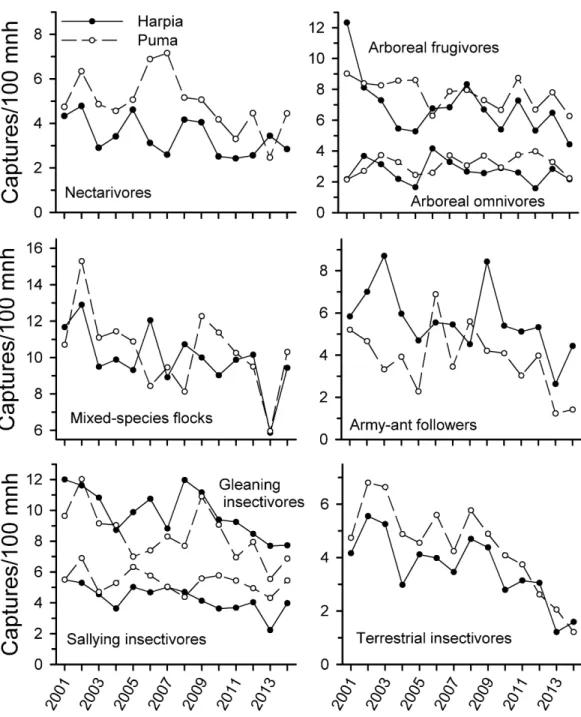
Capture rates of all foraging guilds examined (except arboreal omnivores on Puma) declined from 2001 to 2014 (Fig. 2andTable 1) but the extent of the decline varied among guilds and over time. Arboreal and terrestrial insectivores showed the steepest declines, particularly from 2009 to 2014; declines were not significant from 2001 to 2009 but were subsequently. Army-ant followers also showed steeper declines after 2009, with substantial fluctuations during the first years of the study. Mixed-species flocks also were quite variable but capture rates were substantially less in 2013 than in previous years; capture rates increased somewhat in 2014.
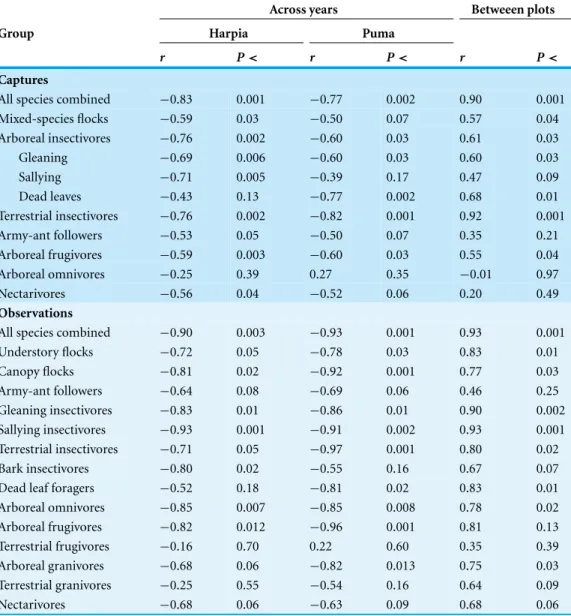
Table 1 Correlations between bird numbers and years and between plots.Correlations in capture and observation rates of guilds across years and between plots. Guilds followTerborgh et al. (1990).P-values are given without correction for multiple comparisons.
Across years Betweeen plots
Group Harpia Puma
r P< r P< r P<
Captures
All species combined −0.83 0.001 −0.77 0.002 0.90 0.001 Mixed-species flocks −0.59 0.03 −0.50 0.07 0.57 0.04 Arboreal insectivores −0.76 0.002 −0.60 0.03 0.61 0.03
Gleaning −0.69 0.006 −0.60 0.03 0.60 0.03
Sallying −0.71 0.005 −0.39 0.17 0.47 0.09
Dead leaves −0.43 0.13 −0.77 0.002 0.68 0.01
Terrestrial insectivores −0.76 0.002 −0.82 0.001 0.92 0.001
Army-ant followers −0.53 0.05 −0.50 0.07 0.35 0.21
Arboreal frugivores −0.59 0.003 −0.60 0.03 0.55 0.04
Arboreal omnivores −0.25 0.39 0.27 0.35 −0.01 0.97
Nectarivores −0.56 0.04 −0.52 0.06 0.20 0.49
Observations
All species combined −0.90 0.003 −0.93 0.001 0.93 0.001
Understory flocks −0.72 0.05 −0.78 0.03 0.83 0.01
Canopy flocks −0.81 0.02 −0.92 0.001 0.77 0.03
Army-ant followers −0.64 0.08 −0.69 0.06 0.46 0.25
Gleaning insectivores −0.83 0.01 −0.86 0.01 0.90 0.002 Sallying insectivores −0.93 0.001 −0.91 0.002 0.93 0.001 Terrestrial insectivores −0.71 0.05 −0.97 0.001 0.80 0.02
Bark insectivores −0.80 0.02 −0.55 0.16 0.67 0.07
Dead leaf foragers −0.52 0.18 −0.81 0.02 0.83 0.01
Arboreal omnivores −0.85 0.007 −0.85 0.008 0.78 0.02 Arboreal frugivores −0.82 0.012 −0.96 0.001 0.81 0.13 Terrestrial frugivores −0.16 0.70 0.22 0.60 0.35 0.39
Arboreal granivores −0.68 0.06 −0.82 0.013 0.75 0.03
Terrestrial granivores −0.25 0.55 −0.54 0.16 0.64 0.09
Nectarivores −0.68 0.06 −0.63 0.09 0.68 0.06
nectarivores declined over time but correlations were much weaker than for insectivores. Correlations in capture rates between plots were strongest for terrestrial insectivores and somewhat less so for arboreal insectivores and mixed-species flocks; other guilds showed very different patterns between plots.
Figure 1 Capture rates and observations of birds at Tiputini Biodiversity Station.Capture rates (A) and observations (B) of birds on two 100-ha plots (Harpia, Puma) at Tiputini Biodiversity Station, Ecuador, from 2001 to 2014.
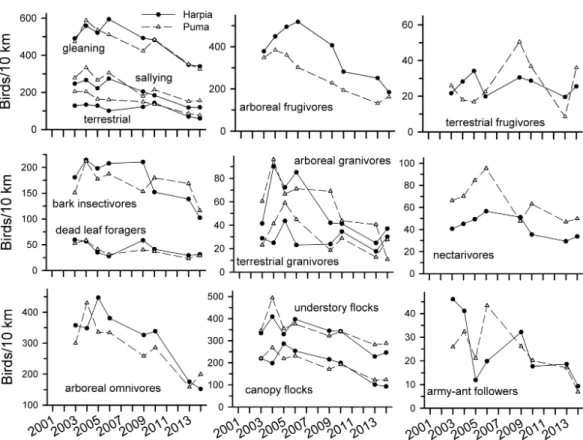
nonetheless lower in later years. Patterns of observations were similar between the two plots for most guilds, with the exceptions of terrestrial frugivores, army-ant followers, and to a lesser extent, terrestrial granivores, bark insectivores, and nectarivores.
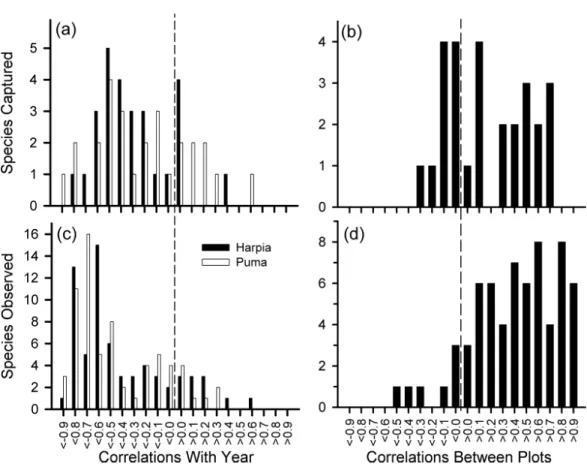
Individual species
We examined variation in 28 species represented by at least 140 captures. Although capture rates of most species declined over time (Fig. 4A), capture rates also varied from one year to the next, often substantially, and often showed different patterns between plots (Fig. 4B, see alsoFig. S1andTable S1). Declines in capture rates were particularly pronounced after about 2009 for many species (Fig. S1). Species that showed particularly pronounced declines on both plots included a frugivore (Lepidothrix coronata), terrestrial insectivores
(Sclerurus caudacutus, Formicariusspp.), and understory insectivores (Willisornis
poecilinota,Myrmoborus myotherinus); for these species, capture rates were correlated
Figure 2 Capture rates of trophic guilds at Tiputini Biodiversity Station, Ecuador.Capture rates for different trophic guilds (fromTerborgh et al., 1990) on two 100-ha plots (Harpia, Puma) at Tiputini Biodiversity Station, Ecuador, from 2001 to 2014.
Figure 3 Observation rates for trophic guilds at Tiputini Biodiversity Station.Observation rates for different trophic guilds (fromTerborgh et al., 1990) on two 100-ha plots (Harpia, Puma) at Tiputini Biodiversity Station, Ecuador, from 2001 to 2014.
(e.g.,Campylorhynchus turdinus), and less vocal or conspicuous species (e.g.,Lepidothrix coronata,Euphoniaspp.) (Fig. S2).
Southern oscillation index
Annual SOI values were lowest from 2002 to 2004 and highest from 2008 to 2011 (Fig. 5). Values for October through March, which encompasses the main breeding period of many species, followed a generally similar trend. Monthly values (Fig. S3) also demonstrated the tendency for SOI values to be greater in the later years of this study. We have both observation data and netting data for eight years; those rates were negatively correlated with SOI values for Oct–March, with a 2-yr time lag (r= −0.62,−0.71,−0.71, and−0.60 for captures on Harpia, captures on Puma, observations on Harpia, and observations on Puma, respectively). Correlations with annual SOI values, with a 2-yr time lag, were weaker but still negative (−0.50,−0.50,−0.64, and−0.67, respectively). Capture rates were not correlated with SOI values when all 14 years were included.
DISCUSSION
Figure 4 Frequency distribution of correlation coefficients.Number of species with different correla-tion coefficients (Pearson’s) between year and number of captures for 28 species (A) and numbers of observations for 68 species (C); distribution of correlation coefficients between plots based on captures (B) and observations (D).
to lead to constancy of resources and, hence, more stable populations, at least in areas unaffected by significant human activities. In contrast, in areas that have been substantially altered by humans (e.g., through deforestation, fragmentation, hunting), populations of many species have suffered significant declines in abundance (Robinson, 1999;Robinson, 2001;Sigel, Sherry & Young, 2006;Stouffer et al., 2011). A recent report assessing the state of vertebrate populations worldwide (World Wildlife Fund, 2014), concluded that abundance of vertebrates has declined by about 52% from 1970 to 2010; declines in the Neotropics were more pronounced than elsewhere. Primary causes for these declines were associated with habitat loss, with climate change implicated as the primary cause in 7.1% of species.
Few studies have examined population dynamics of birds in areas of the Neotropics where large expanses of lowland forests remain in relatively intact states (i.e., with little deforestation or fragmentation).Martinez & Gomez (2013)compared flock structure and abundance across an almost 20-year period in French Guiana, in an area largely unaffected by humans; flocks were remarkably stable across this period. Such constancy in abundance and spatial distribution was assumed to reflect relative constancy in resources. In contrast, species richness and capture rates of birds in a montane cloud forest reserve in Ecuador declined significantly over a 12-year period (1994/95 to 2006/07) (Latta et al., 2011). In the latter case, declines were most likely associated with habitat changes that occurred outside the relatively small (2,700 ha) reserve; climate change was a possible factor in declines of some species. Significant, long-term (>20 years) declines (by∼two thirds) in abundance of winter residents (migrants) also were noted in a tract of high-quality tropical dry forest in Puerto Rico (Faaborg et al., 2013). Located within a biosphere reserve, the study area had not experienced recent habitat loss, suggesting that declines were a consequence of events during the breeding season. Survival rates during the winter period remained constant, suggesting that lack of recruitment may have been a factor contributing to the observed declines. Climatic factors (ENSO) also can influence breeding success and populations of Neotropical migrants, in both positive and negative ways (Sillett, Holmes & Sherry, 2000;
Nott et al., 2002;Mazzerolle et al., 2005).
Protected areas often are established with the goal of protecting (or at least with the assumption of protection) species. Yet, as seen in montane forests (Latta et al., 2011) and tropical dry forest (Faaborg et al., 2013), factors extrinsic to reserves may negatively affect populations within such reserves. La Selva Biological Station, in Costa Rica, although con-nected to a relatively large national park (Braulio Carrillo National Park, 44,000 ha), has seen populations of many bird species decline, some to local extirpation, over the past few decades. Such declines likely are associated with changes in habitat and other conditions outside the park and station (Sigel, Sherry & Young, 2006). Global climate change has, in fact, been recognized as an important threat to the continued existence of both species and protected areas (Root et al., 2003;Hannah et al., 2007;World Wildlife Fund, 2014).
that two relatively large plots (100 ha each) have been sampled for 14 years with two distinct but complementary methods: mist net captures and direct observations. The temporal and spatial scales provide an unparalleled perspective on dynamics of bird abundances in an area of relatively undisturbed lowland tropical forest located in the most biologically diverse region of the world (Bass et al., 2010). That bird populations in such an “untouched” area have apparently undergone substantial changes in numbers suggests that factors operating at large spatial scales can have important local effects. Yet, the idea that even large expanses of forest are not affected by human activities is almost certainly not true when considering large-scale climate patterns that may be affected by human activities (e.g., ENSO).
In contrast to the idea that bird populations in undisturbed lowland tropical forests should be relatively stable, at least in contrast to populations in areas that have experienced large-scale human impacts (Robinson, 2001;Stouffer et al., 2011), results of this study demonstrate that substantial changes in abundance across years is clearly possible. During the first years of this study, abundances of many species fluctuated but for most, fluctuations were not consistently up or down. Yet, in the years since 2008–2009, there has been a reasonably consistent decline in overall bird numbers as well as numbers of many individual species and trophic groups. Similarly, anecdotal reports from local guides and other visitors to the station provide support for the conclusion that bird numbers have declined in recent years.
Bird populations in a given site or region might decline as a consequence of habitat changes or loss both within a site or in nearby areas (Sigel, Sherry & Young, 2006;Latta et al., 2011), changes in availability of resources (e.g.,Jones, Doran & Holmes, 2003), introduction or spread of disease (Warner, 1968;Van Riper III et al., 1986), introduction of new predators (Savidge, 1984) or changes in weather or climate (Stiles, 1992;Blake et al., 1994). Clearly, many of these possible factors could interact in various ways (e.g., climate change affecting plant phenology and production of flowers and fruits; weather changes causing fluctuations in insect numbers). Further, it is possible that sampling methods, including observer variation, might lead to the perception of changes in abundance even when numbers had not actually changed.
Methodological considerations
All observations were done by one of us (JGB), so variation among observers is not an issue or possible cause of declines. If, on the other hand, ability to detect birds declined over time (i.e., because of loss of hearing) that might account for some of the observed declines. Yet, we would expect such changes to be most pronounced among species with high frequency songs that often are more difficult to detect as one gets older. In this study, increases in abundance were noted in some species with high frequency songs (e.g.,Platyrinchus coronatus) and such species are still readily detected by JGB both in tropical and temperate forests (J Blake, pers. obs., 2015). Further, many of the species that have shown declines are loud and conspicuous, so a gradual decline in ability to detect such species seems an unlikely explanation. If uncontrolled variables related to environmental conditions or to observer abilities affect detection of species, we might expect that changes in abundance over time would not show a consistent pattern of decline but would, instead, vary in a more random fashion; such variation was not observed.
Habitat effects
Declines are not likely to have occurred in response to habitat changes as there have been no substantial changes either at our study site or in surrounding regions during the course of this study. Tree falls and blowdowns are a normal and typical form of disturbance which might cause some small-scale shifts in spatial distribution of birds or other organisms. Yet, given that home ranges of most bird species in the area are larger than typical gaps, such disturbances would not be expected to cause large, consistent declines in bird populations at the scale of our study plots. Other forms of disturbance in eastern Ecuador are associated with oil exploration and extraction, which have increased in the general region of Yasun´ı (Finer et al., 2008). Such activities can have negative impacts on species as a consequence of road construction, noise, and other disturbances (Canaday, 1997). Yet, there has not been a substantial increase in such activity during the course of this study, at least in the area of our study plots. Similarly, roads may facilitate hunting by indigenous groups (e.g., Waorani) and hunting has caused declines in bird and mammal populations in some areas of Yasun´ı (Su´arez et al., 2009). Although some hunting has occurred in the vicinity of the station (J Blake, pers. obs., 2014), the increase has not been substantial. Further, declines occurred in many species that are not targeted by hunters (e.g.,Lepidothrix,
Formicarius). Thus, we see no evidence that habitat loss or alteration, and associated
human activities, may have caused the observed declines in bird numbers.
Resource abundance
are among those most negatively affected by habitat fragmentation (Powell, Cordeiro & Stratford, 2015). Disappearance from small patches of habitat may be related to reductions in availability of leaf-litter insects, suggesting that such species are sensitive to loss of resources. Understory insectivores often are particularly vulnerable to disturbances (Powell, Cordeiro & Stratford, 2015) and many also declined in abundance in this study. Changes in precipitation can affect understory insectivores in various direct and indirect ways through effects on resource (insect) abundance (Powell, Cordeiro & Stratford, 2015), which might account for some of the observed declines. Declines were less general among most frugivores and nectarivores, suggesting that resources fluctuate in different ways. Lack of sufficient resources might lead to reductions in either nesting attempts or nesting success, with consequences for recruitment. When combined with typical survival rates of 3 to 5 years for many species in the understory (Blake & Loiselle, 2013), lack of recruitment could lead to subsequent declines in overall abundance.
Disease
Blood parasites such asPlasmodium andHaemoproteus(haemosporidia) and other diseases (e.g., West Nile virus) can be harmful to their hosts (Van Riper III et al., 1986;
Merino et al., 2000) and, in some cases, can cause large-scale population declines and even extinction (e.g.,Plasmodium relictumand Hawaiian native avifauna;Warner (1968);Van Riper III et al. (1986). In a previous study based on data collected from our study plots (Svensson-Coelho et al., 2013), overall prevalence of blood parasites among species ranged from a low of 5.6% inPipra filicaudato 91.2% inFormicarius colma. All well-sampled species were infected, suggesting that infection is widespread among species at our site. Further, prevalence varied among years, from an overall prevalence of 14.5% in 2006 to a high of 33% in 2009; the increase in 2009 was widespread across species but was followed by a decline in overall prevalence in 2010. If the increase in infection rates had negative consequences for reproduction or survival, this might account for some of the declines. Although low level, chronic infections are generally considered benign, chronic malaria can, in some cases, have negative consequences for lifespan and reproductive success (Asghar et al., 2015). Several species with particularly high infection rates, such
asAutomolus infuscatus(59%),Formicarius analis(54%), andFormicarius colma(91%)
(Svensson-Coelho et al., 2013), were among those species that showed some of the steepest declines in abundance.Lepidothrix coronata(16.3%) had the highest prevalence among manakins and also showed the greatest decline in abundance among members of that family. Yet, some species with relatively low infection rates, such asPithys alba(6%) and
Willisornis poecilinota(24%), also showed substantial declines in abundance. Increased
levels of infection might make some individuals more susceptible to other factors, such as reduced availability of resources, leading to population declines. At present, we do not have any direct evidence, however, to link disease to declining numbers of any particular species.
Climate
abundance at lower elevations. If temperature increases in lowland forest are sufficient to affect reproduction and survival of many species, then populations could certainly decline, particularly given that there would be little opportunity to move to higher elevations or latitudes (seeColwell et al., 2008). Global temperature has apparently increased at a rate of∼0.2◦C/decade since 1975 (Hansen et al., 2006) with an increase of∼0.25◦C/decade
in lowland tropics (cited inColwell et al., 2008). If correct, then we might expect to see increases of∼0.12 to∼0.15◦C during 5–7 years (i.e., from 2008 to 2014). It is unlikely that
such an increase would cause the rapid population declines seen in this study. Thus, we do not think that warming temperatures have been the cause of the observed changes.
What has changed during the course of this study has been the strength and frequency of La Ni˜na events, as shown by variation in SOI. Particularly pronounced events occurred in the latter part of the study and show some correlation with population declines. Extreme La Ni˜na events, such as that of 2010–2011, can bring excessive rains, which can cause widespread damage from flooding (e.g.,Hoyos et al., 2013; see alsoRestrepo & Kjerfve, 2000) and which might also affect reproductive behavior of birds. Changes in rainfall associated with changes in climate might affect birds directly (through effects on reproductive success;Stiles, 1992) or indirectly through effects on resource abundance, body condition, predation, or susceptibility to disease. Reduction in reproductive success would lead to population declines as adult birds die and are not replaced with new recruits. In lowland tropical wet forests, such as our site, nest failure is already high (Ryder et al., 2008), so further reductions in nesting attempts or success might be expected to have noticeable effects on recruitment. Previous studies have noted changes in reproductive success, survival, and abundance associated with changes in global circulation patterns (e.g.,LaManna et al., 2012;Garc´ıa-P´erez et al., 2014). In our area, stronger La Ni˜na events are associated with increased rainfall during the period of time when many birds typically are nesting, and when our samples (nets and observations) occur. Given that observed declines in abundance of many species coincided with a period with considerably higher SOI values (La Ni˜na events), it is at least plausible that this change in climate patterns could account for observed declines in bird populations. Although the mechanism through which climate change acts is yet unknown, if changes in climate are indeed driving population declines, then as conditions change in the future (if they do), we might expect to see an increase in bird populations over time.
ACKNOWLEDGEMENTS
ADDITIONAL INFORMATION AND DECLARATIONS
Funding
Different parts of this research have been funded by The National Science Foundation (IBN-0235141), National Geographic Society (7113-01), Fulbright US Scholars Program, University of Missouri-St. Louis, University of Florida, and personal sources. The funders had no role in study design, data collection and analysis, decision to publish, or preparation of the manuscript.
Grant Disclosures
The following grant information was disclosed by the authors: The National Science Foundation: IBN-0235141.
National Geographic Society: 7113-01. Fulbright US Scholars Program. University of Missouri-St. Louis. University of Florida.
Personal sources.
Competing Interests
The authors declare there are no competing interests.
Author Contributions
• John G. Blake conceived and designed the experiments, performed the experiments, analyzed the data, wrote the paper, prepared figures and/or tables, reviewed drafts of the paper.
• Bette A. Loiselle conceived and designed the experiments, performed the experiments, wrote the paper, reviewed drafts of the paper.
Animal Ethics
The following information was supplied relating to ethical approvals (i.e., approving body and any reference numbers):
Approval for this research was obtained from Non-Regulatory Animal Research Committee (018-10WEC) at University Florida and, previously, from IACUC, University of Missouri.
Field Study Permissions
The following information was supplied relating to field study approvals (i.e., approving body and any reference numbers):
Supplemental Information
Supplemental information for this article can be found online athttp://dx.doi.org/ 10.7717/peerj.1177#supplemental-information.
REFERENCES
Analytical Software. 2013.Statistix. Version 10.0. Tallahassee: Analytical Software.
Anderson AS, Storlie CJ, Shoo LP, Pearson RG, Williams SE. 2013.Current analogues of future climate indicate the likely response of a sensitive montane tropical avifauna to a warming world.
PLoS ONE8:e69393DOI 10.1371/journal.pone.0069393.
Asghar M, Hasselquist D, Hansson B, Zehtindjiev P, Westerdahl H, Bensch S. 2015.Hidden costs of infection: chronic malaria accelerates telomere degradation and senescence in wild birds.Science347:436–438DOI 10.1126/science.1261121.
Ballard G, Geupel GR, Nur N, Gardali T. 2003.Long-term declines and decadal patterns in population trends of songbirds in western North America, 1979–1999.Condor105:77–755 DOI 10.1650/7131.
Bass MS, Finer M, Jenkins CN, Kreft H, Cisneros-Heredia DF, McCracken SF, Pitman NCA, English PH, Swing K, Villa G, Di Fiore A, Voigt CC, Kunz TH. 2010.Global conservation significance of Ecuador’s Yasun´ı National Park.PLoS ONE5:e8767
DOI 10.1371/journal.pone.0008767.
Blake JG. 2007.Neotropical forest bird communities: a comparison of species richness and composition at local and regional scales.Condor109:237–255
DOI 10.1650/0010-5422(2007)109[237:NFBCAC]2.0.CO;2.
Blake JG, Hanowski JM, Niemi GJ, Collins PT. 1994.Annual variation in bird populations of mixed conifer-northern hardwood forests.Condor96:381–399DOI 10.2307/1369322. Blake JG, Loiselle BA. 2009. Species composition of Neotropical understory bird
communities: local versus regional perspectives based on capture data.Biotropica41:85–94 DOI 10.1111/j.1744-7429.2008.00445.x.
Blake JG, Loiselle BA. 2013. Apparent survival rates of forest birds in eastern Ecuador revisited: improvement in precision but no change in estimates. PLoS ONE8:e81028 DOI 10.1371/journal.pone.0081028.
Brawn JD, Angehr G, Davros N, Robinson WD, Styrsky JN, Tarwater CE. 2011.Sources of variation in the nesting success of understory tropical birds.Journal of Avian Biology42:61–68 DOI 10.1111/j.1600-048X.2010.04897.x.
Canaday C. 1997.Loss of insectivorous birds along a gradient of human impact in Amazonia.
Biological Conservation77:63–77DOI 10.1016/0006-3207(95)00115-8.
Colwell RK, Brehm G, Cardel ´us CL, Gilman AC, Longino JT. 2008.Global warming, elevational range shifts, and lowland biotic attrition in the wet tropics. Science322:258–261
DOI 10.1126/science.1162547.
Condit R, Aguilar S, Hernandez A, Perez R, Lao S, Angehr G, Hubbell SP, Foster RB. 2004. Tropical forest dynamics across a rainfall gradient and the impact of an El Ni˜no dry seasons.
Journal of Tropical Ecology20:51–72DOI 10.1017/S0266467403001081.
Dobzhansky T. 1950.Evolution in the tropics.American Scientist38:208–221.
Faaborg JW, Arendt J, Toms JD, Dugger KM, Cox WA, Mora MC. 2013.Long-term decline of a winter-resident bird community in Puerto Rico.Biodiversity and Conservation22:63–75 DOI 10.1007/s10531-012-0399-7.
Finer M, Jenkins CN, Pimm SL, Keane B, Ross C. 2008.Oil and gas projects in the western Amazon: threats to wilderness, biodiversity, and indigenous people.PLoS ONE3:e2932 DOI 10.1371/journal.pone.0002932.
Forero-Medina G, Terborgh J, Socolar SJ, Pimm SL. 2011.Elevational ranges of birds on a tropical montane gradient lag behind warming temperatures.PLoS ONE6:e28535 DOI 10.1371/journal.pone.0028535.
Freeman BG, Freeman AMC. 2014.Rapid upslope shifts in New Guinean birds illustrate strong distributional responses of tropical montane species to global warming.
Proceedings of the National Academy of Sciences of the United States of America111:4490–4494 DOI 10.1073/pnas.1318190111.
Garc´ıa-P´erez B, Hobson KA, Albrecht G, Cadman MD, Salvadori A. 2014.Influence of climate on annual survival of Barn Swallows (Hirundo rustica) breeding in North America.Auk
131:351–362DOI 10.1642/AUK-13-145.1.
Hannah L, Midgley G, Andelman S, Araujo MB, Hughes G, Martinez-Meyer E, Pearson RG, Williams P. 2007.Protected area needs in a changing climate.Frontiers in Ecology and the Environment5:131–138DOI 10.1890/1540-9295(2007)5[131:PANIAC]2.0.CO;2.
Hansen J, Sato M, Ruedy R, Lo K, Lea DW, Medina-Elizade M. 2006.Global temperature change.
Proceedings of the National Academy of Sciences of the United States of America103:14288–14293 DOI 10.1073/pnas.0606291103.
Harris JBC, S¸ekercio˘glu CH, Sodhi NS, Fordham DA, Paton DC, Brook BW. 2011.The tropical frontier in avian climate research.Ibis153:877–882DOI 10.1111/j.1474-919X.2011.01166.x. Hoyos N, Escobar J, Restrepo JC, Arango AM, Ortiz JC. 2013.Impact of the 2010–2011 La Ni˜na
phenomenon in Colombia, South America: the human toll of an extreme weather event.Applied Geography39:16–25DOI 10.1016/j.apgeog.2012.11.018.
Jankowski JE, Londo˜no GA, Robinson SK, Chappell MA. 2013.Exploring the role of physiology and biotic interactions in determining elevational ranges of tropical anaimals.Ecography
36:1–12DOI 10.1111/j.1600-0587.2012.07785.x.
Jones J, Doran PJ, Holmes RT. 2003.Climate and food synchronize regional forest bird abundances.Ecology84:3024–3032DOI 10.1890/02-0639.
Karr JR, Freemark KE. 1983.Habitat selection and environmental gradients: dynamics in the “stable” tropics.Ecology64:1481–1494DOI 10.2307/1937503.
LaManna JA, George TL, Saracco JF, Nott MP, DeSante DF. 2012.El Ni˜no-Southern Oscillation influences annual survival of a migratory songbird at a regional scale.Auk129:734–743 DOI 10.1525/auk.2012.12017.
Latta SC, Tinoco BA, Astudillo PX, Graham CH. 2011.Patterns and magnitude of temporal change in avian communities in the Ecuadorian Andes.Condor113:24–40
DOI 10.1525/cond.2011.090252.
Loiselle BA, Blake JG. 1992.Population variation in a tropical bird community.BioScience
42:838–845DOI 10.2307/1312083.
MacArthur RH. 1955.Fluctuations of animal populations, and a measure of community stability.
Martinez AE, Gomez JP. 2013. Are mixed-species bird flocks stable through two decades?American Naturalist181:E53–E59DOI 10.1086/669152.
Mazzerolle DF, Dufour KW, Hobson KA, Den Haan HE. 2005.Effects of large-scale climatic fluctuations on survival and production of young in a Neotropical migrant songbird, the Yellow WarblerDendroica petechia.Journal of Avian Biology36:155–163
DOI 10.1111/j.0908-8857.2005.03289.x.
Merino S, Moreno J, Sanz JJ, Arriero E. 2000.Are avian blood parasites pathogenic in the wild? A medication experiment in Blue Tits (Parus caeruleus).Proceedings of the Royal Society of London, Series B267:2507–2510DOI 10.1098/rspb.2000.1312.
Nott MP, DeSante DF, Siegel RB, Pyle P. 2002.Influences of the El Ni˜no/Southern Oscillation and the North Atlantic Oscillation on avian productivity in forests of the Pacific Northwest of North America.Global Ecology and Biogeography11:333–342DOI 10.1046/j.1466-822X.2002.00296.x. Pianka E. 1966.Latitudinal gradients in species diversity: a review of concepts.American Naturalist
100:33–66DOI 10.1086/282398.
Powell LL, Cordeiro NJ, Stratford JA. 2015.Ecology and conservation of avian insectivores of the rainforest understory: a pantropical perspective.Biological Conservation188:1–10
DOI 10.1016/j.biocon.2015.03.025.
Remsen Jr JV, Cadena CD, Jaramillo A, Nores M, Pacheco JF, Robbins MB, Schulenberg TS, Stiles FG, Stotz DF, Zimmer KJ. 2015.A classification of the bird species of South America. American Ornithologists’ Union. Available athttp://www.museum.lsu.edu/∼Remsen/ SACCBaseline.html(accessed July 2015 2014).
Restrepo JD, Kjerfve B. 2000.Magdalena River: interannual variability (1975–1995) and revised water discharge and sediment load estimates.Journal of Hydrology235:137–149 DOI 10.1016/S0022-1694(00)00269-9.
Robinson WD. 1999.Long-term changes in the avifauna of Barro Colorado Island, Panama, a tropical forest isolate.Conservation Biology13:85–97DOI 10.1046/j.1523-1739.1999.97492.x. Robinson WD. 2001.Changes in abundance of birds in a Neotropical forest fragment over
25 years: a review.Animal Biodiversity and Conservation24:51–65.
Root TL, Price JT, Hall KR, Schneider SH, Rosenzweig C, Pounds JA. 2003.Fingerprints of global warming on animals and plants.Nature421:57–60DOI 10.1038/nature01333.
Ryder TB, Dur˜aes R, Tori WP, Hidaldo JR, Loiselle BA, Blake JG. 2008.Nest survival for two species of manakins (Pipridae) in lowland Ecuador.Journal of Avian Biology 39:355–358 DOI 10.1111/j.0908-8857.2008.04290.x.
Savidge JA. 1984.Guam: paradise lost for wildlife.Biological Conservation 30:305–317 DOI 10.1016/0006-3207(84)90049-1.
Shaw DW, Escalante P, Rappole JH, Ramos MA, Oehlenschlager RJ, Warner DW, Winker K. 2013.Decadal changes and delayed avian species losses due to deforestation in the northern Neotropics.PeerJ1:e179DOI 10.7717/peerj.179.
Sigel BJ, Sherry TW, Young BE. 2006.Avian community response to lowland tropical forest isolation: 40 years of change at La Selva Biological Station, Costa Rica.Conservation Biology
20:111–121DOI 10.1111/j.1523-1739.2005.00293.x.
Sillett TS, Holmes RT, Sherry TW. 2000.Impacts of a global climate cycle on population dynamics of a migratory songbird.Science288:2040–2042DOI 10.1126/science.288.5473.2040.
Stiles FG. 1992.Effects of a severe drought on the population biology of a tropical hummingbird.
Stouffer P, Johnson EI, Bierregaard Jr RO, Lovejoy TE. 2011.Understory bird communities in Amazonian rainforest fragments: species turnover through 25 years post-isolation in recovering landscapes.PLoS ONE6:e20543DOI 10.1371/journal.pone.0020543.
Stuart SN, Chanson JS, Cox NA, Young BE, Rodrigues ASL, Fischman DL, Waller RW. 2004. Status and trends of amphibian declines and extinctions worldwide.Science306:1783–1786 DOI 10.1126/science.1103538.
Styrsky JN, Brawn JD. 2011.Annual fecundity of a Neotropical bird during years of high and low rainfall.Condor113:194–199DOI 10.1525/cond.2011.100051.
Su´arez E, Morales M, Cueva R, Utreras-Bucheli V, Zapata-R´ıos G, Toral E, Torres J, Prado W, Vargas-Olalla J. 2009.Oil industry, wild meat trade and roads: indirect effects of oil extraction activities in a protected area in north-eastern Ecuador.Animal Conservation12:364–373 DOI 10.1111/j.1469-1795.2009.00262.x.
Svensson-Coelho M, Blake JG, Loiselle BA, Penrose AS, Parker PG, Ricklefs RE. 2013.Diversity, prevalence, and host specificity of avianPlasmodiumandHaemoproteusin a western Amazon assemblage.Ornithological Monographs76:1–48DOI 10.1525/om.2013.76.1.1.
Terborgh J, Robinson SK, Parker III TA, Munn CA, Pierpont N. 1990. Structure and organization of an Amazonian forest bird community.Ecological Monographs60:213–238 DOI 10.2307/1943045.
Van Riper III C, Van Riper SG, GoffML, Laird M. 1986.The epizootiology and ecological significance of malaria in Hawaiian land birds.Ecological Monographs 56:327–344 DOI 10.2307/1942550.
Warner RE. 1968.The role of introduced diseases in the extinction of the endemic Hawaiian avifauna.Condor70:101–120DOI 10.2307/1365954.
Whitfield SM, Bell KE, Philippi Y, Sasa M, Bola˜nos F, Chaves G, Savage JM, Donnelly MA. 2007.Amphibian and reptile declines over 35 years at La Selva, Costa Rica.Proceedings of the National Academy of Sciences of the United States of America 140:8352–8356 DOI 10.1073/pnas.0611256104.
Wolfe JD, Ralph CJ. 2009.Correlations between El Ni˜no–Southern Oscillation and changes in Nearctic–Neotropic migrant condition in Central America. Auk 126:809–814 DOI 10.1525/auk.2009.08018.
Wolfe JD, Ralph CJ, Elizondo P. 2015.Changes in the apparent survival of a tropical bird in response to the El Ni˜no Southern Oscillation in mature and young forest in Costa Rica.
Oecologia178:715–721DOI 10.1007/s00442-015-3256-z.