Submitted10 June 2015
Accepted 4 April 2016
Published5 May 2016
Corresponding author
Gert Wörheide, [email protected]
Academic editor
Keith Crandall
Additional Information and Declarations can be found on page 16
DOI10.7717/peerj.1970
Copyright
2016 Tusso et al.
Distributed under
Creative Commons CC-BY 4.0
OPEN ACCESS
Genetic structure of the crown-of-thorns
seastar in the Pacific Ocean, with focus
on Guam
Sergio Tusso1, Kerstin Morcinek2, Catherine Vogler3, Peter J. Schupp4,
Ciemon F. Caballes5, Sergio Vargas1and Gert Wörheide1,6,7
1Department of Earth and Environmental Sciences, Palaeontology & Geobiology,
Ludwig-Maximilians-Universität München, München, Germany
2Department of Anatomy (Neuroanatomy), University of Cologne, Köln, Germany 3Environment Department, Pöyry Switzerland Ltd., Zurich, Switzerland
4Environmental Biochemistry, Carl-von-Ossietzky University Oldenburg, ICBM-Terramare, Wilhelmshaven,
Germany
5ARC Centre of Excellence for Coral Reef Studies, James Cook University, Townsville, Queensland, Australia 6SNSB-Bavarian State Collections of Palaeontology and Geology, München, Germany
7GeoBio-Center, Ludwig-Maximilians-Universität München, München, Germany
ABSTRACT
Population outbreaks of the corallivorous crown-of-thorns seastar (COTS),Acanthaster ‘planci’ L., are among the most important biological disturbances of tropical coral reefs. Over the past 50 years, several devastating outbreaks have been documented around Guam, an island in the western Pacific Ocean. Previous analyses have shown that in the Pacific Ocean, COTS larval dispersal may be geographically restricted to certain regions. Here, we assess the genetic structure of Pacific COTS populations and compared samples from around Guam with a number of distant localities in the Pacific Ocean, and focused on determining the degree of genetic structure among populations previously considered to be isolated. Using microsatellites, we document substantial genetic structure between 14 localities from different geographical regions in the Pacific Ocean. Populations from the 14 locations sampled were found to be structured in three significantly differentiated groups: (1) all locations immediately around Guam, as well as Kingman Reef and Swains Island; (2) Japan, Philippines, GBR and Vanuatu; and (3) Johnston Atoll, which was significantly different from all other localities. The lack of genetic differentiation between Guam and extremely distant populations from Kingman Reef and Swains Island suggests potential long-distance dispersal of COTS in the Pacific.
SubjectsBiogeography, Evolutionary Studies, Marine Biology
Keywords Acanthaster ‘planci’, Microsatellites, Pacific, Genetic structure, Crown-of-thorns seastar, COTS
INTRODUCTION
molecular data suggests thatAcanthaster ‘planci’is a species complex consisting of at least four different species (Vogler et al., 2008), all of them showing internal phylogeographic structure, and one of which is largely restricted to the Pacific (Vogler et al., 2012;Vogler et al., 2013). Since formal description of these species is still pending, we refer to the Pacific species asAcanthaster ‘planci’ or COTS hereafter. COTS predatory behaviour has resulted high levels of coral mortality. For example, massive outbreaks on the northwest coast of Guam in the late 1960s reduced coral cover down to <10% (Chesher, 1969) and coral species richness decreased from 146 to 96 one year after the outbreaks (Randall, 1973). As a consequence, the community structure of affected coral reefs have often been significantly altered, promoting algal colonization and affecting fish population dynamics (Pratchett et al., 2014).
Although frequently studied, the origin, development and causes of COTS outbreaks remain largely unclear (Birkeland & Lucas, 1990;Kayal et al., 2012;Pratchett et al., 2014;
Vogler et al., 2013; Yasuda et al., 2009). Different authors (i.e., Benzie, 1999a; Brodie et al., 2005;Gérard et al., 2008;Scheltema, 1986) have highlighted the importance of larval survival and dispersal in explaining COTS outbreaks. A single female COTS can produce more than 60 million eggs per spawning season (Conand, 1984) and this can result in more than 10 million fertilised eggs per year per mature female (Benzie et al., 1994). Therefore, a small increase in the survival rate of the COTS larvae could lead to a rapid increase in population size (Brodie et al., 2005) and geographic spread, considering a planktonic larval duration (PLD) ranging between 9 and 42 days (reviewed inCaballes & Pratchett, 2014). Different variables, such as an enhanced food supply (Brodie et al., 2005;Fabricius, Okaji & De’ath, 2010), reduced predation pressure due to overfishing (Sweatman, 2008), and changes in diverse environmental variables (e.g., sea surface temperature or rainfall;Black et al., 1995;Brodie et al., 2005;Glynn, 1985;Houk, Bograd & Van Woesik, 2007) have been postulated to increase larval or adult survival and promote COTS outbreaks. Additional explanatory hypotheses on the local origin of outbreaks are given by changes in behaviour or survivorship of post-settlement individuals, e.g., a decrease in predation; (Endean, 1969), the movement of adults between reefs (Talbot & Talbot, 1971), adult aggregation (Dana, Newman & Fager, 1972), or outbreak cycles controlled by increase in pathogen transmission under high densities (reviewed inPratchett et al., 2014).
Considering the microscopic size of COTS larvae, analyses of its population dynamics to understand the structure and origin of outbreaks have focused on indirect molecular methods. This approach is grounded on the assumption that organisms with short planktonic stages and low spatial dispersal capabilities have higher population genetic structure (resulting from lower levels of gene flow) than those with longer planktonic stages, which are thought to have higher levels of gene flow and reduced population genetic structure. A correlation between the potential for migration and genetic structure has been observed in different marine groups, including other seastars (e.g.,Linckia laevigata;
Initial studies using allozymes to investigate COTS population genetics seemed to provide evidence of strong gene flow and lack of genetic structure (Benzie, 1999a;Benzie & Stoddart, 1992;Nash, Goddard & Lucas, 1988;Nishida & Lucas, 1988). However, more recent analyses using different molecular markers have pointed towards a different scenario. Using the mitochondrial control region (Timmers et al., 2012;Vogler et al., 2012;Vogler et al., 2013), internal genetic differentiation was observed within at least three of the four different clades (species) of A.‘planci’ (i.e., the Pacific, the Northern and the Southern Indian Ocean clades) proposed byVogler et al. (2008).Vogler et al. (2013)found support for at least four genetic groups in the Pacific Ocean andTimmers et al. (2012)discovered reduced gene flow among regions and archipelagos and significant genetic differentiation between COTS populations from the Central Pacific Ocean. Thus COTS dispersal seems to be limited to smaller geographic areas, for instance within the Great Barrier Reef (GBR) (Benzie & Stoddart, 1992;Benzie & Wakeford, 1997), in the Ryukyus Islands (Yasuda et al., 2009) and along the Hawaiian Archipelago (Timmers et al., 2011).
Although mitochondrial markers show genetic differentiation between populations that have large scale geographic structure (Timmers et al., 2012;Vogler et al., 2013), these markers have not allowed differentiation between historical evolutionary migration and contemporary gene flow. For example,Timmers et al. (2012)showed that there are shared mitochondrial haplotypes between the South Central and Northwest Pacific and that their haplotypes do not strictly cluster according to geographic region. This pattern was inter-preted as either recent gene flow, the retention of ancestral polymorphisms or ancestral gene flow (Timmers et al., 2012). Similarly,Vogler et al. (2013)found a large geographic cluster of Western Pacific localities, with shared haplotypes in the whole range from the GBR to the Philippines. However, microsatellite data (Yasuda et al., 2009) show that significant genetic differentiation in this region is more pronounced, with patterns of isolation by distance and significant pairwiseFST values (fixation index) between several localities indicating
intra-cluster genetic differentiation.
The differentiation between contemporary gene-flow patterns and evolutionary history is of importance for conservation biology as highlighted by several authors (e.g.,Peijnenburg et al., 2006;Selkoe & Toonen, 2006;Eytan & Hellberg, 2010;Van der Meer et al., 2012). The mutation rate of mitochondrial DNA is known to be suitable to resolve taxonomic uncertainties and historical biogeographical events, but it may not be suitable to infer contemporary migration events (Wan et al., 2004). Microsatellites, which evolve up to 100 times faster than mitochondrial DNA, provide enough variance for inferring patterns of gene flow and contemporary genetic structure (Wan et al., 2004), especially at smaller geographical scales. Despite their many advantages, there are only two studies using microsatellites from COTS and they are mainly concerned in the connectivity patterns among Western Pacific populations (Yasuda et al., 2009) and locally at the Society Islands, French Polynesia (Yasuda et al., 2014). The applicability of microsatellites to investigate the relatedness of Pacific COTS populations and their genetic structure over larger geographic distances has not been tested yet.
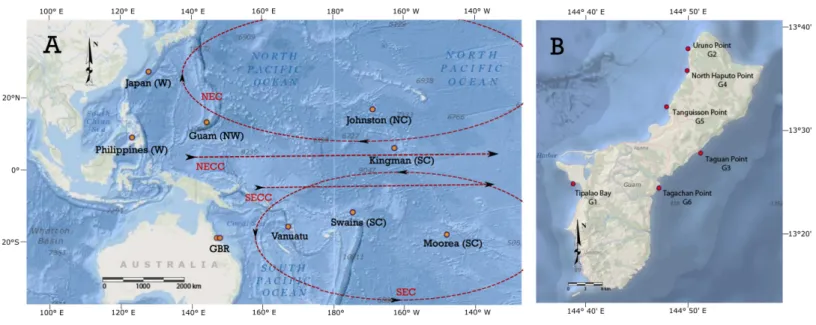
Figure 1 Acanthaster ‘planci’localities sampled in the Pacific Ocean and around Guam. (A)Acanthaster ‘planci’[i]localities sampled in the Pacific Ocean. Localities are coded by geographical regions: west Pacific (W), north-west Pacific (NW), north-central Pacific (NC), south-central Pacific (SC). GBR represents the Great Barrier Reef. Current paths are presented in dashed line: North Equatorial Countercurrent (NECC), North Equatorial Current (NEC), South Equatorial Countercurrent (SECC), and South Equatorial Current (SEC). (B) Details of sampling locations around Guam. Maps are taken and modified fromwww.arcgis.com. Source: Esri, GEBCO, DeLorme, NaturalVue—Esri, GEBCO, IHO-IOC GEBCO, DeLorme, NGS.
geographical regions previously identified as a cohesive genetic unit by mitochondrial DNA. We especially focus on the genetic structure of populations around Guam, where recent COTS outbreaks have been observed. We compared samples from around Guam with a number of distant localities in the Pacific Ocean, and focused on determining the degree of genetic structure among populations previously considered to be isolated (i.e., Johnston Atoll, Kingman Reef, Swains Island, Japan, the Great Barrier Reef , Vanuatu, Moorea, and Philippines).
MATERIALS AND METHODS
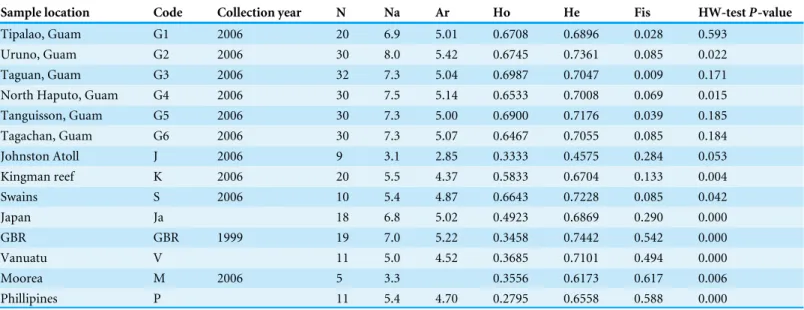
SamplingTable 1 Summary information of sampled localities.Code of locality, collection year, number of samples (N), number of alleles (Na), allelic rich-ness (Ar), observed heterozygosity (Ho), expected heterozygosity (He), and inbreeding coefficient (Fis) are given.
Sample location Code Collection year N Na Ar Ho He Fis HW-testP-value
Tipalao, Guam G1 2006 20 6.9 5.01 0.6708 0.6896 0.028 0.593
Uruno, Guam G2 2006 30 8.0 5.42 0.6745 0.7361 0.085 0.022
Taguan, Guam G3 2006 32 7.3 5.04 0.6987 0.7047 0.009 0.171
North Haputo, Guam G4 2006 30 7.5 5.14 0.6533 0.7008 0.069 0.015
Tanguisson, Guam G5 2006 30 7.3 5.00 0.6900 0.7176 0.039 0.185
Tagachan, Guam G6 2006 30 7.3 5.07 0.6467 0.7055 0.085 0.184
Johnston Atoll J 2006 9 3.1 2.85 0.3333 0.4575 0.284 0.053
Kingman reef K 2006 20 5.5 4.37 0.5833 0.6704 0.133 0.004
Swains S 2006 10 5.4 4.87 0.6643 0.7228 0.085 0.042
Japan Ja 18 6.8 5.02 0.4923 0.6869 0.290 0.000
GBR GBR 1999 19 7.0 5.22 0.3458 0.7442 0.542 0.000
Vanuatu V 11 5.0 4.52 0.3685 0.7101 0.494 0.000
Moorea M 2006 5 3.3 0.3556 0.6173 0.617 0.006
Phillipines P 11 5.4 4.70 0.2795 0.6558 0.588 0.000
nine reef locations in the Pacific (Fig. 1;Table 1). The choice of sampling locations outside Guam was based on previous studies using sequences of the mitochondrial control region and designed to include localities from the most distinguishable genetic groups in the Pacific (Vogler et al., 2013): West, North-Central, North-West and South-Central Pacific (Fig. 1). Since the goal of this study was to evaluate the genetic structure between distant localities, the sampling included islands ranging in distance from over 2,000 km between Guam and Japan to over 5,000 km between Guam and Kingman Reef. Although genetic connectivity has not been reported between some of the sampled localities (e.g., Johnston Atoll and Guam) and oceanic currents predict isolation, these localities were also included here to characterise the variance of the markers used, control for possible homoplasy or as an internal methodological control, assuming that those populations should be genetically highly differentiated.
The samples were stored in ethanol 80% or DMSO buffer at−80 ◦C. A MagAttract 95
DNA Plant Core Kit (Qiagen) was used to extract total DNA from tube feet and pyloric caeca samples, following the protocol recommended by the manufacturer. As a preliminary step, the tissue was ground after freezing in liquid nitrogen, and incubated for 1 h at 35 ◦C
in RLT lysis buffer (Qiagen). In the case of tube feet, DNA was extracted using the DNeasy Tissue Kit (Qiagen), according to the protocol recommended by the manufacturer.
All samples were genotyped using a set of 13 microsatellites previously identified for
A. ‘planci’ (Yasuda et al., 2006;Yasuda et al., 2007). The set included the loci Yukina01, Yukina05, Yukina06, Yukina08, Maki01, Maki03, Tama01 and Hisayo01 fromYasuda et al. (2006) and Aya02, Maki12, Maki11, Tama11 and AyU03 fromYasuda et al. (2007). Standard three-step PCR reactions were conducted for each locus in a final volume of 12.5 µl of GoTaq Flexi BufferR 1x, MgCl23 mM, dNTPs 0.4 mM, primers forward and
of DNA template (around 20 ng of DNA). For fragment length analysis, the 5′end of the forward primers used in the PCR were labelled with a fluorescent dye (HEX, 6-FAM or BoTMR). The PCR cycling conditions were as follows: 10 min at 94 ◦C, 38 cycles of 30 s at 94 ◦C, 30 s at 56–60 ◦C (primer-specific annealing temperature), and 1min at 72 ◦C, and
a final elongation of 5 min at 72 ◦C.
PCR products were mixed for genotyping in 3 different co-loading reactions as follows: co-loading 1 included loci Yukina01, Yukina05, Yukina06 and Yukina08; co-loading 2 included Maki01, Maki03, Tama01 and Hisayo01; and co-loading 3 included Aya02, Maki12, Maki11, Tama11 and AyU03. Samples were analysed on an ABI 3730 48 capillary sequencer (Applied Biosystems) using the dye set D and G5 and 400HD ROX size standard at the Sequencing Service of the Department of Biology at the Ludwig-Maximilians-Universität in Munich (Germany). The software GeneMapper v.4.1 was used to call allele sizes. The raw genotype data is given inTable S1.
Data analysis
The Markov chain algorithm implemented in the software GENEPOP v.4.2 (Raymond & Rousset, 1995;Rousset, 2008) was used to test each locus per location for departure from Hardy–Weinberg equilibrium (HWE). The same software was used to assess linkage disequilibrium (LD) between different combinations of paired loci. The analysis of HWE was conducted with a dememorisation period of 10,000 generations, 100 batches and 5,000 iterations per batch. In the case of LD, the number of batches was increased to 1,000. Ad-ditionally, the software Micro-Checker v.2.2.3 (Van Oosterhout, Weetman & Hutchinson, 2006) was used to test for systematic distortion of HWE in each locus, which is an indication for the presence of null alleles, large allele dropout or other scoring errors. Sequential Bonferroni corrections for multiple comparisons were used to adjust the threshold of statistical significance in both analyses (Holm, 1979;Rice, 1989). Loci that departed from HWE, showed LD or evidence of errors in scoring were not included in subsequent analyses.
Genetic diversity within each locality was determined through the estimation of number of alleles per locus and locality, gene diversity, observed and expected heterozygosity and allelic richness using the software ARLEQUIN v.3.5.1.2 (Excoffier & Lischer, 2010) and GENEPOP v.4.2 (Raymond & Rousset, 1995;Rousset, 2008). The permutation of localities (1,000 randomizations) was used to determine differences in genetic diversity using the software FSTAT v.2.9.3.2 (Goudet, 2001).
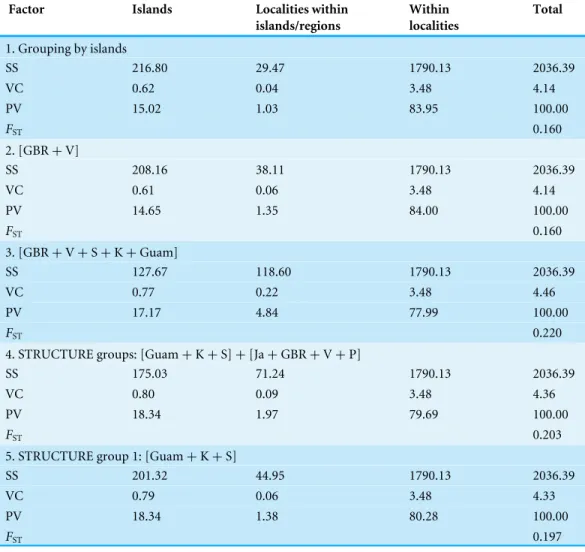
A hierarchical analysis of molecular variance (AMOVA) loci by loci was carried out in ARLEQUIN v.3.5.1.2 (Excoffier, Smouse & Quattro, 1992;Excoffier & Lischer, 2010). AMOVA (with 20,000 permutations) was used to determine genetic diversity (as a source of covariance) and its significance within and between localities, and between islands. AMOVA was also performed by grouping islands according to the connectivity predicted by oceanic currents and assuming passive larval dispersal (Treml et al., 2008), and by grouping them based on clusters obtained from the program STRUCTURE (see below). The purpose of this last analysis was to evaluate the strength of the separation between the inferred clusters. Population pairwise FST values were estimated and significance was assessed
and Bonferroni correction. Confidence intervals were estimated with the packagediveRsity
(Keenan et al., 2013).
The estimation of the number of distinct populations and the assignment of individual samples to populations was done using the software STRUCTURE v.2.3.4 (Falush, Stephens & Pritchard, 2003; Falush, Stephens & Pritchard, 2007; Hubisz et al., 2009; Pritchard, Stephens & Donnelly, 2000). The number of potential populations or clusters (K) was evaluated using values forKfrom 1 to 10, with at least 12 independent runs for each value. Uniform priors in an admixture ancestry model were used in each run with a burn-in period of 200,000 generations, a posterior sampling chain of 1,000,000 generations and the assumption of correlated allele frequencies among samples. The determination of the most accurate value forKwas evaluated using the statistic1K following the methodology
ofEvanno, Regnaut & Goudet (2005).
Finally, genetic structure and differentiation between localities was also determined by a discriminant analysis of principal components (DAPC;Jombart, Devillard & Balloux, 2010). This last analysis was performed using the packageadegenet (Jombart, Devillard & Balloux, 2010) implemented in R v.3.0.1 (http://www.r-project.org/). Individuals with missing data were not included in this analysis.
RESULTS
Hardy–Weinberg equilibrium, linkage disequilibrium and possible genotyping errors
Based on an exact test using one Markov chain for each locus per sampled location, three loci deviated significantly from HWE in almost all locations (initialp-value < 0.05 after sequential Bonferroni correction). These loci wereTama01, Maki11andTama11, which deviated in more than 8 (out of 14) locations. Additionally, the analysis with Micro-Checker showed a consistent excess of homozygotes in the same markers, suggesting the presence of null alleles, polymerase stuttering or large allele dropout. Because these results were consistently biased for most of the sampled localities, those three loci were not included in subsequent analyses.
The remaining markers showed HWE, with punctual deviations in some populations (i.e., Yukina05, Mak03, Aya2 and AyU03 in non-HWE in 2, 1, 3 and 4 localities, respectively). In these cases the tests used did not show evidence of linkage disequilibrium, null alleles, or biases in the identification of genotypes. Thus, these loci were included in all subsequent analyses.
Gene diversity within populations
Most of the microsatellite loci were highly polymorphic. Two exceptions were found:
Table 2 PairwiseFSTvalues for 13Acanthaster ‘planci’localities.Bold numbers and gray cells indicate
statistical significance after FDR and Bonferroni correction atP<0.05. The red and blue squares show the regional group found in this study based on STRUCTURE and PCA analyses (see text for details).
The high genetic diversity suggested by the number of alleles in each location contrasted with the findings on allelic richness. The high genetic variability within localities precluded observing differences in allelic richness between localities (Table S2). After correction for different sampling sizes using a rarefaction analysis, the lowest value of allelic richness was found at Johnston Atoll (2.85), the highest values were observed for the localities in Guam (around 5.11), Japan (5.20) and the GBR (5.22). Despite these differences, the allelic accumulation function, which predicts the expected number of alleles to be observed if the localities would have had the same sample size (Van Loon, Cleary & Fauvelot, 2007), did not show differences in allelic richness between localities due to a broad confidence interval (Fig. S1).
Genetic structure
PairwiseFSTvalues obtained ranged from 0.000 to 0.480 (Table 2). In general, the lowest
values were found between localities inside Guam and the highest in most comparisons involving Johnston Atoll. FST analysis showed three significantly differentiated groups:
(1) all the localities immediately around Guam, as well as Kingman and Swains Island (2) Japan, Philippines, GBR, and Vanuatu; and (3) Johnston Atoll, which was significantly different from all other localities. PairwiseFSTvalues between localities inside regional
groups were significantly lower (around 0.05 as the highest value) than between localities from different regional groups (FSTvalues higher than 0.15) (Table 2, confidence intervals
inTable S3). Moorea was significantly different from the other localities, showing the lowest pairwiseFSTwith Vanuatu (0.203) and an overall average value of 0.260. However, due to
the wide confidence intervals for theFSTvalues (seeTable S3) obtained from comparisons
Within the first group, it is important to note that all the localities around Guam, except Tipalao Bay (G1), had statistically significant genetic similarities with Kingman Reef and/or Swains Island. This is noteworthy because the population in Tipalao Bay was the only aggregation in the southwest coast of Guam during surveys and COTS were almost absent in adjacent reefs (C Caballes, pers. obs., 2006). Moreover, the FST values obtained for several of the comparisons between Guam populations
were higher than those obtained in comparisons between Kingman or Swains and localities around Guam. For example, the comparison between North Haputo point (G4) and Tagachan point (G6), and Tipalao Bay (G1) and Taguan Point (G3) resulted in FST values of 0.034 and 0.032, respectively. In contrast, theFST between Kingman
Island (K) and Taguan Point (G3) in Guam was 0.006 and between Swains Island (S) and Uruno Point (G2) was 0.010. However, the genetic differences observed among localities around Guam and between Guam and Kingman or Swains Island were not statistically significant due to the broad confidence intervals for theFSTvalues.
According to the results of the AMOVA, the percentage of genetic covariance explained by individual variation was 84% (variation within localities inTable 3); while 15% of the genetic variation can be attributed to differentiation between islands and only 1% is explained by variation among localities (i.e., sampling sites). The same analysis grouping islands according to the three groups found in the pairwiseFSTanalysis and in Bayesian
clustering with STRUCTURE (see below) resulted in a reduction in the percentage of genetic variance explained by individual variation (Variation within localities=80% in case 4 and 5 fromTable 3) and in an increase in the percentage of variance explained by regions (18%). Grouping islands based on oceanic currents (Treml et al., 2008) also increased the variance explained by regions (14% and 17% in case 2 and 3 fromTable 3) andFSTvalues,
but the values were lower than in the previous two analyses (case 4 and 5 fromTable 3).
Population structure
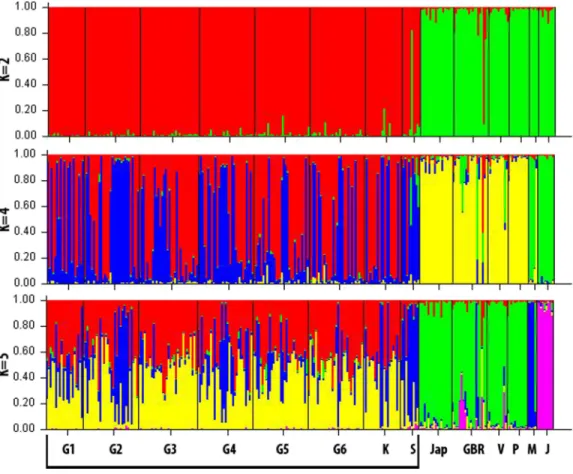
The Bayesian clustering analysis with STRUCTURE and the estimation of1K (Evanno,
Regnaut & Goudet, 2005) indicated the existence of two peaks in the most likely number of ancestral gene pools. The highest value of1K was obtained forK=2. A second peak was
observed atK=4. This last value corresponds with the point where a significant change in the slope of the likelihood distribution is observed. Moreover, DAPC showed a significantly low Bayesian Information Criterion (BIC) value for the existence of 5 genetically different groups (Fig. 2andFig. S2).
Table 3 Results from AMOVA grouping localities by islands and regional groups.In all casesp-values were highly significant (<0.001 after Bonferroni and FDR correction). In all cases, all localities were in-cluded in the analysis, but the regional groups change. Groups in case 2 and 3 are based on models using oceanic currents and different PLDs (30 and 60 days) (Treml et al., 2008). Groups in case 4 and 5 are based on findings from Bayesian analyses. Names of localities as inTable 1.
Factor Islands Localities within
islands/regions
Within localities
Total
1. Grouping by islands
SS 216.80 29.47 1790.13 2036.39
VC 0.62 0.04 3.48 4.14
PV 15.02 1.03 83.95 100.00
FST 0.160
2. [GBR+V]
SS 208.16 38.11 1790.13 2036.39
VC 0.61 0.06 3.48 4.14
PV 14.65 1.35 84.00 100.00
FST 0.160
3. [GBR+V+S+K+Guam]
SS 127.67 118.60 1790.13 2036.39
VC 0.77 0.22 3.48 4.46
PV 17.17 4.84 77.99 100.00
FST 0.220
4. STRUCTURE groups: [Guam+K+S]+[Ja+GBR+V+P]
SS 175.03 71.24 1790.13 2036.39
VC 0.80 0.09 3.48 4.36
PV 18.34 1.97 79.69 100.00
FST 0.203
5. STRUCTURE group 1: [Guam+K+S]
SS 201.32 44.95 1790.13 2036.39
VC 0.79 0.06 3.48 4.33
PV 18.34 1.38 80.28 100.00
FST 0.197
Notes.
SS, sum of squares; VC, variance component; PV, percentage of covariance.
predicted populations from 2 to 5 revealed the differentiation of islands such as Moorea and Johnston Atoll, and increased the heterogeneity observed inside the GBR.
Differentiation and relatedness between localities
Figure 2 Graphical summary of Bayesian clustering results.Samples were assigned among 2, 4 and 5 genetic clusters (K). Each colour represents the probability of corresponding to a specific cluster. Each lo-cality is separated by a black line. The Guam group (Guam, Kingman and Swains Islands) is highlighted with the horizontal black line at the bottom.
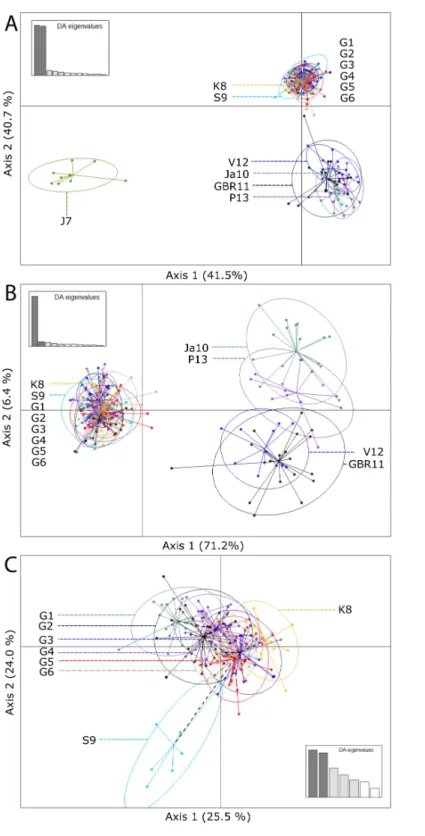
Because the genetic differentiation of Johnston Atoll with the other islands was strong, additional DAPC analyses were performed (Figs. 3Band3C). Aiming to gain insights into the genetic differentiation within each group, in one analysis Johnston Atoll was excluded and in a second one only localities from Guam, Kingman and Swains Island were included. Excluding Johnston Atoll, the level of clustering between localities was more pronounced for the first group of localities (Guam, Kingman and Swains) than for the second group (GBR, Japan, Philippines and Vanuatu). This is of considerable interest, because geographic distance between Guam, Kingman, and Swains was higher compared to distances between localities in the second group. Additionally, although gene flow between all the locations of the second group appears likely, there was an apparent subdivision inside this group with the GBR grouping with Vanuatu, and Japan grouping together with the Philippines (Fig. 3B). The differentiation between these two subgroups was given only by the second axis (Y axis) of the DAPC and the percentage of variance explained by this axis was low (6.4% of the variance).
more related to Kingman (for example G3, G4, G5 and G6) and with a slight overlap with Swains and other localities more isolated from Kingman and Swains (locality G1). These results suggest the existence of genotypes in Guam that are different to those found in Kingman and Swains Islands (unique haplotypes).
DISCUSSION
Contemporary long-distance dispersal across the Pacific
This study found genetic structure within large geographical regions in the Pacific but also suggests that gene-flow between distant locations likely occurs inA. ‘planci.’ Given the broad geographical distances separating the localities evaluated here, it is likely that this dispersal occurs in a stepping stone model involving intermediate localities not sampled in this study. The sampled localities in the Pacific were found to be structured in at least three large groups with apparently limited larval dispersal between them. The first group comprised Guam, Kingman Reef and Swains Islands; the second group included the Japan, Philippines, GBR and Vanuatu; and Johnston Atoll was isolated in a third group. Although a general high genetic diversity was found inside each sampled island, our analyses showed strong genetic similarities between localities in Guam, Kingman and Swains Island suggesting larval dispersal between these geographically distant regions. Gene-flow between these localities in the Pacific Ocean has been also inferred using allozymes from other marine organisms with high larval dispersal potential (e.g.,Linckia laevigata,Williams & Benzie, 1997; some species of corals,Ayre & Hughes, 2000; sea cucumbers,Uthicke & Benzie, 2003).
Connectivity of marine organisms has been modelled as a diffusion process in which larvae and juveniles are transported by oceanic currents between suitable habitats (Treml et al., 2008;Kool et al., 2011;Treml et al., 2012;Wood et al., 2014;Treml et al., 2015). In these models, one of the criteria determining the connectivity between localities is the duration of the larval stage (planktonic larval duration, PLD)—assuming that organisms with longer PLDs are capable of migrating longer distances. According to these models, the dispersal potential ofA. ‘planci,’with a PLD of up to 42 days (reviewed inPratchett et al., 2014), would allow the migration of individuals across long distances (see also
Vogler et al., 2013), potentially connecting the islands of Guam, Kingman and Swains in a stepping-stone model. Our results from microsatellite data are consistent, in part, with this model as evidenced by the lack of genetic structure between Guam and geographically distant COTS samples from Kingman Reef and Swains Island. However, intermediate islands/reefs between Guam and Kingman/Swains (e.g., Marshall Islands, Pohnpei) need to be sampled in the future to test the stepping-stone model proposed here.
between these localities. This combination would make East-West larval dispersal difficult even for organisms with long PLDs (Treml et al., 2008;Kool et al., 2011;Treml et al., 2015). There are notable discrepancies between our study and previous studies using the control region of the mtDNA (Timmers et al., 2012;Vogler et al., 2013) in terms of population structure and differentiation between localities in the Pacific Ocean. According toTimmers et al. (2012), populations in the Central Pacific are genetically differentiated into three main regions with few or no shared haplotypes: North, South and North-West Pacific. They found that the Johnston Atoll is part of the North region; Kingman, Swains and Moorea Islands belonged to the South region and Guam to the North-West region. Additionally,
Vogler et al. (2013)grouped Guam in a large western region with Japan, Philippines and the GBR. Our results, using microsatellites, agree with these results in the broad geographical zonation in the Pacific, but this study also evidenced strong genetic similarity between supposedly distinct regions mentioned above, suggesting possible larval dispersal and gene flow between long distance localities in the south-central Pacific and the north-west Pacific regions, such as Guam, Kingman and Swains Islands.
Discordances between mtDNA and microsatellites data had been previously reported for
A. ‘planci’ populations from the Pacific Ocean. Using microsatellites,Yasuda et al. (2009)
found thatA. ‘planci’populations in the western Pacific (i.e., Japan and Philippines), the GBR, and the North Pacific Islands (i.e., Palau, Majuro and Pohnpei, which are geographi-cally close to Guam) belonged to different genetic groups. In contrast, when using mtDNA control region,Vogler et al. (2013)found thatA. ‘planci’samples from Palau were closer to the western Pacific population, while Majuro and Pohnpei were more related to the GBR.
Patterns of low control region mitochondrial divergence in Pacific COTS have been interpreted as a result of occasional exchange of larvae between distant areas, the retention of ancestral polymorphism or a signature of ancient gene flow (Timmers et al., 2012). In addition, Vogler et al. (2013)found signatures of a recent population expansion in a large group of Pacific populations (including Guam). Our analysis suggests that the mitochondrial divergence detected between some distant localities may gradually erode due to the likely existence of more contemporary gene flow between these localities. We would like to note that in this study, the direction, frequency and magnitude of the gene flow could not be assessed, and that this will require more extensive sampling of intermediate localities. Other explanations for the discrepancy between control region mtDNA and microsatellite data exist and include the non-neutral evolution of mtDNA (Ballard & Whitlock, 2004) with the potential for sex-biased migration or selection on specific haplotypes; differences in the effective population size, resulting in differences in the effect of genetic drift (Shaw, Arkhipkin & Al-Khairulla, 2004); or the higher likelihood for homoplasy in microsatellites over longer periods of time, due to higher mutation rates (O’Reilly et al., 2004). A more dense spatial sampling would allow to better understand which processes are involved in the mito-nuclear discordance observed.
Differences within Guam
example, it was found that some localities around Guam (e.g., Tipalao Bay (G1), Uruno Point (G2) and North Haputo Point (G4)) were genetically differentiated from Kingman Reef and/or Swains Islands (considering pairwiseFSTvalues), but other localities around
Guam (e.g., Taguan (G3) or Tanguisson (G5)) are suggesting dispersal from and to these distant localities. A similar pattern was found in the discriminant analysis of principal components (DAPC, Fig. 3); however, these genetic differences were not statistically significant due to the large confidence intervals of theFSTvalues. Additional studies are
needed to determine if those differences are biologically relevant or result from an increased variance inherent to the implemented methodology. The exact factors causing the observed differentiation remain to be determined, especially considering that previous studies using other markers, such as allozymes or control region mtDNA, have also identified genetic differences between local COTS populations (Benzie, 1999a;Benzie & Stoddart, 1992;Nash, Goddard & Lucas, 1988;Nishida & Lucas, 1988; seeTimmers et al., 2012for within island differentiation).
The genetic structure of COTS populations can be affected by a number of factors, such as different oceanographic conditions, climatic fluctuations, local adaptation and differential mortality of pre-settlement larval stages (Benzie & Stoddart, 1992;Yasuda et al., 2009). In addition, the distribution and dynamics ofA. ‘planci’ populations are sensitive to changes in food availability (abundance of coral prey), food quality (preferred coral species), and population densities (De’ath & Moran, 1998;Kayal et al., 2012). The sampled coastal localities in Guam differ in terms of the amounts of riverine discharge and hydrodynamic patterns (Wolanski et al., 2003), and the reefs vary in coral cover and community structure (Burdick et al., 2008). Changes in local conditions linked to anthropogenic activities (e.g., increased sedimentation, terrestrial runoff and overfishing;
Brodie et al., 2005) are capable of triggering primary outbreaks and may also facilitate larval survival and settlement success, leading to increased adult numbers and secondary outbreaks. All these risk factors have increased magnitude and frequency during the last decades in Guam (Burdick et al., 2008;Gawel, 1999) and may explain the increase in the frequency and impact ofA. ‘planci’ in this island and the structuring of its populations. Further studies are warranted to assess the relative importance of these local environmental factors on the genetic structure of COTS populations.
CONCLUSIONS
ACKNOWLEDGEMENTS
We would like to thank P Bloor, Sylvain Glémin and Lorena Ament for the valuable guidance in theoretical issues. We thank H Greve, PT Rojas Jr, N Pioppi, and J Miller for assistance in Guam sample collections. We are grateful to the University of Guam Marine Laboratory through which all sampling was carried out. SV would like to acknowledge N Villalobos, M Vargas and S Vargas for their constant support.
ADDITIONAL INFORMATION AND DECLARATIONS
Funding
ST received support from the Department of Earth and Environmental Sciences, Ludwig-Maximilians-Universität München for hosting him during the project and the funding from the MEME programme. PJS acknowledges support by the United State Department of Interior (DOI) and the National Oceanic and Atmospheric Administration (NOAA), grant number CRIGU10. The funders had no role in study design, data collection and analysis, decision to publish, or preparation of the manuscript.
Grant Disclosures
The following grant information was disclosed by the authors: MEME programme.
United State Department of Interior (DOI).
National Oceanic and Atmospheric Administration (NOAA): CRIGU10.
Competing Interests
The authors declare there are no competing interests. Catherine Vogler is currently an employee of Pöyry Switzerland Ltd, but this company had no relationship with the present study.
Author Contributions
• Sergio Tusso performed the experiments, analyzed the data, wrote the paper, prepared figures and/or tables, reviewed drafts of the paper.
• Kerstin Morcinek performed the experiments, reviewed drafts of the paper.
• Catherine Vogler conceived and designed the experiments, reviewed drafts of the paper.
• Peter J. Schupp and Ciemon F. Caballes contributed reagents/materials/analysis tools, reviewed drafts of the paper.
• Sergio Vargas analyzed the data, wrote the paper, reviewed drafts of the paper.
• Gert Wörheide conceived and designed the experiments, contributed reagents/material-s/analysis tools, reviewed drafts of the paper.
Data Availability
Supplemental Information
Supplemental information for this article can be found online athttp://dx.doi.org/10.7717/ peerj.1970#supplemental-information.
REFERENCES
Ayre DJ, Hughes TP. 2000.Genotypic diversity and gene flow in brooding and spawning corals along the Great Barrier Reef, Australia.Evolution54:1590–1605 DOI 10.1111/j.0014-3820.2000.tb00704.x.
Ballard JWO, Whitlock MC. 2004.The incomplete natural history of mitochondria.
Molecular Ecology 13:729–744DOI 10.1046/j.1365-294X.2003.02063.x.
Benjamini Y, Hochberg Y. 1995.Controlling the false discovery rate: a practical and powerful approach to multiple testing.Journal of the Royal Statistical Society: Series B (Methodological)57:289–300.
Benzie JAH. 1999a.Major genetic differences between crown-of-thorns starfish (Acanthaster planci) populations in the Indian and Pacific Oceans.Evolution
53:1782–1795DOI 10.2307/2640440.
Benzie JAH. 1999b.Genetic structure of coral reef organisms: ghosts of dispersal past.
American Zoologist39:131–145DOI 10.1093/icb/39.1.131.
Benzie JAH, Black KP, Moran PJ, Dixon P. 1994.Small-scale dispersion of eggs and sperm of the crown-of-thorns starfish (Acanthaster planci) in a shallow coral reef habitat.The Biological Bulletin186:153–167DOI 10.2307/1542049.
Benzie JAH, Stoddart JA. 1992.Genetic-structure of outbreaking and non-outbreaking Crown-of-Thorns Starfish (acanthaster-planci) populations on the great-barrier-reef.
Marine Biology 112:119–130DOI 10.1007/BF00349735.
Benzie JAH, Wakeford M. 1997.Genetic structure of crown-of-thorns starfish (Acanthaster planci) on the Great Barrier Reef, Australia: comparison of two sets of outbreak populations occurring ten years apart.Marine Biology129:149–157 DOI 10.1007/s002270050155.
Birkeland C, Lucas JS. 1990.Acanthaster planci: major management problem of coral reefs. Boca Raton: CRC Press.
Black K, Moran P, Burrage D, Death G. 1995.Association of low-frequency currents and crown-of-thorns starfish outbreaks.Marine Ecology Progress Series125:185–194 DOI 10.3354/meps125185.
Brodie J, Fabricius K, De’ath G, Okaji K. 2005.Are increased nutrient inputs responsible for more outbreaks of crown-of-thorns starfish? An appraisal of the evidence.Marine Pollution Bulletin51:266–278DOI 10.1016/j.marpolbul.2004.10.035.
Burdick D, Brown V, Asher J, Caballes C, Gawel M, Goldman L, Hall A, Kenyon J, Leberer T, Lundblad E, McIlwain J, Miller J, Minton D, Nadon M, Pioppi N, Raymundo L, Richards B, Schroeder R, Schupp P, Smith E, Zgliczynski B. 2008.
Caballes CF, Pratchett MS. 2014. Reproductive biology and early life history of the crown-of-thorns starfish,Acanthaster planci. In: Whitmore E, ed.Echinoderms: ecology, habitats, and reproductive biology. New York: Nova Publishers, 102–146.
Chesher RH. 1969.Destruction of the Pacific corals by the sea starAcanthaster planci.
Science165:280–283DOI 10.1126/science.165.3890.280.
Conand C. 1984.Distribution, reproductive cycle and morphometric relationships of
Acanthaster planci(Echinodermata: Asteroidea) in New Caledonia, western tropical Pacific. In:Proceedings of the fifth international echinoderm conference, 499–506.
Dana TF, Newman WA, Fager EW. 1972.Acanthasteraggregations: interpreted as primarily responses to natural phenomena.Pacific Science26:355–372.
De’ath G, Moran P. 1998.Factors affecting the behaviour of crown-of-thorns starfish (Acanthaster planciL.) on the Great Barrier Reef: 2: feeding preferences.Journal of Experimental Marine Biology and Ecology220:107–126
DOI 10.1016/S0022-0981(97)00100-7.
Endean R. 1969.Report on investigations made into aspects of the current Acanthaster planci (crown of thorns) infestations of certain reefs of the Great Barrier Reef. Brisbane: Queensland Department of Primary Industries (Fisheries Branch).
Evanno G, Regnaut S, Goudet J. 2005.Detecting the number of clusters of individ-uals using the software STRUCTURE: a simulation study.Molecular Ecology
14:2611–2620DOI 10.1111/j.1365-294X.2005.02553.x.
Excoffier L, Lischer HEL. 2010.Arlequin suite ver 3.5: a new series of programs to perform population genetics analyses under Linux and Windows.Molecular Ecology Resources10:564–567DOI 10.1111/j.1755-0998.2010.02847.x.
Excoffier L, Smouse PE, Quattro JM. 1992.Analysis of molecular variance inferred from metric distances among DNA haplotypes: application to human mitochondrial DNA restriction data.Genetics131:479–491.
Eytan RI, Hellberg ME. 2010.Nuclear and mitochondrial sequence data reveal and con-ceal different demographic histories and population genetic processes in Caribbean reef fishes.Evolution64:3380–3397DOI 10.1111/j.1558-5646.2010.01071.x.
Fabricius KE, Okaji K, De’ath G. 2010.Three lines of evidence to link outbreaks of the crown-of-thorns seastarAcanthaster plancito the release of larval food limitation.
Coral Reefs29:593–605 DOI 10.1007/s00338-010-0628-z.
Falush D, Stephens M, Pritchard JK. 2003.Inference of population structure using multilocus genotype data: linked loci and correlated allele frequencies.Genetics
164:1567–1587.
Falush D, Stephens M, Pritchard JK. 2007.Inference of population structure using multilocus genotype data: dominant markers and null alleles.Molecular Ecology Notes7:574–578DOI 10.1111/j.1471-8286.2007.01758.x.
Gérard K, Roby C, Chevalier N, Thomassin B, Chenuil A, Feral JP. 2008.Assessment of three mitochondrial loci variability for the crown-of-thorns starfish: a first insight into Acanthaster phylogeography.Comptes Rendus Biologies331:137–143 DOI 10.1016/j.crvi.2007.11.005.
Glynn PW. 1985.El-nino-associated disturbance to coral reefs and post disturbance mortality byAcanthaster-planci.Marine Ecology Progress Series26:295–300 DOI 10.3354/meps026295.
Goudet J. 2001.FSTAT, a program to estimate and test gene diversities and fixation indices (version 2.9.3).Available athttp:// www2.unil.ch/ popgen/ softwares/ fstat.htm.
Haszprunar G, Spies M. 2014.An integrative approach to the taxonomy of the crown-of-thorns starfish species group (Asteroidea:Acanthaster): a review of names and comparison to recent molecular data.Zootaxa3841:271–284
DOI 10.11646/zootaxa.3841.2.6.
Holm S. 1979.A simple sequentially rejective multiple test procedure.Scandinavian Journal of Statistics6:65–70.
Houk P, Bograd S, Van Woesik R. 2007.The transition zone chlorophyll front can trigger Acanthaster planci outbreaks in the Pacific Ocean: historical confirmation.
Journal of Oceanography63:149–154DOI 10.1007/s10872-007-0013-x.
Hubisz MJ, Falush D, Stephens M, Pritchard JK. 2009.Inferring weak population structure with the assistance of sample group information.Molecular Ecology Resources9:1322–1332DOI 10.1111/j.1755-0998.2009.02591.x.
Jombart T, Devillard S, Balloux F. 2010.Discriminant analysis of principal components: a new method for the analysis of genetically structured populations.BMC Genetics
11(1):94.
Kayal M, Vercelloni J, De Loma TL, Bosserelle P, Chancerelle Y, Geoffroy S, Stievenart C, Michonneau F, Penin L, Planes S, Adjeroud M. 2012.Predator crown-of-thorns starfish (Acanthaster planci) outbreak, mass mortality of corals, and cascading effects on reef fish and benthic communities.PLoS ONE7(10):e47363.
Keenan K, McGinnity P, Cross TF, Crozier WW, Prodöhl PA. 2013.diveRsity: an R package for the estimation of population genetics parameters and their associated errors.Methods in Ecology and Evolution4:782–788 DOI 10.1111/2041-210X.12067.
Kool JT, Paris CB, Barber PH, Cowen RK. 2011.Connectivity and the development of population genetic structure in Indo-West Pacific coral reef communities.Global Ecology and Biogeography20:695–706DOI 10.1111/j.1466-8238.2010.00637.x.
Nash WJ, Goddard M, Lucas JS. 1988.Population genetic-studies of the Crown-of-Thorns Starfish, acanthaster-planci(l), in the great barrier-reef region.Coral Reefs
7:11–18DOI 10.1007/BF00301976.
Nishida M, Lucas JS. 1988.Genetic-differences between geographic populations of the Crown-of-Thorns Starfish throughout the pacific region.Marine Biology
98:359–368DOI 10.1007/BF00391112.
Nishikawa A, Katoh M, Sakai K. 2003.Larval settlement rates and gene flow of
O’Reilly P, Canino M, Bailey K, Bentzen P. 2004.Inverse relationship betweenFST
and microsatellite polymorphism in the marine fish, walleye pollock (Theragra chalcogramma): implications for resolving weak population structure.Molecular Ecology 13:1799–1814DOI 10.1111/j.1365-294X.2004.02214.x.
Peijnenburg KTCA, Fauvelot C, Breeuwer JAJ, Menken SBJ. 2006.Spatial and temporal genetic structure of the planktonicSagitta setosa(Chaetognatha) in European seas as revealed by mitochondrial and nuclear DNA markers.Molecular Ecology
15:3319–3338DOI 10.1111/j.1365-294X.2006.03002.x.
Pratchett MS, Caballes CF, Rivera-Posada JA, Sweatman HPA. 2014.Limits to under-standing and managing outbreaks of crown-of-thorns starfish (Acanthasterspp.).
Oceanography and Marine Biology52:133–200DOI 10.1201/b17143-4.
Pritchard JK, Stephens M, Donnelly P. 2000.Inference of population structure using multilocus genotype data.Genetics155:945–959.
Randall RH. 1973.Distribution of corals afterAcanthaster planci(L.) infestation at Tanguisson Point, Guam.Micronesica9:213–222.
Raymond M, Rousset F. 1995.GENEPOP (VERSION-1.2)—population-genetics software for exact tests and ecumenicism.Journal of Heredity86:248–249.
Rice WR. 1989.Analyzing tables of statistical tests.Evolution43(1):223–225.
Rousset F. 2008.GENEPOP’007: a complete re-implementation of the GENEPOP software for Windows and Linux.Molecular Ecology Resources8:103–106 DOI 10.1111/j.1471-8286.2007.01931.x.
Scheltema RS. 1986.Long-distance dispersal by planktonic larvae of shoal-water benthic invertebrates among central pacific islands.Bulletin of Marine Science39:241–256.
Selkoe KA, Toonen RJ. 2006.Microsatellites for ecologists: a practical guide to using and evaluating microsatellite markers.Ecology letters9:615–629
DOI 10.1111/j.1461-0248.2006.00889.x.
Shaw P, Arkhipkin A, Al-Khairulla H. 2004.Genetic structuring of Patagonian toothfish populations in the Southwest Atlantic Ocean: the effect of the Antarctic Polar Front and deep-water troughs as barriers to genetic exchange.Molecular Ecology
13:3293–3303DOI 10.1111/j.1365-294X.2004.02327.x.
Sweatman H. 2008.No-take reserves protect coral reefs from predatory starfish.Current Biology18:R598–R599DOI 10.1016/j.cub.2008.05.033.
Talbot FH, Talbot MS. 1971.The crown-of-thorns starfish (Acanthaster) and the Great Barrier Reef.Endeavour 30:38–42.
Timmers MA, Andrews KR, Bird CE, DeMaintenton MJ, Brainard RE, Toonen RJ. 2011.Widespread dispersal of the crown-of-thorns sea star,Acanthaster planci, across the Hawaiian Archipelago and Johnston Atoll.Journal of Marine Biology2011: 934269DOI 10.1155/2011/934269.
Treml EA, Halpin PN, Urban DL, Pratson LF. 2008.Modeling population connectivity by ocean currents, a graph-theoretic approach for marine conservation.Landscape Ecology 23:19–36DOI 10.1007/s10980-007-9138-y.
Treml EA, Roberts J, Chao Y, Halpin PN, Possingham HP, Riginos C. 2012. Repro-ductive output and duration of the pelagic larval stage determine seascape-wide connectivity of marine populations.Integrative and Comparative Biology52:525–537 DOI 10.1093/icb/ics101.
Treml EA, Roberts J, Halpin PN, Possingham HP, Riginos C. 2015.The emergent geography of biophysical dispersal barriers across the Indo-West Pacific.Diversity and Distribution21:465–476DOI 10.1111/ddi.12307.
Uthicke S, Benzie J. 2003.Gene flow and population history in high dispersal marine invertebrates: mitochondrial DNA analysis ofHolothuria nobilis(Echinodermata: Holothuroidea) populations from the Indo-Pacific.Molecular Ecology 12:2635–2648 DOI 10.1046/j.1365-294X.2003.01954.x.
Van der Meer MH, Hobbs JPA, Jones GP, Van Herwerden L. 2012.Genetic Connectivity among and Self-Replenishment within Island Populations of a Restricted Range Subtropical Reef Fish.PLoS ONE7(11):e49660.
Van Loon EE, Cleary DFR, Fauvelot C. 2007.ARES: software to compare al-lelic richness between uneven samples.Molecular Ecology Notes7:579–582 DOI 10.1111/j.1471-8286.2007.01705.x.
Van Oosterhout C, Weetman D, Hutchinson WF. 2006.Estimation and adjustment of microsatellite null alleles in nonequilibrium populations.Molecular Ecology Notes
6:255–256DOI 10.1111/j.1471-8286.2005.01082.x.
Vogler C, Benzie J, Barber PH, Erdmann MV, Ambariyanto SC, Tenggardjaja K, Gérard K, Wörheide G. 2012.Phylogeography of the crown-of-thorns starfish in the Indian Ocean.PLoS ONE7(8):e43499.
Vogler C, Benzie J, Lessios H, Barber PH, Wörheide G. 2008.A threat to coral reefs multiplied? Four species of crown-of-thorns starfish.Biology Letters4:696–699 DOI 10.1098/rsbl.2008.0454.
Vogler C, Benzie JAH, Tenggardjaja K, Ambariyanto, Barber PH, Wörheide G. 2013.
Phylogeography of the crown-of-thorns starfish: genetic structure within the Pacific species.Coral Reefs32:515–525DOI 10.1007/s00338-012-1003-z.
Wan QH, Wu H, Fujihara T, Fang SG. 2004.Which genetic marker for which conserva-tion genetics issue?Electrophoresis25:2165–2176DOI 10.1002/elps.200305922.
Williams ST, Benzie JAH. 1997.Indo-West Pacific patterns of genetic differentiation in the high-dispersal starfishLinckia laevigata.Molecular Ecology6:559–573 DOI 10.1046/j.1365-294X.1997.00221.x.
Wolanski E, Richmond RH, Davis G, Deleersnijder E, Leben RR. 2003.Eddies around Guam, Mariana Island Group.Continental Shelf Research23:991–1003
DOI 10.1016/S0278-4343(03)00087-6.
Wood S, Paris CB, Ridgwell A, Hendy EJ. 2014.Modelling dispersal and connectivity of broadcast spawning corals at the global scale.Global Ecology and Biogeography
Yasuda N, Nagai S, Hamaguchi M, Lian CL, Nadaoka K. 2006.Development of
microsatellite markers for the crown-of-thorns starfish Acanthaster planci.Molecular Ecology Notes6:141–143DOI 10.1111/j.1471-8286.2005.01168.x.
Yasuda N, Nagai S, Hamaguchi M, Nadaoka K. 2007.Seven new microsatellite markers for crown-of-thorns starfish Acanthaster planci.Plankton and Benthos Research
2:103–106DOI 10.3800/pbr.2.103.
Yasuda N, Nagai S, Hamaguchi M, Okaji K, Gérard K, Nadaoka K. 2009.Gene flow ofAcanthaster planci(L.) in relation to ocean currents revealed by microsatellite analysis.Molecular Ecology 18:1574–1590DOI 10.1111/j.1365-294X.2009.04133.x.