COMPANIES
Maciej Pieńkowski PhD student
Wrocław University of Economics Komandorska 118/120, Wrocław, Poland
A B S T R A C T K E Y W O R D S
A R T I C L E I N F O Waste measurement,
lean manufacturing, lean metrics
Received 07 June 2014 Accepted 17 June 2014
Available online1 December 2014 The paper is dedicated to answer the problem of
measuring waste in companies, which are
implementing Lean Manufacturing concept. Lack of complex identification, quantification an visualization of waste significantly impedes Lean transformation efforts. This problem can be solved by a careful investigation of Muda, Muri and Mura, which represent the essence of waste in the Toyota Production System. Measuring them facilitates complete and permanent elimination of waste in processes. The paper introduces a suggestion of methodology, which should enable company to quantify and visualize waste at a shop floor level.
________________________________
1. Introduction
Lean Management, originated from the Toyota Production System, is nowadays one of the most dominating management philosophies, both in industrial and service environment. One of the reasons for such a success is its simplicity. The whole concept is based on a common sense idea of so called “waste”. Removing it is the very essence of Lean Management.
Despite seemingly simple principles, eliminating waste is not an easy task. Many companies, even those with many years of Lean experience, still struggle to clear the waste out of their processes. It turns out, that the most difficult part is not removing waste itself, but identifying and highlighting it, which should precede the process of elimination. This issues can be overcome by implementing a proper waste measurement system.
Complex waste identification, which facilitates elimination of root causes of waste, not only symptoms. Putting emphasis only on visible issues, leads to the situation, where achieved improvements are temporary and the problems are back over time.
Using quantified waste metrics, which allow proper control of a process. Calculating them helps with monitoring and highlighting all problems and defects within a process. It also enables company to compare the results from different areas.
Developing response standards for all detected problems, which supports and accelerates decision making process. Properly introduced standards should ensure careful analysis of a root cause and quick implementation of mistake-proofing solutions.
Failure to meet this conditions drastically decreases company’s ability to eliminate waste. The goal of this paper is to present solutions, which will help companies to develop a complex, quantified and standardized waste measurement system. According to the points above, the first condition to achieve such a system is to identify what the actual waste is.
2. COMPLEX WASTE IDENTIFICATION 2.1. What is waste
In relation to Lean Manufacturing, waste is often described as Muda - an activity, which does not add value to the product. In other words, it is every action done by a company, which a customer is not willing to pay for. For many Lean practitioner, this simple definition is the only beacon in the battle against waste. However, it is often forgotten, that according to the Toyota original concept, Muda does not cover the whole essence of waste, as it describes only what is visible on the surface of processes. To see the bigger picture, it is necessary to look deeper into a value stream.
Under Toyota theory, waste is recognized as all factors, which prevent a company from achieving a perfectly efficient production system. In Lean Manufacturing, this perfection has a form of the Just-in-Time – one of two pillars of the Toyota Production System. Just-in-Time is a concept based on making only what is needed, when it is needed, and in the amount needed. The ultimate goal of this system is therefore to ensure that the right product will be produced by the exactly right amount of man, material and machines and will be deliver to the customer at the right time. Everything, which stands on a way to accomplish it, is considered as waste. This broader approach makes it possible to identify all occurrences, which has negative affect on a company.1
Toyota recognizes three main types of waste - Mura (eng. unevenness), Muri
(eng. overburden) and already mentioned Muda (eng. waste). All three Mu’s are strongly
connected with each other and together define Japanese understanding of waste. How do these seemingly separated terms form a coherent theory, which strongly contributed
to the success of the Toyota Production System? Let’s take a closer look at each of
them.
2.2. The three types of waste – Muda, Mura, Mura 2.2.1 Muda
Muda means waste or uselessness. As mentioned in the previous chapter, Muda refers to waste of unnecessary activities. This type of waste is characterized by using time, money and resources, while not adding any value to the customer. The goal of identifying Muda is to recognize which steps are necessary to the process and which need to be reduced or eliminated. There are seven, tradictional types of Muda: 2
1. Overproduction - producing ahead of what’s actually needed by the next process or customer. The worst form of Muda because it contributes to the other six.
2. Waiting - operators standing idle as machines cycle, equipment fails, needed parts fail to arrive, etc.
3. Conveyance - moving parts and products unnecessarily, such as from a processing step to a warehouse to a subsequent processing step when the second step instead could be located immediately adjacent to the first step. 4. Overprocessing - performing unnecessary or incorrect processing, typically
from poor tool or product design.
5. Inventory – handling unnecessary stocks, which results other types of Muda like waiting, correcting and overprocessing.
6. Motion – making movements that are wasteful or unnecessary, such as looking for parts, tools, documents, etc.
7. Correction – inspecting production to find defects, rework of defected materials.
Waste in a form of Muda directly disturbs implementation of the Just-in-Time system. Muda makes it impossible to reach the goal of using only these resources, which are absolutely needed. Due to wasteful activities, company unnecessarily loses material and energy of both man and machines. Muda causes also losses in time, aggravating deliverance of product at the right time. Therefore, it is safe to say, that non-value added activities are one of the biggest sources (although not the only ones) of waste in Lean Management.
2.2.2 Muri
Muri means overburden or unreasonableness. It is associated with waste of overloading equipment, facility or people resources beyond its capacity. The overload puts employees and machines into unnecessary stress, reducing their ability to perform. Muri can be also identified as the exact opposite of overburden – the underutilization of man and equipment, which causes long periods of idle time.
There are three main causes of Muri:
1. Poorly organized workstation – improperly designed lay-out, which forces employees to put much more effort into ordinary activities than necessary.
2. Lack of standardized work – problems with sustaining 5S, unclear instructions and poor communication, which lead to overburden of employees. Similarly, Muri of equipment can be created by lack of maintenance standards and inappropriate utilization.
3. Mura - variation in production volume, which will be describe in next paragraph. This excessive stress of people and machines may result in defects and delays of the process. Muri is also common cause of breakdown when it comes to machines, and absenteeism when it comes to people. Therefore, overburden hinders company from achieving goals of the Just-in-Time system by preventing man and machines from operating at 100% of its capabilities.
Muri of underutilization of man and equipment has also negative consequences for a company. Similarly as for overburden, this kind of waste creates loses in potential capabilities of people and machines. By causing long periods of idle time, all resources are not properly utilized.
2.2.3 Mura
Mura means variation or unevenness. It refers to waste of unevenness in production volume. It may take two different forms:
• Variation in production scheduling,
• Uneven production workload and pace of work.
One of main causes of Mura is the batch logic, represented by many companies. The philosophy of producing in big batches aims at maximizing utilization of key resources and minimizing cost per unit. It creates however problems with flexibility, hindering
company’s ability to react to constant changes of customer demand.
“Batch organizations”, in order to protect themselves from the variation in demand,
often build a buffer stock, producing more units than necessary. By trying to compensate the variation, they unintentionally increase an actual fluctuation in a production volume. As a consequence, the further a process is from a root of the fluctuation, the bigger unevenness in production volume. This phenomenon is called
the “bull-whip” effect – a situation where a small variation in demand at the end of the value stream (customer) leads to high changes in production volume in the earlier stages (production processes).
Although Mura is frequently seen in many companies, this type of waste is often ignored by management teams. It is a big mistake, because variation in production volume can be a common cause of both Muri and Muda:
Muda – Mura is strongly connected with Muda of overproduction. In order to protect themselves from variation in scheduling, companies are forced to produce more than necessary, creating high levels of inventory. This in turn creates all other types of Muda.
Uncontrolled Mura is responsible for many other problems with achieving the Just-in-Time system. Only with stable and predictable production volume it is possible to implement such a key principles of Just-in-Time as continuous flow and production leveling. Elimination of Mura is therefore one of the biggest challenges for Lean organizations.
2.3 The power of three Mu’s
According to Taiichi Ohno, the creator of the Toyota Production System, there is one, straightforward goal of the system – an absolute elimination of waste. If only understood properly, this simple sentence carries all information required to grasp the essence of the Lean philosophy. The key here is to recognize waste not only as Muda, but also as Mura and Muri. Exactly this is the power of the 3 Mu’s, understanding all three of them enables us to fully understand the principles of the TPS and implement the Just-in-Time system. Complex identification of Muda, Mura and Muri is therefore necessary to permanently eliminate waste form processes. However, to achieve it, it is needed to grasp a subtle co-relation between the 3 Mu’s.
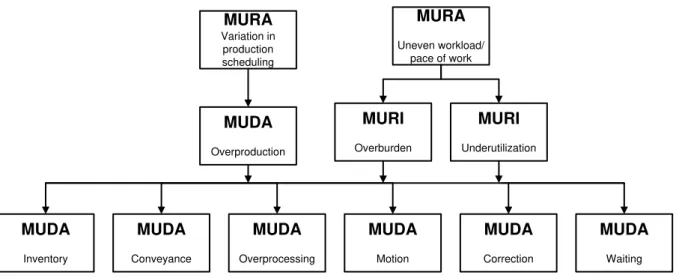
All three types of waste are connected with each other. This connection can be described as a chain of causes and effects, where Mura creates Muri and two of them together create Muda (Fig. 1.). Simply stated, variation in production volume forces company to alternate overloading and underutilizing its resources, creating Muri and overproduction. This in turn leads to downtime, mistakes, backflows and waiting time causing other types of Muda. Therefore, Mura and Muri are the root causes of Muda, creating more non-value added activities and undercutting previous efforts to eliminate waste.
MURA
Variation in production scheduling
MURA
Uneven workload/ pace of work
MUDA
Overproduction
MURI
Overburden
MURI
Underutilization
MUDA
Conveyance
MUDA
Inventory
MUDA
Overprocessing
MUDA
Correction
MUDA
Motion
MUDA
Waiting
3. QUANTIFIED WASTE METRICS 3.1. What is Jidoka
Jidoka (which can be translated as “automation with a human touch”) is the ability
to automatically stop a machine when it detects any abnormality. It means that, if a quality / equipment problem arise, the machine detects the problem on its own and stops, preventing defective products from being produced. As a result, only products with satisfying quality standards will be passed on to the following processes.3
There is an inseparable connection between Just-in-Time and Jidoka. To explain it, Taiichi Ohno used to make a football team analogy . Just-in-Time is the effective linkage of various skills of the team members. The responsibility of the coach is to make the whole system flow, so that they could score a goal. At the same time, Jidoka is used to identify abnormalities against the standard work of the system. The role of the coach is here to find players, which show temporary weaknesses and then immediately react with corrective actions. The main goal of the Just-in-Time is therefore to build an efficiently working production system, while Jidoka deals with all abnormalities to ensure that the system is properly working.
It is safe to say, that the concept of Jidoka is inherent to the Lean philosophy. Building quality into the process, preventing defects from occurring and highlighting all potential mistakes became common practice in Lean companies. Many of them forget however, that the waste measurement system should also be built into the processes, as part of Jidoka system. To achieve it, it is necessary to not only to identify all types of waste, as it was describe in the previous chapter, but also to quantify it using proper waste metrics.
3.2. Importance of the quantified waste metrics
Properly designed waste metrics are the basis for efficiently working waste measurement system. Quantifying waste enables company to quickly identify excessively high levels of Muda, Mura and Muri and conduct corrective actions. Creating proper waste indicators supports decision making process for team leaders and company management.
The results obtained from waste measurements make it possible to compare waste levels between different workstations or value streams. It provides company with information, which are area is a leading one, allowing others to copy their solutions. Learning from each other and adopting best practices from different fields is an important principle of the continuous improvement philosophy.
Furthermore, using quantified metrics makes it easier to control and manage Lean transformation. By calculating current and assigning desired values of Muda, Mura
or Muri, it is possible to manage company’s efforts to eliminate waste and implement the
Just-In-Time system. Values of the 3 Mu’s metrics can be a great discriminant of
company’s Lean maturity.
The following sections present a suggestion of waste metrics, which can be used to support waste elimination efforts. The metrics are divided into two categories: passive waste (which refers to waste in standards) and active waste (which refers to waste in action). The differentiation is necessary in order to distinguish waste created in the planning and production phases. Such an approach should provide a complex way to measure and quantify Muda, Muri and Mura in processes.
3.3 Measuring the passive waste
The passive waste can be described as losses, which are caused by a wasteful work organization. This includes poorly designed workstations, inaccurate operational standards, lack of 5S system or unreasonable distribution of workload. Therefore, the passive waste indicates waste at a management level.
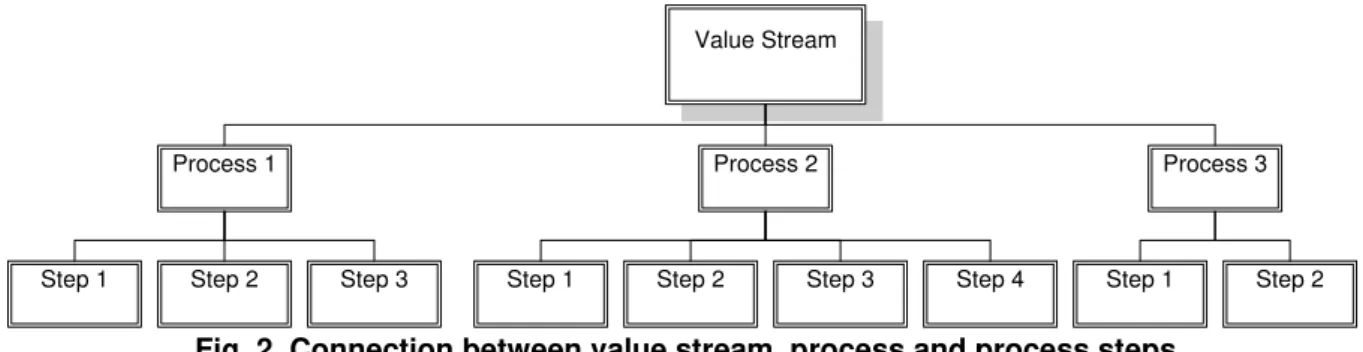
Before the passive waste metrics can be introduced, it is important to distinguish the difference terms like value stream, process and process step. The correlation between all three of this is illustrated in the figure 2., where value stream consists of processes and each process consists of steps.
Value Stream
Process 1 Process 2 Process 3
Step 1 Step 2 Step 3 Step 1 Step 2 Step 3 Step 4 Step 1 Step 2
Fig. 2. Connection between value stream, process and process steps
Based on this selection, the three different scope levels in waste calculation will be distinguished during further calculations:
1. Operator level – analyzing waste in all process steps performed by one operator. 2. Process level – analyzing waste in all process steps performed, by one or more operators, which the single process consist of. If the process consist of only one operator, the process level is the same as the operator level.
3. Value stream level – analyzing waste in all processes, which the value stream consist of.
The passive waste measurement should be conducted for a chosen value stream. It requires collecting data at a high level of detail, as it will investigate not only all processes, but also all steps which they consist of. Because the data collecting process can be highly time consuming, it should be performed periodically, after significant changes or improvements in the process. The following information are required to calculate the passive waste metrics:
NVA - time of Non-Value Added steps of each process, where Non-Value Added steps are understood as Muda described in the previous chapter. T/T - Takt Time of a value stream, where Takt Time is understood as the
available production time divided by customer demand.
To collect information above, it is suggested to use the Time Observation Sheet. It is a tool commonly used to develop Standard Work and gather data regarding time needed to perform processes. To accurately collect all required information, it is necessary to make careful observations and register time needed for each step of each process. The observer should at the same time identify which of the steps are non-value added. Gathered data will enable us to calculate Muda, Mura and Muri metrics.
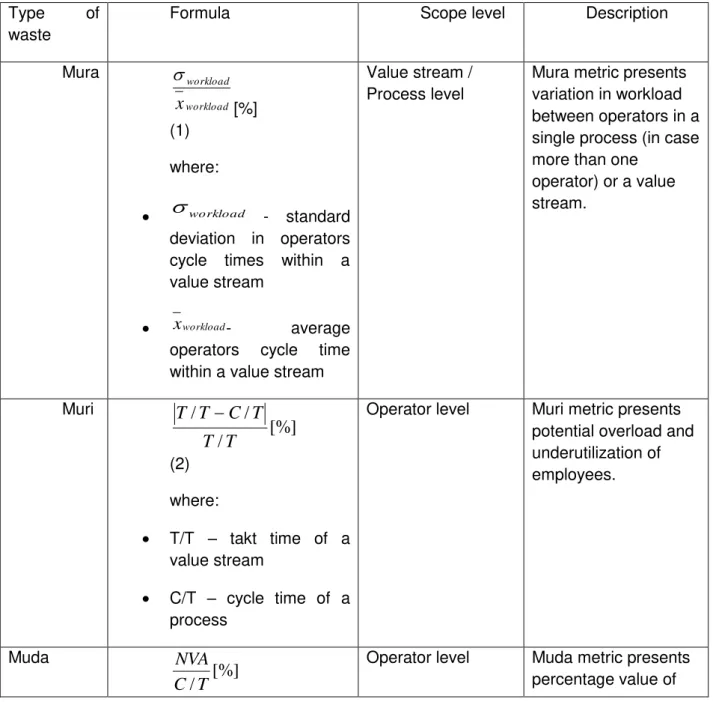
Table 1 presents a suggestion of formulas which can be used to calculate Mura, Muri and Muda passive waste metrics, as well as short descriptions of each of them.
Table 1. The 3 Mu’s passive waste metrics Type of
waste
Formula Scope level Description
Mura workload workload x [%] (1) where:
workload - standard deviation in operators cycle times within a value stream xworkload- average operators cycle time within a value stream
Value stream / Process level
Mura metric presents variation in workload between operators in a single process (in case more than one
operator) or a value stream. Muri [%] / / / T T T C T T (2) where:
T/T – takt time of a value stream
C/T – cycle time of a process
Operator level Muri metric presents potential overload and underutilization of employees. Muda [%] /T C
(3)
where:
NVA – time of non-value added activities
C/T – cycle time of a process
non-value added activities performed by each operator.
The 3 Mu’s metrics identify waste hidden in poorly assigned workload and work standards. By quantification of Mura, Muri and Muda it is possible to verify current state problems, set new goals and monitor the progression. In order to reduce the value of each metric, company should focus its efforts on leveling the workload, adjusting it to the takt time and reducing non-value added activities.
3.4. Measuring the active waste
The active waste refers to Muda, Mura and Muri caused by wasteful performance of the actual work. Failures to meet the standards, unexpected downtime and strong fluctuation in production volume are common examples of the active waste. The key to battle it, is quick and accurate identification of occurred problems, which can be done by applying proper metrics.
The active waste needs to be measured more often than the passive one. A detection of this kind of waste should be built into a process. This can be achieved by a continuous measurement of waste while performing work. It will enable company to quickly identify all abnormalities and take a proper corrective actions. The active waste measurements should be conducted at a process level. The following information are needed to calculate the metrics:
DL - daily Direct Labor Time of each process, where Direct Labor Time is understood as the actual time spent on performing value added and non-value added process steps.
S/T – Standard time of each process, where Standard Time is understood as expected time needed to finish particular production process.
A/T – daily Available Time of each process, where Available Time is calculated as number of shifts multiplied by 8 hours minus planned breaks and downtime. D/T – daily unplanned Downtime of each process.
R/T – daily Rework time.
WIP - daily Work-In-Process in a process.
SWIP – standard daily Work-In-Process in a process.
Due to big amount of needed data and high collection frequency, it would be quite difficult to gather this information only with pen and paper. Fortunately, the basic ERP systems allow us to easily collect all information listed above. Once the data is
gathered, it is possible to calculate the 3 Mu’s metrics. Table 2 presents a suggestion of formulas, which can be used to calculate the active waste metrics.
Table 2. The 3 Mu’s active waste metrics Type of
waste
Formula Scope
level Description Mura [%] DL DL x (4) where: DL
- standard deviation in dailydirect labor time within a week
DL
x - average daily direct labor
time within a week
Process
level
Mura metric presents a variation in
production volume represented by
direct labor time. Similarly as for the
passive waste, to indicate the metric, it
is necessary to use a coefficient of
variation. Muri [%] / / / T A T S T A (5) where:
A/T – daily available time
S/T – standard time
Process
level
Muri metric presents the actual
overload or underutilization of
employees on each process.
Muda [%] SWIP WIP SWIP (6) where:
SWIP – standard inventory in a
process
WIP – actual daily inventory in a
process
Process
level
Flow Muda metric. It measures how
effectively material flow through the
process. [%] / / T A T D
(7) where:
D/T – daily downtime
A/T – daily available time
Process
level
Availability Muda metric. It shows a
percent of time wasted by unexpected
breakdowns, absenteeism and
changeovers. It is calculated by
dividing a daily downtime by daily
[%] / / T A DL T A (8) where:
A/T – daily available time
DL – direct labor time
Process
level
Performance Muda metric. It shows a
percent of time wasted on
non-production activities. [%] / DL T S DL (9) where:
S/T – standard time
DL – direct labor time
Process
level
Efficiency Muda metric. It shows a
percent of time wasted by low
efficiency of machine or man.
[%] / / T A T R
(10) where:
R/T – daily time spent on rework
A/T – daily available time
Process
level
Rework Muda metric. It shows a
percent of time wasted on rework.
As seen in the table, all active waste metrics can be calculated based on seven simple information items presented above. Mura metric should be calculated weekly, based on the data form the previous week, whereas Muri and Muda metrics should be calculated daily.
Muda metrics were divided into five types, as this kind of waste is the most common on a shop floor. All of the metrics enable us to identify waste, which occur during the production process. Thanks to their quantifiable nature, it is possible to compere results from different processes, control abnormalities, monitor trends and improvement.
Although proper identification and quantification of waste is very important to the efficiently working waste measurement system, it could not be completed if not for one more aspect – response standards. Without it, the quantified metrics of the 3
Mu’s will be nothing more than useless data. That is why, abnormalities response
standards are the third and last pillar of the reliable waste measurement system.
4. RESPONSE STANDARDS
4.1 Building a response standard
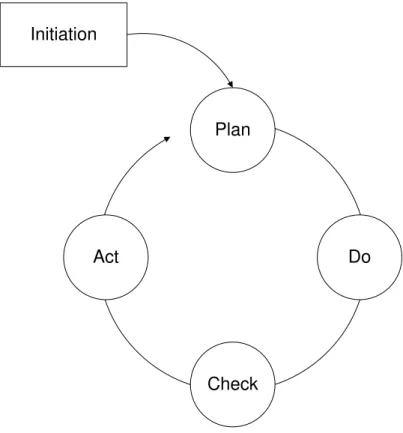
The process of responding to waste metrics needs to be clearly documented and standardized. In order to get the best use out of the measurement system, it is necessary to develop a proper standard and constantly follow it. The suggestion of such a standard is presented on the figure 3. The problem solving process should be triggered by a clearly defined factor. This in turn, should initiate the PDCA cycle. All five steps of the response standard are described below with more details.
Initiation
Plan
Do
Check Act
Fig. 3. The response process standard
•Initiation
The first step of the response standard is to determine initiators of the improvement or problem solving process. The most common way of setting the initiation points is defining the borderline levels of each controlled metric. Every time the waste metric value is below or above the accepted level, it should immediately trigger the first step of the PDCA cycle –“Plan”.
•Plan
The goal of this step is to conduct a careful analysis of the problem which initiated the PDCA cycle and create plan for countermeasures. This phase should start with listing all potential reasons of the problem and continue with finding the root cause. Once the root cause is found, an action plan should be prepared to ensure elimination of it. During this step the tools like 5xWhy, Ishikawa Diagram or Brainstorming can be used.
The action plan should be implemented as fast as possible. Right tools and equipment needs to be provided and implementation leader should be designated to ensure timely and completed implementation. It is important to supervise the completion of the plan to make sure that arrangements are being followed.
•Check
The main goal for the “Check” phase is to verifying the performance of the previous step by checking the effectiveness of used countermeasures. The values of waste metrics before and after should be compared in order to verify if they are back on a desired level.
• Act
After a lesson learned from the previous step, the “Act” step should ensure that the corrective action are taken. In order to do so, proper standards should be introduced, which ensure permanent elimination of a problem. The standards should be constantly monitored and improved if needed.
4.2. Waste visualization as a way to support response actions
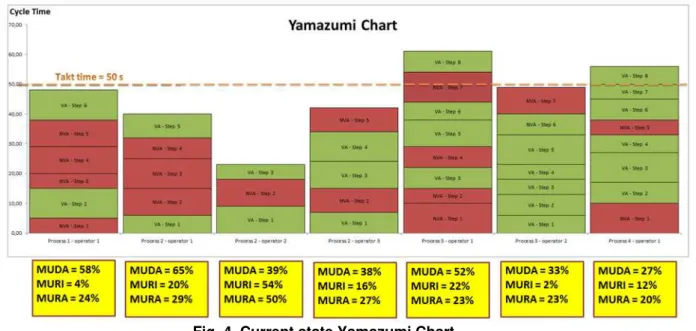
The response standards are frequently supported by various waste visualization techniques. Highlighting Muda, Muri and Mura current and desired values can often accelerate the initiation of the response proces and help with managing improvement actions. Therefore, the visualization tools should be a vital part of response standards, effectively supporting the PDCA cycle. Below a tool to visualize the passive waste is presented – the Yamazumi chart.
The Yamazumi chart is a Lean Management tool, which can be used to
visualize the passive waste metrics. Yamazumi is Japanese for “pile” or “stack”,
whereas Yamazumi chart is a name for a tool used to highlight workload within or between processes. It consists of vertical bars to represent the total amount of work each operator must do compared to takt time. The vertical bar for each operator is built by smaller bars representing individual work steps, with the height of each step proportional to the amount of time required (Lean glossary).
The Yamazumi chart is used mostly to balance processes and create continuous flow, but is also a perfect tool to visualize passive waste metrics of Mura, Muri and Muda:
Mura – Yamazumi chart visualizes variation in workload in a single process or a whole value stream.
Muri – Yamazumi chart visualizes the potential overload and underutilization of each operator.
Fig. 4. Current state Yamazumi Chart
Analysis of the current state Yamazumi should initiate the response process
for the 3 Mu’s passive waste metrics. Yamazumi chart highlights all abnormalities found in processes which should trigger the PDCA cycle. The first phase of the cycle
– “Plan”, needs to put emphasis of creating a future state Yamazumi charts, with
desired values of Muda, Mura and Muri. This should go hand in hand with preparing
an action plan to achieve defined goals. During the “Do” step of the PDCA cycle, the action plan needs to be implemented. “Check” phase should verify, if the future state
goals are achieved. The last step of the cycle – “Act” should introduce corrective actions and create standards to secure all successful improvements. An example of a future state Yamazumi is presented in Fig. 5.
Fig. 5. Future state Yamazumi Chart
Following the waste response standards requires strong discipline from employees, especially management. It is their role to regularly monitor the waste metrics values, initiate analysis and ensure the implementation of corrective actions. This activity should become part of their daily routine.
Thanks to the consequence and regularity of the management, a culture of problem solving will grow within employees. It will prevent the situation where detected abnormalities are ignored or overlooked. Following the response standards is a true key to continuous improvement within a company.
5. CONCLUSIONS
The issue of waste is a cornerstone of the Lean philosophy, as it is inseparably connected with the two pillars of the Toyota Production System. First of them – Just-in-Time, can be achieved only by a complex elimination of the three types of waste: Mura, Muri and Muda. This in turn, will be possible when a proper waste measurement system is built into processes, as a part of Jidoka concept.
The paper introduced a suggestion of a waste measurement system, as a solutions to difficulties, which most companies struggle to overcome: identifying entire waste, quantifying it and using gain knowledge to improve. The paper stresses the significance of complex waste analysis, which contains not only Muda, but also
Mura and Muri. Presented formulas for the 3 Mu’s metrics calculations can be useful
in many companies and provide them with important information about their processes.
The presented waste measurement system, if properly applied, may bring plenty of benefits to a company. It is necessary however to be aware about its limitations. The system is designed to use mostly in companies with some lean experience. It will work properly only when standard work is developed and it is possible to calculate takt and cycle times. Additionally, it is worth noticing, that application of the system requires much bigger effort in a high variety/low volume environment.
Nonetheless, the quantified waste measurement system, based on principles presented in the paper, has the potential to bring plenty of benefits and contribute to
significant reduction of the 3 Mu’s. It provides company with reliable indicators of
problems within processes, quickly signals any abnormalities and creates environment promoting continuous improvement. This leads to conclusion, that waste measurement is a key component needed to achieve a successful Lean
implementation. After all, as Lord Kelvin’s famous quote says: "If you can not
measure it, you can not improve it."
REFERENCE
Liker J. K. The Toyota Way - 14 Management Principles from the World´s Greatest Manufacturer. McGraw-Hill: New York; 2004.
Marchwinski C., Shook J. Lean Lexicon: A Graphical Glossary for Lean Thinkers. Lean Enterprise Institute; 2004
McManus W. Muda, Muri, Mura – Toyota Production System guide, available at: http://blog.toyota.co.uk/muda-muri-mura-toyota-production-system#.U5Itmvl_tcg [Retrieved: 25.05.2014]
Ohno T. Toyota Production System, Beyond Large-scale Production. Productivity Press: Portland; 1995.
Toyota Production System, available at:
http://www.toyota-global.com/company/vision_philosophy/toyota_production_system/ [Retrieved: 25.05.2014]
Womack J. P., Jones D. T. Lean Thinking – Banish Waste and Create Wealth in Your Corporation, 2nd ed. Free Press: New York; 2003.
![Table 2. The 3 Mu’s active waste metrics Type of waste Formula Scope level Description Mura [%] DL DLx (4) where:](https://thumb-eu.123doks.com/thumbv2/123dok_br/18150078.327482/10.892.100.811.281.1146/table-active-waste-metrics-type-formula-scope-description.webp)