Performance of Different Analytical Software
Packages in Quantification of DNA
Methylation by Pyrosequencing
Chiara Grasso1, Morena Trevisan1, Valentina Fiano1, Valentina Tarallo1, Laura De Marco1,2, Carlotta Sacerdote2, Lorenzo Richiardi1, Franco Merletti1,2, Anna Gillio-Tos1*
1Cancer Epidemiology Unit–C.E.R.M.S, Department of Medical Sciences, University of Turin, Turin, Italy,
2Cancer Epidemiology Unit, Department of Medical Sciences, City of Health and Science Hospital, Turin, Italy
*gilliotos.demarco@cpo.it
Abstract
Background
Pyrosequencing has emerged as an alternative method of nucleic acid sequencing, well suited for many applications which aim to characterize single nucleotide polymorphisms, mutations, microbial types and CpG methylation in the target DNA. The commercially avail-able pyrosequencing systems can harbor two different types of software which allow analy-sis in AQ or CpG mode, respectively, both widely employed for DNA methylation analyanaly-sis.
Objective
Aim of the study was to assess the performance for DNA methylation analysis at CpG sites of the two pyrosequencing software which allow analysis in AQ or CpG mode, respectively. Despite CpG mode having been specifically generated for CpG methylation quantification, many investigations on this topic have been carried out with AQ mode. As proof of equiva-lent performance of the two software for this type of analysis is not available, the focus of this paper was to evaluate if the two modes currently used for CpG methylation assessment by pyrosequencing may give overlapping results.
Methods
We compared the performance of the two software in quantifying DNA methylation in the promoter of selected genes (GSTP1, MGMT, LINE-1) by testing two case series which include DNA from paraffin embedded prostate cancer tissues (PC study, N = 36) and DNA from blood fractions of healthy people (DD study, N = 28), respectively.
Results
We found discrepancy in the two pyrosequencing software-based quality assignment of DNA methylation assays. Compared to the software for analysis in the AQ mode, less per-missive criteria are supported by the Pyro Q-CpG software, which enables analysis in CpG
a11111
OPEN ACCESS
Citation:Grasso C, Trevisan M, Fiano V, Tarallo V, De Marco L, Sacerdote C, et al. (2016) Performance of Different Analytical Software Packages in Quantification of DNA Methylation by Pyrosequencing. PLoS ONE 11(3): e0150483. doi:10.1371/journal.pone.0150483
Editor:Hiromu Suzuki, Sapporo Medical University, JAPAN
Received:October 16, 2015
Accepted:February 14, 2016
Published:March 2, 2016
Copyright:© 2016 Grasso et al. This is an open access article distributed under the terms of the Creative Commons Attribution License, which permits unrestricted use, distribution, and reproduction in any medium, provided the original author and source are credited.
Data Availability Statement:All relevant data are within the paper and its Supporting Information files.
Funding:The study was supported by the Compagnia di San Paolo/FIRMS, the World Cancer Research Fund, the Piedmont Region and the Italian Association for Cancer Research. There was no additional external funding received for this study.
mode. CpG mode warns the operators about potential unsatisfactory performance of the assay and ensures a more accurate quantitative evaluation of DNA methylation at CpG sites.
Conclusion
The implementation of CpG mode is strongly advisable in order to improve the reliability of the methylation analysis results achievable by pyrosequencing.
Introduction
DNA methylation is an epigenetic modification involved in the regulation of several biological processes. Methylation of nucleotide bases may lead to N6-methyladenine (6mA), N4-methyl-cytosine (4mC), and 5-methylN4-methyl-cytosine (5mC). While 6mA and 4mC are restricted to prokary-otes and certain eukaryprokary-otes, 5mC is the predominant epigenetic modification in eukaryotic DNA.
In healthy mature mammalian cells DNA methylation mainly involves a Cytosine when it is followed by a Guanine (CpG dinucleotides or CpG sites) [1–3]. Most of the mammalian genes contain CpGs clustered in short regions called CpG Islands and located in the promoter, where methylation may drive silencing of the gene. Non-CpG methylation may occur within some immature type of cells (stem cells) at specific stages during development or in some cell tissues at low proliferative rate (brain, oocytes) [4]. Its functional significance in the mammalian genome is poorly understood and the mechanism is studied at a lesser extent. On the contrary dysregulations in the physiological process of CpG methylation are known leading to abnormal silencing or activation of genes, with potential alteration in cell cycle control and disease onset [3]. The most relevant pathological outcome of aberrant CpG methylation is cancer, thus many efforts have been made in recent decades to identify genes affected by aberrant DNA methylation at CpG sites associated with early carcinogenesis. The analysis of human gene-spe-cific DNA methylation can be performed under a variety of molecular protocols following sodium bisulfite modification of the genomic DNA. Sodium bisulfite treatment deaminates the unmethylated cytosines to uracil whereas leaves unaltered the methylated cytosines [5]. There-fore methylated and unmethylated DNA sequences become distinguishable using primer/ probe specific PCR, microarray or sequencing mediated methodologies. Several of these meth-ods are expensive, time consuming, not quantitative, or limited to the measurement of the methylation status of only one or very few CpG sites [6,7].
amplification products. The methylation detection limit at individual CpG sites is approxi-mately 5% [9].
Pyrosequencing is a suitable methodology for the analysis of short DNA sequences such as those extracted from paraffin-embedded specimens. The pyrosequencing technology benefits of ease of its implementation, quantitative nature of the results, ability to differentially identify methylated positions in close proximity. Moreover a low amount (10 ng) of bisulfite-treated DNA is requested to obtain high reproducibility and to avoid random amplification [13]. Among the commercially available pyrosequencing systems, two models are used for methyla-tion analyses of candidate genes: PyroMark Q96 and PyroMark Q24 (both purchased by Qia-gen, Hilden, Germany). They both carry software for analysis in AQ (Allele Quantification) mode, originally generated for SNP and mutational analysis, and they mainly differ for the number of testable samples in a run, 96 or 24 respectively. An integrated software was created for methylation analyses in CpG mode (Pyro Q-CpG™software v. 1.0.9 and upgrades, Qiagen), that in the latter system of more recent generation is present by default, while in the former has to be implemented. However,also the software which allows analysis in AQ (Allele Quantifica-tion) mode has been recommended for CpG methylation analysis [14,15] and has been widely employed for this purpose. Only since 2007 some reports declared the use of the Pyro Q-CpG™
software [16–23]. Several investigations on CpG methylation also recently published have been performed with AQ mode instead of CpG mode, although proof of equivalent performance of the two software for this purpose is currently not available.
The present study aims to compare the performance in the quantification of CpG methyla-tion in human samples of the two software which allow analyses in CpG mode and in AQ mode respectively, to evaluate if they may give overlapping results
Materials and Methods
Study samples
To compare the performance of the two software for methylation analysis in CpG or in AQ mode onto two PyroMark Q systems two sets of DNA samples were used, already collected in the frame of broader studies with their own specific aims approved by the local Ethical Com-mittee of the San Giovanni Battista Hospital—CTO/CRF/Maria Adelaide Hospital of Turin. Patient record and information were anonymized and de-identified prior to analysis. The first set included 36 DNA samples obtained from paraffin embedded prostate cancer tissues of patients enrolled in a study of association between gene specific methylation and prostate can-cer mortality, thereafter named“PC study”[24]. This sample series was tested for methylation status in the promoter of GSTP1 (glutathione S-transferase-pi 1) gene.
The second set included 28 DNA samples obtained from stored buffy coat of healthy volun-taries involved in a study of association between diet and DNA damage in heavy smokers, hereafter named“DD study”[25]. This sample series was tested for methylation status in the promoter of MGMT (O-6-methylguanine-DNA methyltransferase) and LINE-1 (long inter-spersed nuclear element type-1).
DNA extraction and sodium bisulfite treatment
For the case series including stored blood fractions from“DD study”, DNA was obtained from 100μl aliquots of buffy coat through QIAamp DNA Blood Mini Kit (Qiagen) according to the manufacturer’s instructions.
All genomic DNA samples, as well as synthetic controls for methylated and unmethylated status, underwent bisulfite modification using the Epitect Bisulfite Kit (Qiagen).
Pyrosequencing
Pyrosequencing assays were performed for all the study samples both on a PyroMark Q24 MDx and on a PyroMarkQ96 ID using PyroMark Gold reagents (Qiagen). Primers for GSTP1, targeting 4 CpGs in the gene promoter, were generated according to PyroMark Assay Design software version 2.0 (Qiagen). Primers used for the assay of LINE-1, targeting 6 CpGs in the gene promoter, were chosen according to the literature [26], as well as those for MGMT, target-ing 6 CpGs in the gene promoter [27]. Primer sequences are listed inTable 1.
PCR reactions were performed in a total volume of 35μl containing 1X buffer (KCl), 2mM MgCl2, 200μM dNTPs, 0.5μM of each primer, 1.75U Taq polymerase and 6μl of bisulfte mod-ified DNA with the following cycling profile: 95°C for 1 min followed by 45 cycles of denatur-ation at 95°C for 1 min, annealing at the specific temperature for 1 min, extension at 72°C for 1 min. Extension at 72°C for 10 min was finally performed. Amplicons were analyzed by gel elec-trophoresis on a 2% agarose gel stained with ethidium bromide and visualized by ultraviolet trans-illumination. The residual PCR product (28μl for AQ mode, 20μl for CpG mode) was added to distilled water (12μl for AQ mode, 18μl for CpG mode) and incubated under shaking with binding buffer pH 7.6 (37μl for AQ mode, 40μl for CpG mode) containing 10mM Tris-HCl, 2 M NaCl, 1mM EDTA, and 0.1% Tween 20, added with sepharose beads (3μl for AQ mode, 2μl for CpG mode) covered by streptavidin. PCR products were washed with ethanol 70%, denatured with NaOH 0.2 M and re-washed with Tris-Acetate 10 mM pH 7.6. Pyrose-quencing reaction was performed for AQ mode in a total of 45μl, including 44.82μl of 20 mM Tris-Acetate and 5 mM MgAc2, and 0.18μl of 50μM sequencing primer (final concentration 0.3μM); for CpG mode it was performed in a total of 25μl, including 24.85μl of 20 mM Tris-Acetate, 5 mM MgAc2and 0.15μl of 50μM sequencing primer (final concentration 0.3μM). Assays were created according to manufacturer’s instruction. The nucleotide dispensation order was outlined by the software Q24 2.0.
Analytical Software
Pyromark Q96 ID version 1.0.9 software, allowing analysis in AQ mode, was used to generate and automatically analyze pyrograms resulting from sequencing onto PyroMark Q96 ID system.
Pyromark Q24 version 2.0 software, allowing analysis in CpG mode, was used to generate and automatically analyze pyrograms resulting from sequencing onto PyroMark Q24 MDx system.
Quantitative methylation results were considered both as percentage of individual CpG sites and as average of the methylation percentage of all the investigated CpGs. Only the latter is herein reported.
Following quantification of the methylation at each CpG site, the quality of the result at each position is rendered by both the software through a colour-based score: blue, when quan-tification result is assessed as“passed”therefore acceptable; yellow, when a problem is encoun-tered in the result interpretation, and the result is graded as“to check”; red, when coexisting problems lead to hard interpretation of the pyrogram, and the result is assessed as“failed”.
Colour assignment by the software is based on a series of analytical parameters: a coefficient for height adjustment of the A peak, peaks width, dispensation order, pre-sequencing signal and baseline drift. A non-compliance with these parameters leads to warning messages.
While in the CpG mode always all the parameters are considered, in the AQ mode the last two items are never evaluated by default: they can be optionally included by checking the corre-sponding box. Moreover, the accepted height of the reference peak is quite different: in the CpG mode a single peak height of more than 20 RLU (relative light units) gives acceptable results (blue score), between 10 and 20 RLU results have to be checked (yellow score), below 10 RLU results are scored red, meaning that the run height is too low to consider the quantifica-tion reliable. These parameters can be manually changed by the operator, but they can not be lowered below 5 RLU. In the AQ mode a similar alert appears,“low signal-to-noise ratio”, but it does not display numerical and stringent parameters and it only appears when the quantified signal is too weak to be distinguished from the baseline, that is the signal captured from nega-tive dispensations. Therefore the AQ mode accepts as“passed”runs with very low pick height, also below 5 RLU.
Stringency levels (SL), considering the deviation pattern and the deviation sum in variable positions, are defined in a qualitative way in both modes and set as“normal”by default, but are modifiable by the user in“low”or“high”. When the pyrogram does not satisfy the normal stringency level, the following warning messages can appear: uncertain/failed due to high peak high deviation at dispensation; uncertain/failed due to high sum deviation in variable position; uncertain/failed surrounding reference sequence pattern.
Statistical analyses
The unweighted kappa statistic were computed by PC-SAS software (version 9.2; SAS Institute, Cary, NC, USA) to determine the level of chance-adjusted agreement between replicates. Kappa values of 0.0–0.2, 0.21–0.40, 0.41–0.60, 0.61–0.80, 0.81–0.99, and 1.0 indicate poor, slight, moderate, substantial, almost excellent, and excellent agreement, respectively [28].
Table 1. Pyrosequencing primer sequences and annealing profile.
Gene Primer Primer sequence PCR annealing T° Target sequence bp CpG sites
GSTP1 sense 5’-GATTTGGGAAAGAGGGAAAGGT- 3’ 50 72 bp 4
antisense Biot-5’-CAAAAAAACGCCCTAAAATCC- 3’ sequencing 5’-GGTTTTTTYGGTTAGTTG-3’
LINE-1 sense Biot-5’-TAGGGAGTGTTAGATAGTGG-3’ Td*62!55 108 bp 6
antisense 5’–AACTCCCTAACCCCTTAC- 3’ sequencing 5’-AACTCCCTAACCCCTTAC- 3’
MGMT sense 5’- GTATTAGGAGGGGAGAGATT- 3’ Td*62!59 194 bp 6
antisense Biot-5’-CCTTAATTTACCAAATAACCC- 3’ sequencing 5’-GGGATTTTTATTAAG- 3’
*Td: Touch down
Agreement was also assessed using plots according to Bland-Altman [29] and Pitman’s test of difference in variance (STATA 11.1, StataCorp LP, College Station, TX).
Results
GSTP1 methylation analysis employing PyroMark CpG and AQ mode
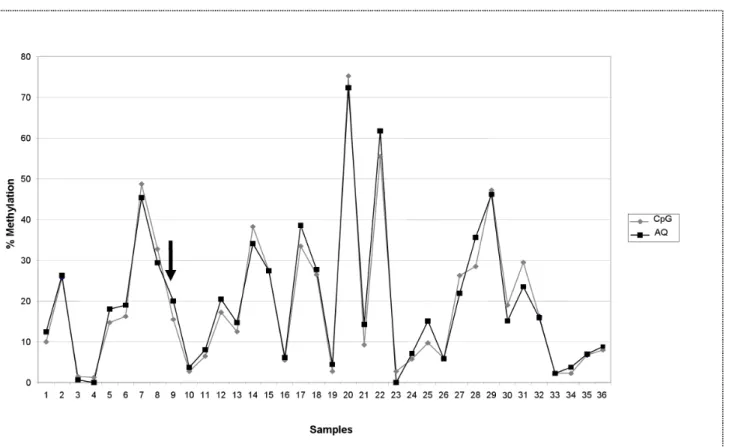
Fig 1shows the results obtained by testing the“PC study”DNA sample series (N = 36) for GSTP1 promoter methylation. Methylation analysis was performed for all the samples in duplicate using the same preliminary PCR products and pyrosequencing profiles, primers included. Analysis was conducted onto both PyroMark Q96 and a Q24 system, which harbor the software for quantification in AQ and CpG mode respectively, and which provide their own software-based quality assessment of the results. Average of methylation percentage of the 4 CpGs investigated in the gene promoter was reported. Deviation between paired samples analyzed with the two“modes”ranged from 0 to 7.15%. Only one red score warning of inade-quate quality of the result was assigned by the Q24 software in CpG mode and no red scores were assigned by the Q96 software in AQ mode. The agreement computed with a threshold limit of 5% of methylation to distinguish unmethylated from methylated samples was excellent (k= 1).
Plot according to Bland-Altman (S1A Fig) shows that the two methods gave on average sim-ilar values (mean difference: -0.66, 95% CI: -1.7 to 0.4) and that the limits of agreement were not too wide (-7.0 and 5.7).
MGMT methylation analysis employing PyroMark CpG and AQ mode
Fig 2shows paired results obtained by testing the“DD study”DNA sample series (N = 28) for MGMT promoter methylation. Methylation analysis was performed for all the samples with the same approach described for GSTP1. We observed deviation between replicates analyzed with the two modes ranging between 0 and 14.4%. The concordance obtained by computing data with the threshold limit of 5% of methylation to distinguish unmethylated from methyl-ated samples was poor (negativekagreement). The CpG mode generated 14/28 (50%) red
scores, the AQ mode none. Paired samples receiving a red score with CpG mode had a yellow or even a blue score when using the AQ mode.
Plot according to Bland-Altman (S1B Fig) shows that analyses on MGMT with the two modes revealed wide limits of agreement (-10.5 to 13.7) and a negative correlation between dif-ferences and means (p = 0.003).
LINE-1 methylation analysis employing PyroMark CpG and AQ mode
Fig 3shows paired results obtained by testing the“DD study”DNA sample series (N = 28) for LINE-1 promoter methylation of a template sequence including 6 CpGs. The same methodo-logical approach described above was used. We obtained a mean percentage of methylation of 70%. Deviation between replicates ranged from 0.5 to 4.2%.
The AQ mode always assigned a blue score to all the 6 investigated CpGs (S2A Fig). Con-versely, the CpG mode assigned a blue score only to the first investigated CpG in all the sam-ples (S2B Fig). All the other CpGs in all the samples received a yellow (42% of all tested CpGs) or a red (57% of all tested CpGs) score.
LINE-1 methylation levels. A negative correlation between differences and means in LINE-1 methylation levels between the two modes is present (p value from the Pitman’s test = 0.006).
Discussion
Pyrosequencing has emerged as an alternative method of nucleic acid sequencing, well suited for many applications which aim to characterize small DNA target sequences, whereas other available systems are more commonly used for global DNA analysis approaches (e.g.: microar-ray-based-Genome Wide Analysis; 454 array-based pyrosequencing platform, Life Sciences—
Roche Diagnostics, Bonn, Germany, Illumina, San Diego, California; MALDI-TOF Mass Spec-trometry, AB SCIEX Framingham, MA). Single Nucleotide Polymorphisms (SNPs), mutations, bacteria and viral types, sequences from cDNA library and methylated CpG sites can be effi-ciently investigated by pyrosequencing [10,11].
For these applications, and also for DNA methylation analysis, published results have been widely obtained also recently by using software for analysis in AQ mode onto the PyroMark Q96. The use of PyroMark Q24 as well as of software for analysis in CpG mode is more rarely reported [9,30–35] although the latter was specifically generated for DNA methylation assess-ment. Proof of equivalent performance in CpG methylation analysis of the two software is not available, and we are not aware of comparison of methylation results from replicates tested with both software.
Fig 1. GSTP1 methylation analysis of DNA samples (PC study) tested in duplicate with PyroMark CpG mode and AQ mode.DNA samples (N = 36) obtained from paraffin embedded prostate tumor tissue of patients involved in“PC study”[24]. Mean methylation percentage of 4 CpGs in the promoter of GSTP1 gene is reported. Target sequence: 72 bp of GSTP1 promoter (Gene Bank M24485 at position 1001–1072); CpGs at position 1038, 1040, 1043, 1049. Deviation between paired samples ranged from 0 to 7.15%. One red score was assigned by the CpG mode to the sample indicated by the arrow. No sample has a red score assigned by the AQ mode.
Our paired results obtained with the two“modes”in the GSTP1 methylation analysis were in agreement. The GSTP1 methylation assay was set up at its best performance, thus reliable results were obtained with both the analytical systems, supported by blue scores assigned by the two software. The GSTP1 promoter is usually poorly methylated in normal cells, as the gene is physiologically expressed, and methylation rate was expected in normal conditions nearby the assay detection limit [36]. Every increase in the methylation rate can be therefore interpreted as a modification of the physiological pathway potentially involved in the outcome under investigation. From this point of view the above reported range of deviation (0–7.15%) between replicates can be considered within the limits of tolerance, and does not impair the reliability of the results, nor the conclusions that can be drawn by the analyses.
Conversely, paired results obtained with the two“modes”in the MGMT methylation analy-sis were highly discordant. In these assays the deviation between replicates acquires relevance, because the two modes differently identified methylated and un-methylated samples, weaken-ing the reliability of the results. While CpG mode highlighted warnweaken-ings for the interpretation of these results, likely due to a PCR assay not set up at its best performance yet, the AQ mode passed many results as acceptable with potential impact on the reliability of the final associa-tion of methylaassocia-tion events with the outcome.
When methylation average differences are supposed to be small among samples of a study series, accuracy in measuring quantitative results becomes more relevant to support evidence of associations. Indeed, methylation levels of intersperses sequences (e.g. LINEs) have been described to be slightly different (<5–10%) between pathological and physiological conditions [37,38]. LINE sequences are physiologically methylated and are commonly investigated as sur-rogates of global hypomethylation events. We tested healthy subjects and obtained a mean per-centage of methylation of 70%, consistent with the blood detection average reported in the
Fig 2. MGMT methylation analysis of DNA samples (DD study) tested in duplicate onto PyroMark CpG mode and AQ mode.DNA samples (N = 28) obtained buffy coats of patients involved in“DD study”[25]. Mean methylation percentage of 6 CpGs in the promoter of MGMT gene is reported. Target sequence: 194 bp of MGMT (Gene ID 4255 at position 44526–44719); CpGs at position 44600, 44604, 44607, 44614, 44621, 44623. Deviation between paired samples ranged from 0.3 to 14.4%. The CpG mode assigned 14 red score. No sample has a red score assigned by the AQ mode.
literature (ranges 66%-82.5% [39,40], 71.9% [41], 73.1% [42], 70–76% [26]). Thekagreement
was not assessed as meaningless in this context where, by testing hypomethylation events, we could only obtain less positive but unlikely negative (i.e. unmethylated) samples. The deviation between replicates (0.5–4.2%) that we obtained with the two modes could be misleadingly con-sidered limited. The small biological variability in LINE-1 methylation levels has to be taken into account as it may potentially underline alterations. The score assignment by the two modes was very different: a more permissive performance of AQ mode is in contrast with the strong warnings of CpG mode on the need to improve PCR and pyrosequencing efficiency, although the assay profile as well as the primer sequences were chosen according to the litera-ture [26]. If quantization is performed in AQ mode, no alert for potential unreliability of the results would emerge and risk of wrong classification and incorrect conclusions could not be excluded.
Both for LINE-1 and MGMT the negative correlation from the Bland-Altman plots trans-lated into a qualitative change: CpG mode gave higher values for low methylation levels and lower values than AQ mode for higher methylation levels.
The discrepancy in quality score assignment by the two software modes lies on the different criteria which represent the stringency level (SL) for the assay: these levels (“low”,“normal”,
“high”SL) are not comparable between AQ and CpG mode. Also if a low SL was manually set for CpG mode in the aforementioned assay, we would be unable to get acceptable scores for all CpGs: even the low SL of the CpG mode appeared more stringent than the high SL of the AQ mode.
Fig 3. LINE-1 methylation analysis of DNA samples (DD study) tested in duplicate onto. PyroMark CpG mode and AQ mode.DNA samples (N = 28) obtained from buffy coats of patients involved in“DD study”[25]. Mean methylation percentage of 6 CpGs in the promoter of LINE-1 gene is reported. Target sequence: 108 bp of LINE-1 (GeneBank X58075.1 at position 117–224); CpGs at position 156, 131, 165, 167, 172, 182. Deviation between paired samples ranged from 0.5 to 4.2%. No red scores were assigned by the AQ mode. CpG mode assigned blue score only to the first CpG of each sample: all the other CpG in each samples received red or yellow scores.
In addition, default acceptable minimum height of single peaks in the pyrogram is quite dif-ferent in the two modes (CpG: 20 RLU; AQ: none fixed limit), leading to a more stringent iden-tification of methylation signals from background noise in the CpG mode.
Conclusions
This is, at our knowledge, the first study comparing the performance in quantification of CpG methylation of the two mode analyses provided by PyroMark systems. Our data show discrep-ancy in the pyrosequencing software-based quality assignment of methylation results between the two mode of analyses. The less permissive criteria included into the Pyro Q-CpG™software for quantification in CpG mode make explicit unsatisfactory performance of the assays for quantitative evaluation of DNA methylation at CpG sites. Therefore, the CpG mode of analysis ensures a better accuracy in the quantification of DNA methylation compared with the wide-spread used AQ mode. The potential drawbacks emerged in test accuracy could impact on the reliability of the results, and lead to consider AQ mode as not properly adequate for quantifica-tion of CpG methylaquantifica-tion. Upgraded software versions which include the CpG mode are avail-able for both Q24 and Q96 instrument. Basing on our data this implementation, in agreement with previous suggestions [13], is strongly advisable to improve the quality of the CpG methyl-ation analysis results achievable by pyrosequencing.
Supporting Information
S1 Fig. (A-B-C). Methylation results plots according to Bland-Altman and Pitman’s Test of difference in variance.Comparison of the two methylation measurements obtained in AQ mode and in CpG mode by plots to evaluate difference in variance.
(TIF)
S2 Fig. (A-B). Summary of the analysis of LINE-1 methylation on DNA samples in DD study.Comparison in replicates of the colour score assignment with the two software. (TIF)
Author Contributions
Conceived and designed the experiments: AGT CG CS LDM MT VF VT. Performed the exper-iments: CG MT VF VT. Analyzed the data: AG CG FM LR MT VF. Wrote the paper: AGT CG.
References
1. Bird A. The essential of DNA methylation. Cell. 1992: 70: 5–8. PMID:1377983
2. Jones PA, Takai D. The role of DNA methylation in mammalian epigenetics. Science. 2001; 293: 1068– 70. PMID:11498573
3. Jones PA. Functions of DNA methylation: islands, start sites, gene bodies and beyond. Nat Rev Genet. 2012; 13: 484–92. doi:10.1038/nrg3230PMID:22641018
4. Patil V, Ward RL, Hesson LB. The evidence for functional non-CpG methylation in mammalian cells. Epigenetics. 2014; 9: 823–8. doi:10.4161/epi.28741PMID:24717538
5. Frommer M, McDonald E, Millar DS, Collis CM, Watt F, Grigg GW et al. A genomic sequencing protocol that yields a positive display of 5-methylcytosine residues in individual DNA strands. Proc Natl Acad Sci USA. 1992; 89: 1827–1831. PMID:1542678
6. Ma X, Wang YW, Zhang MQ, Gazdar AF. DNA methylation data analysis and its application to cancer research. Epigenomics. 2013; 5: 301–16. doi:10.2217/epi.13.26PMID:23750645
8. Gharizadeh B. Method Development and Applications of Pyrosequencing Technology. 1st Edn., Stockholm, ISBN: 9172836105, 2003.
9. Mikeska T, Felsberg J, Hewitt CA, Dobrovic A. Analysing DNA methylation using bisulphite pyrose-quencing. Methods Mol Biol. 2011; 791: 33–53. doi:10.1007/978-1-61779-316-5_4PMID:21913070
10. Ahmadian A, Ehn M, Hober S. Pyrosequencing: history, biochemistry and future. Clin Chim Acta. 2006; 363: 83–94. PMID:16165119
11. Fakruddin M, Chowdhury A. Pyrosequencing-An alternative to traditional Sanger sequencing. Am J Biochem & Biotech. 2012; 8: 14–20.
12. Ronaghi M. Pyrosequencing sheds light on DNA sequencing. Genome Research. 2001; 11: 3–11. PMID:11156611
13. Dejeux E, El Abdalaoui H, Gut IG, Tost J. Identification and quantification of differentially methylated loci by the pyrosequencing technology. Methods Mol Biol.2009; 507: 189–205. doi: 10.1007/978-1-59745-522-0_15PMID:18987816
14. Tost J, Dunker J, Gut IG. Analysis and quantification of multiple methylation variable positions in CpG islands by Pyrosequencing. Biotechniques. 2003; 35: 152–6. PMID:12866415
15. Uhlmann K, Brinckmann A, Toliat MR, Ritter H, Nürnberg P. Evaluation of a potential epigenetic bio-marker by quantitative methyl-single nucleotide polymorphism analysis. Electrophoresis. 2002; 23: 4072–4079. PMID:12481262
16. Banelli B, Brigati C, Di Vinci A, Casciano I, Forlani A, Borzì L et al. A pyrosequencing assay for the quantitative methylation analysis of the PCDHB gene cluster, the major factor in neuroblastoma methyl-ator phenotype. Lab Invest. 2012; 92: 4584–4565.
17. Cardoso LC, Tenorio Castaño JA, Pereira HS, Lima MA, Dos Santos AC, de Faria PS et al. Constitu-tional and somatic methylation status of DMRH19 and KvDMR in Wilms tumor patients. Genet Mol Biol. 2012; 35: 714–724. doi:10.1590/S1415-47572012005000073PMID:23271929
18. Filiberto AC, Maccani MA, Koestler D, Wilhelm-Benartzi C, Avissar-Whiting M, Banister CE et al. Birth-weight is associated with DNA promoter methylation of the glucocorticoid receptor in human placenta. Epigenetics. 2011; 6: 566–572. PMID:21521940
19. Löf-Ohlin ZM, Nilsson TK. Pyrosequencing assays to study promoter CpG site methylation of the O6-MGMT, hMLH1, p14ARF, p16INK4a, RASSF1A, and APC1A genes. Oncol Rep. 2009; 21: 721–729. PMID:19212632
20. Brakensiek K, Wingen LU, Länger F, Kreipe H, Lehmann U. Quantitative high-resolution CpG islands mapping with pyrosequencing reveals disease-specific methylation patterns of the CDKN2B gene in myelodisplastic syndrome and myeloid leukemia. Clin Chem. 2007; 53: 17–23. PMID:17095538
21. Nabilsi NH, Ryder DJ, Peraza-Penton AC, Poudyal R, Loose DS, Kladde MP. Local Depletion of DNA Methylation Identifies a Repressive p53 Regulatory Region in the NEK2 Promoter. J Biol Chem. 2013; 288: 35940–35951. doi:10.1074/jbc.M113.523837PMID:24163369
22. Oertel BG, Doehring A, Roskam B, Kettner M, Hackmann N, Ferreirós N et al. Genetic-epigenetic inter-action modulatesμ-opioid receptor regulation. Hum Mol Genet. 2012; 21: 4751–4760. doi:10.1093/ hmg/dds314PMID:22875838
23. Vinci S, Gelmini S, Mancini I, Malentacchi F, Pazzagli M, Beltrami C et al. Genetic and epigenetic fac-tors in regulation of microRNA in colorectal cancers. Methods. 2013; 59: 138–146. doi:10.1016/j. ymeth.2012.09.002PMID:22989523
24. Richiardi L, Fiano V, Vizzini L, De Marco L, Delsedime L, Akre O et al. Promoter methylation in APC, RUNX3, and GSTP1 and mortality in prostate cancer patients. J Clin Oncol. 2009; 27: 3161–3168. doi: 10.1200/JCO.2008.18.2485PMID:19470943
25. Talaska G, Zoughool M, Malaveille C, Fiorini L, Schumann B, Vietas J et al. Randomized controlled trial: effects of diet on DNA damage in heavy smokers. Mutagenesis. 2006; 21: 179–183. PMID: 16624830
26. Vaissière T, Cuenin C, Paliwal A, Vineis P, HoeK G, Krzyzanowski M et al. Quantitative analysis of DNA methylation after whole bisulfitome amplification of a minute amount of DNA from body fluids. Epi-genetics. 2009; 4: 221–230. PMID:19458486
27. Vineis P, Chuang SC, Vaissiere T, Cuenin C, Ricceri F, The Genair-Epic Collaborators et al. DNA Meth-ylation changes associated with cancer risk factors and blood levels of vitamin metabolites in a pro-spective study. Epigenetics. 2011; 6: 195–201. PMID:20978370
28. Fleiss JL. Statistical Methods for Rates and Proportions ( 2nd edition). Wiley, New York; 1981.
30. Delgado-Cruzata L, Hruby GW, Gonzalez K, McKiernan J, Benson MC, Santella RM et al. DNA methyl-ation changes correlate with Gleason score and tumor stage in prostate cancer. DNA Cell Biol. 2012; 31: 187–192. doi:10.1089/dna.2011.1311PMID:21830905
31. Fernandez AF, Assenov Y, Martin-Subero JI, Balint B, Siebert R, Taniguchi H et al. A DNA methylation fingerprint of 1628 human samples. Genome Res. 2012; 22: 407–419. doi:10.1101/gr.119867.110 PMID:21613409
32. Goering W, Ribarska T, Schulz WA. Selective changes of retroelement expression in human prostate cancer. Carcinogenesis. 2011; 32: 1484–1492. doi:10.1093/carcin/bgr181PMID:21828060
33. Iwata A, Nagata K, Hatsuta H, Takuma H, Bundo M, Iwamoto K.et al. Altered CpG methylation in spo-radic Alzheimer's disease is associated with APP and MAPT dysregulation. Hum Mol Genet.2013; 23: 648–656. doi:10.1093/hmg/ddt451PMID:24101602
34. Kim JH, Dhanasekaran SM, Prensner JR, Cao X, Robinson D, Kalyana-Sundaram S et al. Deep sequencing reveals distinct patterns of DNA methylation in prostate cancer. Genome Res. 2011; 21: 1028–1041. doi:10.1101/gr.119347.110PMID:21724842
35. Stanzer S, Balic M, Strutz J, Heitzer E, Obermair F, Hauser-Kronberger C et al. Rapid and reliable detection of LINE-1 hypomethylation using high-resolution melting analysis. Clin Biochem. 2010; 43: 1443–1448. doi:10.1016/j.clinbiochem.2010.09.013PMID:20883681
36. Kristensen L, Raynor M, Candiloro I, Dobrovic A. Methylation profiling of normal individuals reveals mosaic promoter methylation of cancer-associated genes. Oncotarget. 2012; 3: 450–461. PMID: 22570110
37. Schulz WA, Elo JP, Florl AR, Pennanen S, Santourlidis S, Engers R et al. Genomewide DNA hypo-methylation is associated with alterations on chromosome 8 in prostate carcinoma. Genes Chromo-somes Cancer. 2002; 35: 58–65. PMID:12203790
38. Wolff E, Byun H, Han H, Sharma S, Nichols P, Siegmund K et al. Hypomethylation of a LINE-1 Pro-moter Activates an alternate Transcript of the MET Oncogene in Bladders with Cancer. PLoS Genetics. 2010; 6: e1000917. doi:10.1371/journal.pgen.1000917PMID:20421991
39. Bollati V, Baccarelli A, Hou L, Bonzini M, Fustinoni S, Cavallo D et al. Changes in DNA methylation pat-terns in subjects exposed to low-dose benzene. Cancer Res. 2007; 67: 876–880. PMID:17283117
40. Bollati V, Baccarelli A, Sartori S, et al. Epigenetic effects of shiftwork on blood DNA methylation. Chron-obiol Int. 2010; 27: 1093–1104. doi:10.3109/07420528.2010.490065PMID:20636218
41. Estécio MR, Gharibyan V, Shen L, Ibrahim AE, Doshi K, He R et al. LINE-1 hypomethylation in cancer is highly variable and inversely correlated with microsatellite instability. PLoS One. 2007; 2: e399. PMID:17476321