Submitted4 December 2015
Accepted 5 April 2016
Published25 April 2016
Corresponding author
Martina A. Doblin, [email protected]
Academic editor
J. Gregory Caporaso
Additional Information and Declarations can be found on page 23
DOI10.7717/peerj.1973
Copyright
2016 Doblin et al.
Distributed under
Creative Commons CC-BY 4.0
OPEN ACCESS
Nutrient uplift in a cyclonic eddy
increases diversity, primary productivity
and iron demand of microbial
communities relative to a western
boundary current
Martina A. Doblin1, Katherina Petrou2, Sutinee Sinutok1,3, Justin R. Seymour1,
Lauren F. Messer1, Mark V. Brown4, Louiza Norman5, Jason D. Everett6,
Allison S. McInnes1, Peter J. Ralph1, Peter A. Thompson7and
Christel S. Hassler8
1Plant Functional Biology and Climate Change Cluster, University of Technology Sydney, Ultimo NSW, Australia
2School of Life Sciences, University of Technology Sydney, Ultimo NSW, Australia
3Faculty of Environmental Management, Prince of Songkla University, Kho Hong Songkhla, Thailand 4School of Biotechnology and Biomolecular Sciences, University of New South Wales, Sydney NSW,
Australia
5Department of Plant Sciences, University of Cambridge, Cambridge, United Kingdom
6School of Biological, Earth and Environmental Sciences, University of New South Wales, Sydney NSW, Australia
7Oceans and Atmosphere Flagship, Commonwealth Scientific Industrial Research Organisation, Hobart Tas, Australia
8Institute F.-A. Forel, Earth and Environmental Sciences, University of Geneva, Geneva, Switzerland
ABSTRACT
both the EAC and CCE, diatoms increased in abundance with macronutrient (N, P, Si) and iron amendment, whereas haptophytes and phototrophic dinoflagellates declined. Our results indicate that cyclonic eddies increase delivery of nitrogen to the upper ocean to potentially mitigate the negative consequences of increased stratification due to ocean warming, but also increase the biological demand for iron that is necessary to sustain the growth of large-celled phototrophs and potentially support the diversity of diazotrophs over longer time-scales.
SubjectsBiochemistry, Ecology, Environmental Sciences, Microbiology, Molecular Biology Keywords Upwelling, Meso-scale processes, Nutrient limitation, Marine microbial diversity, Physiology
INTRODUCTION
There are two broad nutrient limitation regimes for phytoplankton growth in the contemporary ocean, whereby iron (Fe) limitation occurs across ∼30% of the ocean’s surface area where high macronutrient concentrations occur (high latitudes, upwelling and some coastal areas), and nitrogen (N) limitation occurs across most of the oligotrophic low-latitude systems (Moore et al., 2013). Different phytoplankton groups can have specific nutrient requirements, such as Fe for diazotrophs (Kustka et al., 2003) and silicon (Si) for diatoms (Brzezinski & Nelson, 1989), which may lead to secondary or interactive effects on Fe or N limitation. Co-limitation may also arise when there is physical mixing between water masses with different nutrient stoichiometry, or over seasonal cycles when physical nutrient inputs and biological cycling alters nutrient bioavailability (Deutsch & Weber, 2012).
Global Climate Model (GCM) projections indicate warming and increased stratification of the upper ocean over the coming decades, limiting the upwards delivery of nitrogen (e.g., ‘‘new’’ N) into the euphotic zone, and potentially leading to increased reliance on a smaller pool of regenerated forms or N fixation to support primary production (Behrenfeld, 2011). However, these models typically do not consider the influence of smaller scale oceanographic features such as meso-scale eddies, which could act as a compensatory mech-anism and enrich the upper ocean with new nutrients delivered from deeper ocean waters, potentially mitigating the negative consequences of climate change (Matear et al., 2013).
Much of what is known about eddies and their impact on the base of the foodweb is derived from satellite ocean colour observations which provide limited information with respect to microbial species composition and biogeochemical activity, and have a restricted view of the upper ocean (McGillicuddy, 2016). In situobservations and manipulative experiments are therefore critical to develop a full understanding of the role of meso-scale eddies in upper-ocean ecosystem dynamics and biogeochemical cycling.
Australia has one of the longest north-south coastlines in the world, and the oceanog-raphy along its east coast is extremely dynamic. It is strongly influenced by the flow of the Eastern Australian Current (EAC), one of five western boundary currents (WBCs) in the global ocean. Southward of∼32◦S 153◦E, where two thirds of the EAC deviates eastward
to-wards New Zealand to form the Tasman Front, the remaining EAC flow meanders, breaking down into a complex series of meso-scale eddies (Ridgway & Godfrey, 1997). The number and frequency of these eddies is higher than in the broader Tasman Sea, and their biological properties differentiate more strongly from background ocean waters than their oceanic counterparts (Everett et al., 2014). A critical research question is whether the observed intensification of the EAC (Wu et al., 2012) will result in more eddies, a change in the nature of these eddies, and how they will impact on primary producers and higher trophic levels.
Given that offshore phytoplankton communities in the Tasman Sea are generally N limited (Hassler et al., 2011;Ellwood et al., 2013), and that cyclonic cold-core eddies displace isopycnal surfaces (seawater of similar density) upwards and can upwell nutrients into the euphotic zone (McGillicuddy et al., 1998), EAC-induced eddies could increase the supply of nitrogen into surface waters from below the thermocline and potentially alter controls on phytoplankton growth. However, another source of N into surface waters is from N2fixing microbes. At least four different groups of diazotrophs have been identified from Australian waters: the filamentous, photosynthetic cyanobacteriumTrichodesmium, the unicellular phycoerythrin-containing cyanobacteriumCrocosphaera watsonii(group B), the photoheterotrophic symbiont UCYN-A (associated with specific prymnesiophyte hosts;
Hagino et al., 2013), and heterotrophic proteobacteria (Moisander et al., 2010;Seymour et al., 2012;Messer et al., 2015). The regional distribution of diazotrophs in the western South Pacific suggests there is a sufficient supply of Fe to satisfy the requirements of the nitrogenase enzyme (Kustka et al., 2003), but little is known about how eddies may change the delivery of Fe or N from depth in this region, and hence alter the dynamics of diazotrophs relative to other microbial groups.
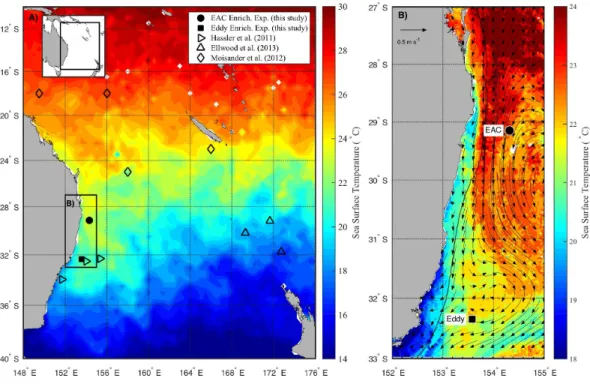
Figure 1 Study area.(A) Average sea surface temperature (SST) for October 2010 in the Tasman Sea, eastern Australia. The location of previous nutrient amendment studies are shown with symbols. The black box is the domain for the current study. (B) Average SST (20–25th October 2010) of the study do-main during the voyage, showing location of sampling sites. The black line shows 200 m isobath, which approximates the continental shelf edge. Geostrophic velocities, estimated from sea-level anomaly are shown as arrows (20th October 2010).
MATERIALS AND METHODS
Study site and water collection
The experiments were conducted on theRV Southern Surveyor during austral spring in 2010 (15–31 October) between 29 and 36◦S, and 150 and 155◦E (Fig. 1A). Sampling sites
were chosen with the assistance of daily Moderate Resolution Imaging Spectroradiometer (MODIS) and Advanced Very High Resolution Radiometer (AVHRR) satellite imagery and targeted the EAC and a meso-scale cyclonic (cold core) eddy (CCE;Fig. 1B). To examine the oceanographic context of the sampling period, MODIS Level 3 sea-surface temperature was obtained from the Integrated Marine Observing System (IMOS) Data Portal (http://imos.aodn.org.au/imos/) at 1 km resolution. Satellite altimeter data were obtained from NASA/CNES (Jason-1 and 2) and ESA (ENVISAGE) via the IMOS portal.
At each site, the physico-chemical properties of the water column (0–200 m) were measured with the aid of a Conductivity-Temperature-Depth (CTD; Seabird SBE911-plus) equipped with a fluorometer (AquaTracker Mk3, Chelsea, UK), transmissometer (Wetlabs C-Star (25 cm optical path)), dissolved oxygen (Seabird SBE43) and Photosynthetically Active Radiation (PAR; Biospherical Instruments QCP-2300 Log Quantum Cosine Irradiance Sensor) sensor.
fluorescence maximum (as determined by the down-cast fluorescence profile) using 10 L Niskin bottles (80 m in the EAC, and 41 m in the CCE). A trace metal clean rosette was not available for this voyage, so the following precautions were taken to minimise trace metal contamination. Water was sampled from Niskin bottles through acid washed silicon tubing with plastic bags covering the tubing and bottle neck, and polyethelene gloves were worn during water sampling and manipulation. Seawater was filtered through acid-soaked 200–210µm mesh to remove mesozooplankton grazers and collected in 20 L acid washed
(1 N HCl, rinsed 7-times with MilliQ water) LDPE or PC carboys. Carboys were stored in double-plastic bags and kept in plastic boxes to avoid contact with the ship. All subsequent sampling took place in a custom-made, metal free laminar flow cabinet, dedicated for trace metal clean work using standard clean room procedures.
Experimental setup
Water was homogenised, sampled for dissolved nutrients, flow cytometry, phytoplankton pigments, nucleic acid collection and photo-physiological measurements, with the remain-der transferred into pre-treated acid washed (1 N HCl, rinsed 7-times with MilliQ water) 4 L polycarbonate bottles (Nalgene) under laminar flow conditions. Bottles were randomly allocated to five nutrient addition treatments in triplicate: an unamended control, +NO3 (10µM nitrate final concentration), +NO3+FeCl3(10µM and 1 nM final concentration
(ICP-MS 1g/L standard, Fluka), respectively), +Si(OH)4 (10µM final concentration),
nutrient mix (+NO3+Si+PO4+Fe; 10N : 10Si : 0.625PµM in Redfield proportions and 1
nM Fe respectively). After the addition of nutrients, bottles were capped, gently inverted and lids sealed with parafilm, before being placed into an on-deck, flow-through incubator, exposed to 25% surface irradiance andin situtemperature conditions. Surface seawater supplying the deck board incubators was 21.94±0.47◦C during the EAC incubation and
21.57±0.27◦C during the CCE incubations. This closely matches thein situtemperature
for both EAC (80 m) and CCE (41 m) communities at the time of sampling (Table 1). For the EAC experiment, control bottles were sampled daily for maximum quantum yield of photosystem II (FV/FM) before being enriched with their respective nutrient or nutrient mix treatment, then re-sealed and returned to the on-deck incubator. The same sampling protocol was used in the CCE; however, no additional nutrient additions were made after the initial amendment to avoid accumulation of excess nutrients. To limit nutrient or microbiological cross-contamination, the same bottles were re-used for identical experimental (nutrient) treatments across the EAC and CCE experiments. Macronutrient analyses were carried out on board by CSIRO Marine and Atmospheric Research (CMAR) according toCowley et al. (1999). Nutrient measurements had a standard error <0.7% and a detection limit of 0.035µM for NOx, 0.012µM for Si and 0.009µM for PO4.
After 3 days (72–78 h) of incubation, nutrient experiments were terminated. Microbial responses to nutrient additions were quantified by measuring pigments (Chl-a and other accessory pigments), abundance of pico- and nano-phytoplankton and heterotrophic bacteria via flow cytometry, and DNA sequencing for characterising prokaryote and diazotroph community diversity and composition (16S ribosomal RNA, nitrogenaseNifH
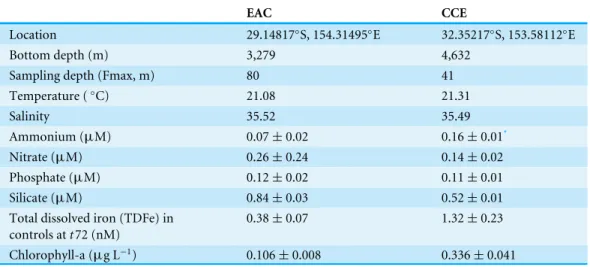
Table 1 Starting conditions for nutrient amendment experiments in the East Australian Current (EAC) and a cyclonic cold core eddy (CCE).Note that sampling depths targeted the chlorophyll-a fluorescence maximum (Fmax), which was deeper in the EAC than the CCE.
EAC CCE
Location 29.14817◦S, 154.31495◦E 32.35217◦S, 153.58112◦E
Bottom depth (m) 3,279 4,632
Sampling depth (Fmax, m) 80 41
Temperature (◦C) 21.08 21.31
Salinity 35.52 35.49
Ammonium (µM) 0.07±0.02 0.16±0.01*
Nitrate (µM) 0.26±0.24 0.14±0.02
Phosphate (µM) 0.12±0.02 0.11±0.01
Silicate (µM) 0.84±0.03 0.52±0.01
Total dissolved iron (TDFe) in controls att72 (nM)
0.38±0.07 1.32±0.23
Chlorophyll-a (µg L−1) 0.106±0.008 0.336±0.041
Notes.
*Analytical replicates from same CTD cast, not separate casts as for EAC (n=2).
Pigment analysis
Seawater (minimum volume 2.2 L) was filtered under low vacuum (e.g., ≤100 mm Hg) onto 25 mm GF/F filters in low light (<10µmol photons m−2 s−1). Filters were
folded in half, blotted dry on absorbent paper, placed into screw-capped cryovials and stored in liquid nitrogen until pigment analysis. In the laboratory, pigments were extracted and analysed using High Performance Liquid Chromatography (HPLC) as described inHassler et al. (2011). Biomarker pigments were used to infer the distribution of dominant phototrophs. Each biomarker pigment was normalised against Chl-a (the universal pigment in all phytoplankton) to account for spatial variation in the total phytoplankton biomass. Briefly, biomarkers represent the following phytoplankton groups: Zeaxanthin (Zea) =cyanobacteria; 19’Hexanoyloxyfucoxanthin (19-Hex) = haptophytes; Chlorophyll-b (Chl-b) and lutein = Chlorophytes; Alloxanthin (Allo) =cryptophytes, 19’Butanoloxylfucoxanthin (19-But) =pelagophytes; Prasinoxanthin (Prasino)=prasinophytes; Peridinin (Per)=autotrophic dinoflagellates; and Fucoxanthin (Fuco)=diatoms, prymnesiophytes, chrysophytes, pelagophytes and raphidophytes. The photosynthetic (PSC) and photoprotective (PPC) carotenoid pigment contributions were calculated as inBarlow et al. (2007), and the approach ofUitz et al. (2008)was used to assess the taxonomic composition of the phytoplankton community and characterise its size structure. While this method may be subject to error because pigments are shared between different phytoplankton groups, and some groups are spread across different sizes, we apply it in this study to examine relative (not absolute) differences in size structure between water masses and nutrient treatments.
Flow cytometry
Populations ofProchlorococcus,Synechococcus and picoeukaryotes were discriminated using side scatter (SSC) and red and orange fluorescence (Marie et al., 1997) using a flow cytometer (LSR II, BD Biosciences). Pigment content per cell was normalised to the fluorescence of standard yellow-green beads (1µm FluoSpheresR; Life Technologies) that
were added to each sample immediately before analysis. Samples for bacterial analysis were stained with SYBR Green I nucleic acid stain (1:10000 final dilution; Molecular Probes) (Marie et al., 1997) and high and low nucleic acid content populations were discriminated according to green fluorescence and side scatter properties (Gasol & Del Giorgio, 2000;Seymour, Seuront & Mitchell, 2007). Data was analysed using Cell-Quest Pro (BD Biosciences).
DNA extraction and sequence analysis of prokaryote and diazotrophic communities
Water samples (2 L) for DNA analyses were filtered onto 0.2µm polycarbonate membrane
filters (Millipore), snap frozen in liquid nitrogen and stored at−80◦C prior to analysis.
Genomic DNA was subsequently extracted using the Power Water DNA extraction kit (MoBio Laboratories, Inc) following the manufacturer’s protocols and DNA concentration was quantified using a QubitR 2.0 fluorometer (Invitrogen). To determine bacterial
community composition, the V1-V3 region of the 16S rRNA gene was amplified using the primer sets inTable S1, and sequenced by 454 pyrosequencing (Roche, FLX Titanium; Molecular Research LP) following previously published protocols (Acosta Martinez et al., 2008;Dowd et al., 2008). 16S rRNA gene sequences were analysed and processed using the Quantitative Insights into Microbial Ecology software (QIIME;Caporaso et al., 2010). Briefly, samples were quality filtered, de-multiplexed and clustered based on 97% sequence identity using UCLUST (Edgar, 2010). Taxonomy was assigned according to the latest version of the SILVA database (111; Quast et al., 2013) and samples were rarefied to the lowest number of sequences to ensure even sampling effort across samples (14,621 sequences per sample).
For N2-fixing bacteria, the gene encoding a subunit of the enzyme nitrogenase (NifH,
Zehr, Mellon & Hiorns, 1997;Zehr et al., 2003) was amplified and sequenced from genomic DNA using previously published methods (Zehr & McReynolds, 1989; Zehr & Turner, 2001). A nested PCR protocol was used to amplify an approximately 359 bp region of the
NifH gene using two sets of degenerate primers listed inTable S1. PCR products were purified using the Ultra Clean PCR Clean-up Kit (MoBio Laboratories, Inc) following the manufacturer’s instructions. ThenifH amplicons were sequenced by 454 pyrosequencing (Roche, FLX Titanium; Molecular Research LP) after an additional 10-cycles PCR with custom barcoded NifH1 and NifH2 primers under the same reaction conditions (Dowd et al., 2008;Farnelid et al., 2011;Farnelid et al., 2013). Raw sequences were quality filtered, and de-multiplexed in QIIME (Caporaso et al., 2010). Sequences were clustered at 95% sequence identity using UCLUST, whereby nNifH sequences within 5% identity of a centroid read were assigned as operational taxonomic units (OTUs) (Edgar, 2010), then rarefied to 1,050 sequences per sample to ensure even sampling effort, resulting in 989NifH
assigned to them were analysed further (representing 85% of total NifH sequences), resulting in 16 OTUs. Putative taxonomy was assigned using BLASTn (Altschul et al., 1990) against the NCBI Nucleotide collection database, and translated NifH sequences were compared to the Ribosomal Database Project’sNifH protein database using FrameBot (Wang et al., 2013;Fish et al., 2013).
Photophysiological measurements
Photosynthetic efficiency of microbial phototrophs was measured using a Pulse Amplitude Modulated (PAM) fluorometer (Water-PAM; Walz GmbH, Effeltrich, Germany). A 3 ml aliquot of water was transferred to a quartz cuvette and after a 10 min dark-adaptation period, minimum fluorescence (FO) was recorded. Upon application of a saturating pulse of light (pulse duration=0.8 s; pulse intensity > 3000µmol photons m−2s−1) maximum
fluorescence (FM) was determined. From these two parameters,FV/FM was calculated according to the equation (FM−FO)/FM (Schreiber, 2004).
Phytoplankton primary production measurements
Phytoplankton primary production was estimated at the end of the 3-day experiments using small volume14C incubations as described in Doblin et al. (2011). Carbon uptake rates were normalised toin situChl-a concentrations. Carbon fixation-irradiance relationships were then plotted and the equation ofPlatt, Gallegos & Harrison (1980)used to fit curves to data using least squares non-linear regression. Photosynthetic parameters included light-saturated photosynthetic rate [Pmax, mg C (mg Chl-a)−1h−1], initial slope of the light-limited section of the carbon fixation-irradiance curve [α, mg C (mg Chl-a)−1h−1 (µmol photons m−2s−1)−1], and light intensity at which carbon-uptake became maximal
(calculated asPmax/α=Ek,µmol photons m−2s−1). Statistical analysis
Differences in microbial composition and diversity between the initial EAC and CCE communities, and between nutrient treatments within each water mass were assessed using analysis of variance (ANOVA;α=0.05). Data were analysed comparing responses at the end of incubation,t72 (72–78 h), across treatments, as well as comparing the differences over time from the initial water (t0) tot72. Multiple comparison adjustment of thep-value was made using a Tukey’s HSD test. To ensure that the assumption of equal variances for all parametric tests was satisfied, a Levene’s test for homogeneity of variance was applied to all dataa prioriand when necessary, data was transformed. All analyses were performed using SPSS statistical software (version 22, IBM, New York USA).
Figure 2 Dissolved nitrogen pool relative to phosphorus.The ratio of dissolved nitrate and phosphate (A) and nitrate deficit (N∗= [NO−
3] −16[PO3−4 ]) (B) in waters of the study domain, including the
conti-nental shelf (white triangles), East Australian Current (EAC; grey circles), cyclonic cold-core eddy (CCE; black circles) and Tasman Sea (grey triangles).
a function of treatment, were determined using Similarity Percentage Analysis (SIMPER;
Clarke, 1993).
RESULTS
Oceanographic setting
During the voyage, the EAC was flowing southward along the continental shelf edge (Fig.
1B) with a core surface temperature of 23–24◦C. The EAC surface velocity was 1.2 m s−1
estimated from altimetry (Fig. 1B, arrows) with the current separating from the coast at ∼30◦S, forming the Tasman Front. The EAC station (Fig. 1B) had a temperature range of 21.4–22.5◦C and a salinity of 35.45–35.52 in the upper 200 m of the water-column.
The cyclonic eddy, south of the EAC station, was sampled on 25th October 2010 when it centred at 32◦S adjacent to the continental shelf. The CCE had a temperature range of
14.3–21.8◦C and a salinity of 35.26–35.54 in the upper 200 m of the water-column.
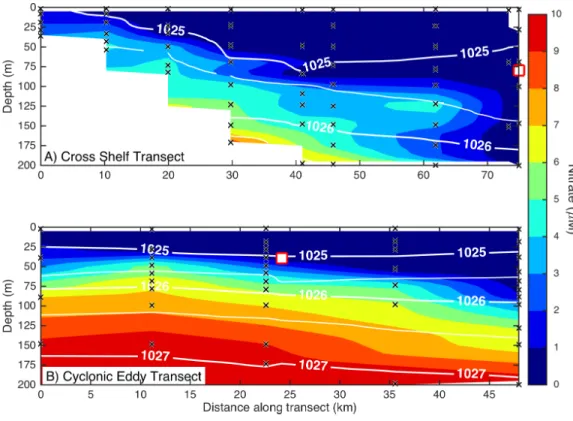
Dissolved macronutrient stocks indicated the potential for widespread N limitation in the EAC and adjacent shelf and Tasman Sea (offshore) waters (Fig. 2A), with nitrate deficit (N∗ = [NO−3] −16[PO34−]) occurring to at least 200 m (overall mean for all depths±SD
= −1.9±0.53µM;Fig. 2B). Oxidised N (nitrate) was detectable at the Chl-a fluorescence
maximum in the EAC (80 m) and CCE (41 m), ranging between 0.1 and 0.3µM (Fig. 3),
Figure 3 Eddy influence on vertical nutrient distribution.The distribution of dissolved nitrate (A) across the continental shelf to the East Australian Current, and (B) across the sampled cyclonic cold-core eddy. The white contours indicate seawater density, and the black crosses show the sampling locations for nitrate. The white squares indicate the water sampling locations for the nutrient amendment experiments.
Microbial community composition and diversity in different water masses
Initial Chl-a concentrations were relatively low (0.106 and 0.336 µg L−1), but distinct
(p-value <0.05), in the EAC and CCE, respectively (Table 1; t0Figs. 4Aand4B). The most abundant phototroph in the EAC was the cyanobacteriumProchlorococcus, whereas in the CCE it was Synechocccus(Fig. S1). A significant proportion of larger phototrophs in the EAC contained 19’-hexanoyloxyfucoxanthin (Hex-Fuco; t0Fig. 4E), exclusively found in haptophytes, including the coccolithophores (Liu et al., 2009). However, in the CCE, fucoxanthin (found in Phaeophyta and most other heterokonts), was the dominant accessory pigment, largely indicative of diatoms (t0Fig. 4D). Pigment ratios suggested the size structure of the EAC phototrophic community was dominated by pico- and nano-plankton (<2 µm) and in the CCE by microplankton (≥20µm; t0Fig. 5Aand
5B, respectively). Pigment richness was 30% higher in the CCE than in the EAC, and phototrophic alpha-diversity was∼40% higher (Shannon’s index calculated using HPLC pigment data=1.02±0.05 compared to 0.64±0.02 in the EAC; average±SD here and throughout).
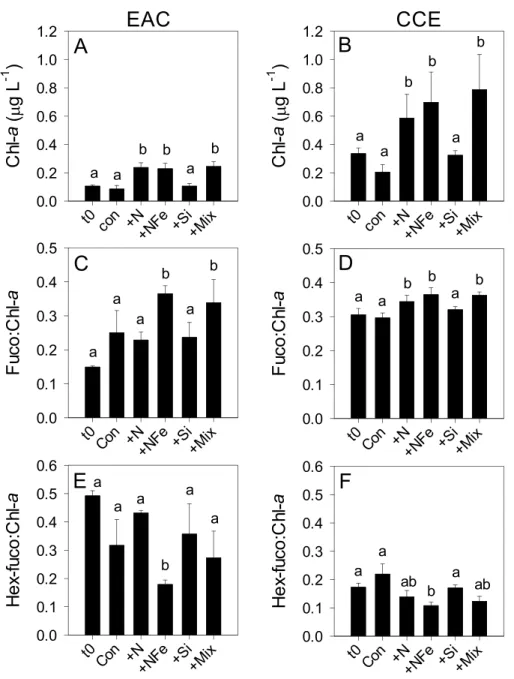
Figure 4 Phototrophic responses to nutrient amendment.Total Chl-a (monovinyl+divinyl), ratio of fucoxanthin to Chl-a and ratio of hex-fucoxanthin to Chl-a in the East Australian Current (EAC) (A, C and E, respecively) and cyclonic cold-core eddy (CCE) (B, D and F, respectively). These parameters are proxies for total phytoplankton biomass (Chl-a), relative biomass of diatoms (Fuco:Chl-a) and rela-tive biomass of haptophytes (Hex-fuco:Chl-a). Treatments include initial (t0) and after 3 days nutrient amendment: Con=control, no amendment;+N=nitrate;+NFe=nitrate+iron;+Si=silicate;+Mix
=nitrate+phosphate+silicate+iron. Values plotted are mean±standard deviation. Letters above bars indicate statistical differences amongst treatments (ANOVA,α=0.05) such that a is different to b, and ab is the same as a and b.
proportion of bacterial 16S rRNA sequences in both water masses belonged to the alpha-proteobacteria (SAR11 and SAR116 clade), Rhodobacteriaceae, as well asSynechococcus
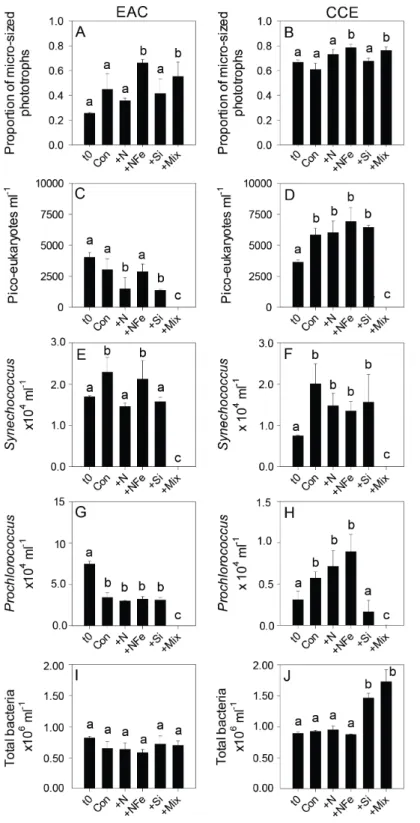
Figure 5 Phototrophic and total bacteria responses to nutrient amendment.Proportion of phototrophs larger than 20µm in the EAC (A) and CCE (B), abundance ofpicoeukaryotes(C and
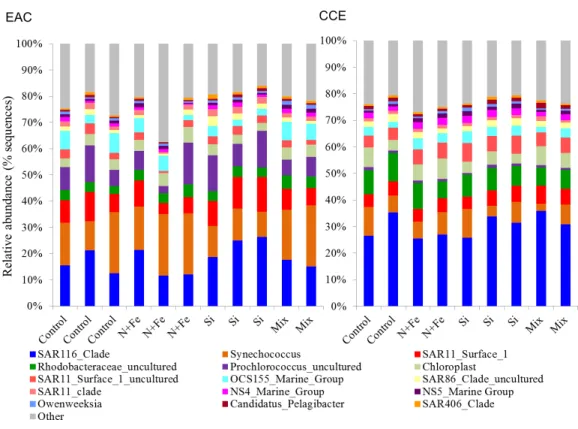
Figure 6 Relative abundance of 16S rRNA operational taxonomic units.Data are shown for sequences with≥97% sequence similarity to the SILVA database in the EAC (A) and CCE (B) amongst different treatments. For visual simplicity, only the top 15 OTUs are presented, with the upper grey bars represent-ing the remainrepresent-ing 16S sequences detected. Control=no amendment; N+Fe=addition of nitrate and iron (10µM and 1 nM, respectively), Si=addition of silicate (10µM) and Mix=addition of nitrate,
phosphate, silicate and iron (10µM, 0.625µM, 10µM, 1 nM, respectively).
CCE). HeterotrophicNifH gene sequences were detected in the EAC and were primarily attributable to members of the gamma-, beta-, and delta-proteobacteria. Initial CCE samples were not available (cryovials broken in storage); however control CCE treatments contained phototrophic and heterotrophic diazotrophs, includingTrichodesmium, UCYN-A and gamma-proteobacterialNifH sequences.
Nutrient-induced shifts in the phototrophic community
After 3 days, there was a large positive effect of NFe and the nutrient Mix (N, P, Si, Fe) on the total Chl-a concentration in the EAC community (Fig. 4A), which occurred alongside an increase in fucoxanthin relative to Chl a in the NFe and Mix treatments (p-value
≤0.026; Fig. 4C), suggesting a greater relative abundance of diatoms (Table 2). The
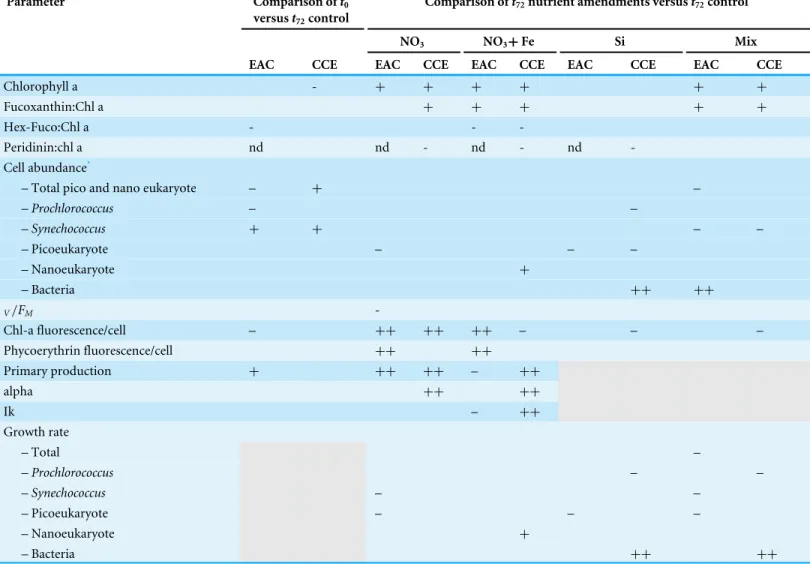
Table 2 Effect of experimental manipulation on microbial assemblages in the East Australian Current (EAC) and a cyclonic cold core eddy (CCE) as shown by comparison oft0witht72no amendment control, as well ast72nutrient amendments relative to controls.Treatments include
NO3(10µM nitrate final concentration), NO3+Fe (10µM nitrate and 1 nM Fe final concentration), Si (10µM final concentration), and Mix (N +Si+P+Fe; 10N : 10Si : 0.625PµM in Redfield proportions and 1 nM Fe respectively).++strong positive difference,p<0.01;+positive differ-ence,P<0.05; – strong negative difference,P<0.01;−negative difference,P<0.05; blank cells: no significant difference; nd: not detected; shaded cells: no measurement.
Parameter Comparison oft0
versust72control
Comparison oft72nutrient amendments versust72control
NO3 NO3+Fe Si Mix
EAC CCE EAC CCE EAC CCE EAC CCE EAC CCE
Chlorophyll a - + + + + + +
Fucoxanthin:Chl a + + + + +
Hex-Fuco:Chl a - -
-Peridinin:chl a nd nd - nd - nd
-Cell abundance*
– Total pico and nano eukaryote – + –
–Prochlorococcus – –
–Synechococcus + + – –
– Picoeukaryote – – –
– Nanoeukaryote +
– Bacteria ++ ++
V/FM
-Chl-a fluorescence/cell – ++ ++ ++ – – –
Phycoerythrin fluorescence/cell ++ ++
Primary production + ++ ++ – ++
alpha ++ ++
Ik – ++
Growth rate
– Total –
–Prochlorococcus – –
–Synechococcus – –
– Picoeukaryote – – –
– Nanoeukaryote +
– Bacteria ++ ++
Notes.
*Estimated from flow cytometry.
cell size increase into the micro size class (nominally ≥20µm) with N amendment
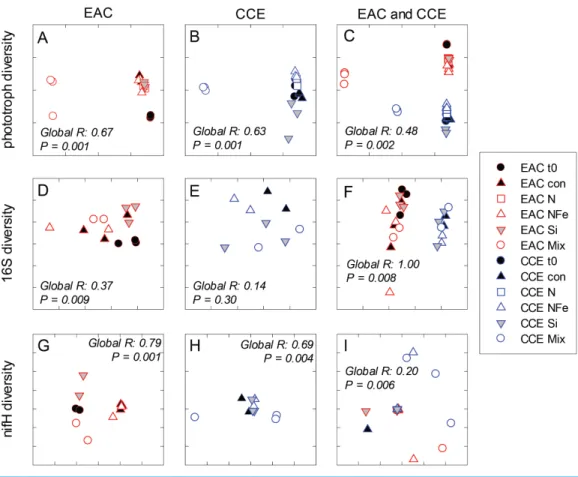
(p-value < 0.05;Fig. 5A), as estimated through pigment ratios (Uitz et al., 2008). Taken as a whole, the largest shift in phototrophic community composition and structure was in the mix treatment relative to all other treatments (SIMPER, >75% dissimilarity), which was attributed mainly to the decrease inpicoeukaryotes. Importantly, the EAC community was more similar to thet0CCE community after nutrient amendment, particularly with NFe addition (Global R=0.48,p-value < 0.05;Fig. 7C).
Figure 7 Diversity of microbial communities.Multi-dimensional Scaling (MDS) plots of phototrophs (A, B and C), bacteria (D, E and F) and diazotrophs (G, H and I) in the East Australian Current (EAC), cyclonic cold-core eddy (CCE) and both the EAC and CCE. Clustering of samples is based on a Bray-Curtis similarity matrix of square-root transformed HPLC pigment concentrations and flow cytometric counts of phototroph abundance, operational taxonomic units from 16S ribosomal genes or nitrogenase
NifHsubunit genes. Plots on the same row have the same axes scales, to make them directly comparable. Stress values for all plots are <0.10.
in the EAC, Fucoxanthin:Chl-a increased in NFe and Mix bottles (and in the N treatment), which was concomitant with a decline in haptophytes (Hexo-Fuco:Chl-a;Figs. 4Dand4F;
Table 2). There was a decrease inpicoeukaryotesin the Mix treatment relative to unamended
controls (Fig. 5D), as well as a measurable increase inProchlorococcuswith NFe amendment (Fig. 5H).Synechococcusshowed little effect of nutrient amendment in the CCE but declined when all nutrients were added together (p-value < 0.05;Fig. 5F;Table 2). Similar to the EAC, there was an overall increase in cell size of the CCE phototrophic assemblage into the micro size class with NFe and Mix amendment (p-value < 0.05;Fig. 5B). The Mix addition caused the greatest shift in cell size structure, decreasing the abundance of small cells by an order of magnitude (Fig. 5). Similar to the EAC community, the largest shift in phototrophic community composition and structure was in the Mix relative to all other treatments (SIMPER,≥55% dissimilarity), mainly due to the decrease inSynechococcus
Nutrient-induced shifts in the heterotrophic community
Nutrient-induced changes in the EAC bacterioplankton community were also detected by the end of the experiment (Figs. 5I,6,7). There was a significant (but relatively small) decrease in the relative abundance of sequences matching SAR11 Surface 1 and SAR116 clades, and an increase in relative abundance ofSynechococcuswith N, NFe, Mix addition, with the greatest dissimilarity in bacterial community composition observed between the
t0and NFe treatments (SIMPER, 29% dissimilarity). These shifts in SAR11, SAR116 and
Synechococcusrelative abundance contributed to 3, 2 and 2% dissimilarity between thet0 and NFe treatments respectively (Fig. 6; SIMPER). This pattern of increasingSynechococcus
sequence abundance was consistent with the patterns ofSynechococcusabundance revealed from flow cytometry (Fig. 5E). Within EAC nutrient addition treatments, the greatest dissimilarity was observed between bacterioplankton communities in the NFe and Si amendments (SIMPER, 29% dissimilarity). A relative decrease inSynechococcuswith Si, and an increase in the SAR116 clade andProchlorococcus, contributed 3, 2 and 2% to the dissimilarity between NFe and Si treatments, respectively (Fig. 6; SIMPER).
In the CCE bacterioplankton composition was distinct from the EAC in unamended controls after 3 days (ANOSIM, Global R: 1.00,p-value < 0.01;Fig. 7F), with the SAR116 clade and Rhodobacteraceae more abundant in the CCE than in the EAC, and SAR11 surface clade andProchlorococcusless abundant (Fig. 6A). Total heterotrophic bacterial abundance in the CCE doubled after 3 days with Si and Mix addition, unlike the EAC community (Figs. 5Iand5J). However, there was no appreciable shift in bacterioplankton diversity between nutrient addition treatments (Fig. 7E; ANOSIM, Global R: 0.14,p-value > 0.05).
Similar to the patterns observed in the overall bacterioplankton compositon, diazotroph diversity in the EAC shifted following nutrient amendment (ANOSIM, Global R: 0.79,
p-value=0.001;Fig. 7G). Nutrient addition shifted the composition of diazotrophs from gamma-, beta-, and delta-proteobacteria toward several Cluster 1 gamma-proteobacterial
NifH sequences (NifH OTU 608, 2012 and 95), sharing≥89% amino acid identity with
Pseudomonas stutzeri(Moisander et al., 2014;Moisander et al., 2012), which comprised negligible proportions of initial EACNifH sequences. Shifts in the relative abundance of the three different gamma-proteobacterial NifH OTUs contributed to a substantial proportion of the dissimilarity between diazotroph communities detected in EAC nutrient treatments. For example,NifH OTU608 dominated NFe bottles, comprising up to 97% of
NifH sequences and was responsible for 33% of the average dissimilarity betweent0and NFe (SIMPER, 83% total dissimilarity). In Si bottles,NifH OTU2012 represented up to 87% ofNifHsequences detected, and contributed 41% to the average dissimilarity between thet0and Si bottles (SIMPER, 65% dissimilarity). SimilarlyNifH OTU95 comprised up to 89% of NifH sequences in the Mix treatment and was responsible for 22% of the dissimilarity between thet0and diazotrophs in the Mix addition.
In contrast toNifH sequences retrieved from EAC nutrient treatments, the dominant
NifH OTU across CCE nutrient amendments was OTU2331, which shared 90% amino acid identity to the genusCoraliomargaritaof the Verrucomicrobia. In addition, sequences sharing 95%NifH amino acid identity withTrichodemsium erythraeum(OTU181) and
in the unamended CCE diazotroph assemblages, but no such cyanobacterialNifHsequences were present in the EAC. Differences in the relative abundance of these cyanobacterial diazotrophs were observed between treatments, such as an increase in OTU181 from a maximum of 15% in the control to 62% in the Si treatment, there were also significant shifts in diazotroph composition between nutrient addition treatments (Fig. 7H) (ANOSIM, Global R: 0.69,p-value=0.004). Notably, there were noNifH sequences detected in the CCE Mix treatment.
Time-dependent response to nutrient amendment: subcellular to community-level
Daily sampling of incubation bottles following nutrient amendment captured a cascade of effects at the cellular, population and community level, indicating differences in the speed of response by different microbes to nutrient resupply. Despite lower phytoplankton biomass, the EAC community took up∼10 times more nitrate than the CCE community within the first 24 h (Figs. 8Eand8F). Net nitrate uptake in the EAC (averaged over day 1–3) was greatest in the Mix (2.98±0.88µM d−1), and NFe and N treatments (∼2µM
d−1), but was <0.3
µM d−1in all other treatments. In the CCE, the level of nitrate uptake
was an order of magnitude lower, with rates ranging from 0.02 to 0.25µM d−1 (in the
control and Mix, respectively). Net phosphate uptake by both communities was relatively constant across nutrient amendments (∼0.1 and ∼0.01 µM d−1 in the EAC and CCE,
respectively), with the exception of 30% higher rates in the EAC Mix treatment (Fig. S3). Net silicate uptake rates in the EAC were greater than the CCE (∼0.1 vs∼0.05µM d−1,
respectively), with rates increasing significantly (≥6 times) when Si was added alone or with N, P and Fe (i.e., Mix treatment;Fig. S3). Total dissolved iron (TDFe) concentrations at the end of the experiment were 0.38±0.07 nM in the unamended EAC control bottles, and 1.32±0.23 nM in the CCE controls (Fig. S3), suggesting a strong Fe consumption and thus a limited Fe potential contamination in the experiment (spikes were 10 nM).
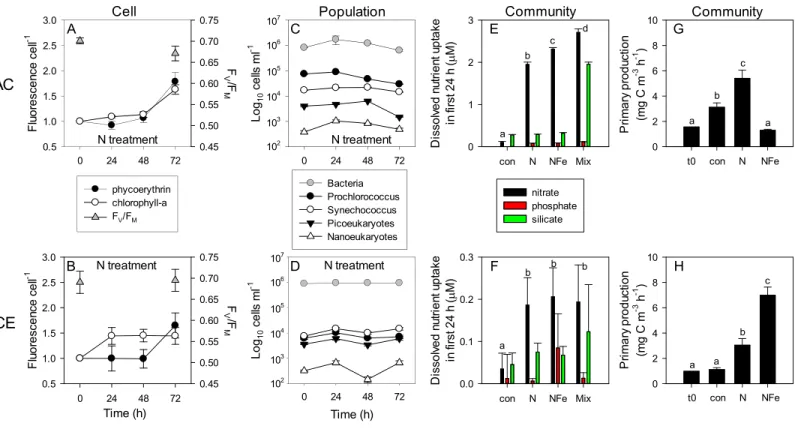
To illustrate the impact of nutrient amendment at the cellular, population and community level in the EAC and CCE,Fig. 8 shows time-dependent responses to the N treatment. The cellular pigment content (as estimated using flow cytometer fluorescence emission detected at red/orange wavelengths, corresponding to Chl-a/phycoerythrin) of EAC phototrophs in the N treatment was relatively constant over the first 48 h, but then increased in both phycoerythrin-containing prokaryotes and Chl-a-containing cells by
t72 (Fig. 8A;Tables 1and2). In the CCE, N addition caused rapid synthesis of Chl-a (but not phycoerythrin) in the first 24 h. By day 3 however, phycoerythrin-containing prokaryotes in the CCE had doubled their pigment content, in a manner that was similar to the observations in the EAC (Fig. 8B).
Figure 8 Time-course of microbial responses to nutrient addition.Daily chlorophyll-a and phycoerythrin fluorescence in small picoeukaryotes andSynechococcus, respectively under N amendment (A and B), together with photosynthetic efficiency (FV/FM) of the control phytoplankton as-semblage att0andt72; daily abundance of phototrophic and bacterial populations (C and D) in+N treatments in the EAC and CCE; rate of
macro-nutrient uptake in the first 24 h of incubation (E and F); total carbon fixation by the phytoplankton assemblage in different treatments on day 3 (G and H). Values plotted are mean±SD (n=3) except for plots C and D which are mean±SE (n=3). Letters above bars indicate statistical differ-ences amongst treatments (ANOVA,α=0.05) such that a is different to b, c and d.
experiment (−0.153 ±0.016 d−1;Table S2). In contrast, the abundance of all CCE phototroph populations increased within the first 24 h following N amendment (Fig. 8D), and yielded significant positive growth during the experiment (0.262±0.043d−1).
Co-addition of NFe resulted in a decrease in primary productivity in the EAC (0.4 fold change), but a 6.28 fold increase in primary productivity in the CCE. This suggests stronger limitation of primary productivity in the CCE, with a greater proportional increase inPmax with NFe compared to N addition.
DISCUSSION
The intensification of western boundary currents in the global ocean (Wu et al., 2012) raises significant questions about their impact on microbial composition and biogeochemical activity, particularly in light of the potential for WBCs to promote meso-scale eddy formation (Mata et al., 2007) and induce nutrient upwelling (Roughan & Middleton, 2002). Here we show clear differences in the vertical nutrient structure of a cyclonic cold-core eddy relative to adjacent waters, and an increase in microbial diversity and size structure of an eddy assemblage relative to an adjacent western boundary current, the EAC. Our results indicate that cyclonic eddies increase delivery of N to the upper ocean but also increase the biological demand for Fe that is necessary to sustain the growth of large-celled phototrophs and potentially support the diversity of diazotrophs over longer time-scales.
Responses of microbes to nutrient amendment
Previous studies in the Tasman Sea region have determined that surface phytoplankton communities are limited by N (Hassler et al., 2011; Hassler et al., 2014; Ellwood et al., 2013), and that diazotrophs (bacteria that are able to bypass nitrate limitation by fixing atmospheric N) inhabit waters to∼100 m following nutrient draw-down over the summer (Moisander et al., 2010). Our observations show that EAC phytoplankton sampled at 80 m below the surface are also N limited, and that upwards displacement of isopycnal surfaces induced by a cyclonic eddy introduces nutrients into the euphotic zone to alleviate potential N limitation (Fig. 4). Phytoplankton in the CCE (sampled at∼40 m) were also limited by N, but rates of carbon fixation more than doubled under NFe relative to N amendment, likely due to the different species composition underpinning primary productivity. In both water masses, a positive response in Chl-a was also seen with addition of N+Fe+Si+ P, suggesting co-limitation by multiple nutrients in both water masses, likely a result of different nutrient requirements by different phototrophs. Uplift of N together with Fe and other nutrients would therefore increase the rate of biomass production in the eddy as well as increase the relative abundance of diatoms, both of which could act to increase export production relative to adjacent waters.
magnitude more abundant in the EAC relative to the CCE, consistent with the warmer ‘‘tropical’’ signature of this western boundary current (Seymour et al., 2012), and declined in abundance in the Mix treatment. In the CCE samples,Prochlorococcussimilarly decreased in the Si and Mix treatments.Synechococcushad a positive response to bottle enclosure but unlike other studies (Moisander et al., 2012), we found that its abundance was similar in control and enriched treatments. Maximum net growth rates were observed in the eddy NFe bottles forProchlorococcus(0.345±0.047d−1), smallpicoeukaryotes(0.212±0.033d−1) and largepicoeukaryotes(i.e., nano-eukaryotes; 0.297±0.059d−1), but forSynechococcus, maximum growth was found in CCE controls (0.324±0.047d−1, relative to 0.194±0.035
d−1with NFe amendment).
Among the heterotrophic bacteria, initial EAC and CCE populations displayed similar abundance and alpha-diversity, and nutrient amendment lead to compositional shifts in both water masses. Addition of nitrate to the EAC community caused a doubling of total bacterial abundance within the first 24 h. Bacteria also became more abundant in the CCE community after 3 days within the Si and Mix bottles. Elevated bacterial abundance is likely to have arisen through increased dissolved organic matter (DOM) production by the resident community via several potential mechanisms: (1) mortality and cell lysis; (2) elevated rates of DOM release due to nutrient supplementation; and (3) altered microbial composition. While we did not measure rates of DOM production, our data certainly demonstrate coupling between autotrophs and heterotrophs, just as in a previous study (Baltar et al., 2010).
Diazotroph relative abundance and diversity
Across the global ocean, the main supply of nitrogen into surface waters is via transport from below the thermocline, but in many regions significant amounts of new nitrogen may also be supplied via nitrogen fixation (Capone et al., 2005;La Roche & Breitbarth, 2005). Our molecular analyses revealed the presence of heterotrophic gamma-proteobacterial diazotrophs in the sub-surface EAC microbial community, whereas cyanobacterial diazotrophs (i.e., Trichodesmiumand UCYN-A) were detected in the CCE. Given the relatively high iron requirement of diazotrophs (Kustka et al., 2003), as well as their low reliance on dissolved inorganic N, we expected to see a divergent response of the diazotrophs to nutrient amendment. Indeed, in the Mix bottles, diazotrophs became undetectable in the CCE samples, and were clearly outcompeted by the eukaryote phototrophs. Nutrient addition resulted inNifH OTU2331 becoming more prominent across CCE nutrient amendments. This OTU shares 90% amino acid identity to the genusCoraliomargarita
be correlated to DOC concentration, and to increase with Fe and P addition (Moisander et al., 2012). In contrast, the dominant diazotroph in the CCE was an OTU sharing 95%
NifH amino acid identity withTrichodemsium erythraeum(OTU181) and OTUs matching
Candidatus Atelocyanobacterium thalassa(UCYN-A; OTU1321 and OTU50). UCYN-A is the dominant diazotroph in the Coral Sea (source of the EAC) during the austral spring (Messer et al., 2015), and is also relatively abundant in the western South Pacific (Moisander et al., 2010). UCYN-A abundance has previously been shown to increase in response to Fe and organic carbon additions (Moisander et al., 2012), while Fe has also been shown to increase the rate of N2fixation by UCYN-A (Krupke et al., 2015).
Our observations demonstrate the presence of heterotrophic N2-fixing organisms in sub-surface waters with strong nitrate deficiency (but not necessarily low nitrate concentration;Fig. 2); however, a remaining research need is to conduct N2-fixation rate measurements in conjunction with diazotroph diversity assessment to verify whether this process represents a significant source of new N within and outside eddies, and whether changes in N2-fixation are due to a shift in diversity or a change inNifH expression. Physiological responses to nutrient supply
At the cellular level, N addition caused rapid pigment synthesis (doubling of normalised fluorescence per cell) in the CCE assemblage within the first 24 h after amendment, indicating that nutrient uplift could initially cause ‘greening’ in the absence of an increase in cellular biomass (Behrenfeld et al., 2015). By the end of our experiments, both phycoerythrin and Chl-a quotas increased in both water masses with N amendment, concomitant with an increase in total Chl-a, suggesting both pigment synthesis and biomass production contributed to elevated Chl-a. These observations are of obvious importance for the accurate interpretation of satellite and otherin situChl-a fluorescence data within meso-scale eddy features.
Photophysiological changes such as a decline in PSII turnover time, cross-sectional area and increased electron transport rates have been detected upon relief of nutrient limitation (Milligan, Aparicio & Behrenfeld, 2012). We detected minimal change in the photochemical efficiency (maximum quantum yield of PSII) with nutrient amendment, but there were measureable changes in the shape of the photosynthesis-irradiance (P–I) curve. Nitrate amendment of the EAC community increased light utilisation efficiency and light saturated photosynthetic rates, indicating increased photosynthetic electron transport and antenna size. Our flow cytometry data suggest that this was likely due to increased chlorophyll quota rather than an increase in cross sectional area (Fig. 7D). In the CCE community, the greatest change in carbon fixation (P–I) parameters was measured in the NFe treatment, suggesting an increase in PSII units per cell (detected via increased pigment quotas after 24 h), as well as an increase in total photosynthetic biomass, resulting in increased electron transport rates and light capturing capacity.
Nutrient uptake dynamics
with the opportunistic nutrient uptake strategies of phytoplankton in oligotrophic habitats (McCarthy & Goldman, 1979) and the theory that fast growing algae (with small cell size) are stimulated by short-term nutrient supply (Pedersen & Borum 1996). However, it is unlikely that such high nutrient uptake rates would be sustained in the EAC, largely because nutrient inputs (of the magnitude used in our experiments) are episodic and often coincide with major physical disturbances such as cyclones (e.g.,Law et al., 2011). A comparison of the initial EAC and CCE communities suggests that prolonged nutrient inputs within cyclonic eddies results in a shift toward larger cells which generally have greater capacity for nutrient storage and higher nutrient requirements for growth (Litchman et al., 2007).
Despite these potential experimental artefacts, the relative differences in nutrient demand between treatments show that maximum net uptake rates in both water masses occurred when all macronutrients were added together, compared to treatments which contained a surplus of N, P or Si relative to other macronutrients and iron. Under N amendment, uptake ratios of N:P in the EAC were∼20 compared to∼10 in the CCE, and uptake ratios of N:Si were∼10 and 4 in the EAC and CCE, respectively, but they were closer to Redfield (Si:N:Pi=1:1:16) in the Mix treatment (Fig. S2). This indicates that the vertical distribution of nutrients relative to one another will regulate microbial responses to eddy-induced uplift, as has been shown byBibby & Moore (2011)with respect to N:Si in the sub-tropical north Atlantic and central Pacific near Hawai’i.
CONCLUSIONS
Phytoplankton community structure plays an important role in the ecology and biogeochemistry of pelagic ecosystems including the export of organic matter to the deep ocean and the sequestration of carbon (Follows & Dutkiewicz, 2011;Karl et al., 2012). Here we show that cyclonic eddies enhance primary production in this WBC region by delivering nitrate to the upper ocean. The enhanced productivity was driven largely by an increase in the abundance of diatoms, with a concomitant decline in the abundance of haptophytes and peridinin-containing dinoflagellates.
ACKNOWLEDGEMENTS
We thank the officers and crew of theR/V Southern Surveyor and the Bio-optics voyage participants, particularly Massimo Pernice (Instituto de Ciencias del Mar- Consejo Superior de Investigacion Cientifica, Spain) for assistance with sampling, Andrew Bowie for dissolved Fe flow injection analyses, as well as Jennifer Clark (University of Technology Sydney) for flow cytometry analyses.
ADDITIONAL INFORMATION AND DECLARATIONS
Funding
This research was supported under the Australian Research Council’s Discovery Projects scheme (DP1092892 to CH and MD; DP140101340 to MD; DP120102764 to JRS and MVB and FT130100218 to JRS) and the Marine National Facility. While doing this work, CH and KP were supported by a UTS Chancellor’s fellowship, and JE by the NSW Science Leveraging Fund. The funders had no role in study design, data collection and analysis, decision to publish, or preparation of the manuscript.
Grant Disclosures
The following grant information was disclosed by the authors:
Australian Research Council’s Discovery Projects scheme: DP1092892, DP140101340, DP120102764, FT130100218.
Marine National Facility. UTS Chancellor’s fellowship. NSW Science Leveraging Fund.
Competing Interests
The authors declare there are no competing interests.
Author Contributions
• Martina A. Doblin and Katherina Petrou conceived and designed the experiments, performed the experiments, analyzed the data, wrote the paper, prepared figures and/or tables.
• Sutinee Sinutok and Lauren F. Messer analyzed the data, prepared figures and/or tables and reviewed drafts of the paper.
• Justin R. Seymour performed the experiments, analyzed the data, reviewed drafts of the paper.
• Mark V. Brown performed the experiments, analyzed the data. • Louiza Norman analyzed the data.
• Jason D. Everett and Allison S. McInnes analyzed the data, reviewed drafts of the paper. • Peter J. Ralph contributed reagents/materials/analysis tools, reviewed drafts of the paper. • Peter A. Thompson contributed reagents/materials/analysis tools.
Data Availability
The following information was supplied regarding data availability:
Accession numbers for sequence data in the NCBI Sequence Read Archive are
SRR3275263 (nifH) and SRR3275264 (16S). All the other data from the study are
available on the University of Technology Sydney data repository and data is provided as Supplemental Information.
Supplemental Information
Supplemental information for this article can be found online athttp://dx.doi.org/10.7717/ peerj.1973#supplemental-information.
REFERENCES
Acosta Martinez V, Dowd SE, Sun Y, Allen V. 2008.Tag-encoded pyrosequencing analy-sis of bacterial diversity in a single soil type as affected by management and land use.
Soil Biology and Biochemistry40(11):2762–2770DOI 10.1016/j.soilbio.2008.07.022. Altschul S, Gish W, Miller W, Myers E, Lipman D. 1990.Basic local alignment search
tool.Journal of Molecular Biology215:403–410DOI 10.1016/S0022-2836(05)80360-2. Baltar F, Arístegui J, Gasol JM, Lekunberri I, Herndl GJ. 2010.Mesoscale eddies:
hotspots of prokaryotic activity and differential community structure in the ocean.
The ISME Journal4:975–988DOI 10.1038/ismej.2010.33.
Barlow RG, Stuart V, Lutz V, Sessions H, Sathyendranath S, Platt T, Kyewalyanga M, Clementson L, Fukasawa M, Watanage S, Devred E. 2007.Seasonal pigment patterns of surface phytoplankton in the subtropical southern hemisphere.Deep-Sea Research I54:1687–1703DOI 10.1016/j.dsr.2007.06.010.
Behrenfeld M. 2011.Biology: uncertain future for ocean algae.Nature Climate Change
1:33–34DOI 10.1038/nclimate1069.
Behrenfeld MJ, O’Malley RT, Boss ES, Westberry TK, Graff JR, Halsey KH, Milligan AJ, Siegel DA, Brown TB. 2015.Revaluating ocean warming impacts on global phytoplankton.Nature Climate Change 6:323–330DOI 10.1038/NCLIMATE2838. Bibby TS, Gorbunov MY, Wyman KW, Falkowski PG. 2008.Photosynthetic community
responses to upwelling in mesoscale eddies in the subtropical North Atlantic and Pacific Oceans.Deep-Sea Research II55:1310–1320DOI 10.1016/j.dsr2.2008.01.014. Bibby TS, Moore CM. 2011.Silicate:nitrate ratios of upwelled waters control the
phytoplankton community sustained by mesoscale eddies in sub-tropical North Atlantic and Pacific.Biogeosciences8:657–666DOI 10.5194/bg-8-657-2011. Brzezinski MA, Nelson DM. 1989.Seasonal changes in the silicon cycle within a Gulf
Stream warm-core ring.Deep-Sea Research36:1009–1023 DOI 10.1016/0198-0149(89)90075-7.
Caporaso J, Kuczynski J, Stombaugh J, Bittinger K, Bushman F, Costello EK, Fierer N, Peña AG, Goodrich JK, Gordon JI, Huttley GA, Kelley ST, Knights D, Koenig JE, Ley RE, Lozupone CA, McDonald D, Muegge BD, Pirrung M, Reeder J, Sevinsky JR, Turnbaugh PJ, Walters WA, Widmann J, Yatsunenko T, Zaneveld J, Knight R. 2010.QIIME allows analysis of high-throughput community sequencing data.
Nature Methods7:335–336 DOI 10.1038/nmeth.f.303.
Chelton DB, Schlax MG, Samelson RM. 2011.Global observations of nonlinear mesoscale eddies.Progress in Oceanography 91:167–216
DOI 10.1016/j.pocean.2011.01.002.
Clarke K. 1993.Non-parametric multivariate analyses of changes in community structure.Australian Journal of Ecology18:117–143
DOI 10.1111/j.1442-9993.1993.tb00438.x.
Clarke K, Warwick R. 2001.Change in marine communities: an approach to statistical analysis and interpretation. 2nd edition. Plymouth: PRIMER-E Ltd.Available at
http:// www.opengrey.eu/ item/ display/ 10068/ 595716(accessed 14 January 2014).
Cowley R, Critchley G, Eriksen R, Latham V, Plaschke R, Rayner M, Terhell D. 1999. CSIRO marine laboratories report 236 hydrochemistry operations manual. Technical report. Hobart, Australia: CSIRO Marine Laboratories.
Deutsch C, Weber T. 2012.Nutrient ratios as a tracer and driver of ocean biogeochem-istry.Annual Review of Marine Science4:113–141
DOI 10.1146/annurev-marine-120709-142821.
Doblin MA, Ralph PJ, Petrou KL, Shelly K, Westwood K, Van den Enden R, Wright S, Griffiths B. 2011.Diel variation of chl-a fluorescence, phytoplankton pigments and productivity in the Sub-Antarctic Zone.Deep Sea Research II: Topical Studies in Oceanography 58:2189–2199DOI 10.1016/j.dsr2.2011.05.021.
Dowd SE, Callaway TR, Wolcott RD, Sun Y, McKeehan T, Hagevoort RG, Edrington TS. 2008.Evaluation of the bacterial diversity in the feces of cattle using 16S rDNA bacterial tag-encoded FLX amplicon pyrosequencing (bTEFAP).BMC Microbiology
8:125 DOI 10.1186/1471-2180-8-125.
Edgar RC. 2010.Search and clustering orders of magnitude faster than BLAST. Bioinfor-matics26:2460–2461DOI 10.1093/bioinformatics/btq461.
Ellwood MJ, Law CS, Hall J, Boyd PW. 2013.Relationships between nutrient stocks and inventories and phytoplankton physiological status along an oligotrophioc meridional transect in the Tasman Sea.Deep-Sea Research I 72:102–120 DOI 10.1016/j.dsr.2012.11.001.
Everett JD, Baird ME, Oke PR, Suthers IM. 2012.An avenue of eddies: quantifying the biophysical properties of mesoscale eddies in the Tasman sea.Geophysical Research Letters39: L16608DOI 10.1029/2012GL053091.
Everett JD, Baird ME, Roughan M, Suthers IM, Doblin MA. 2014.Relative impact of seasonal and oceanographic drivers of surface chlorophyll-a along a western boundary current.Progress in Oceanography120:340–351
Farnelid H, Andersson AF, Bertilsson S, Al-Soud WA, Hansen LH, Sørensen S, Steward GF, Hagström Å, Riemann L. 2011.Nitrogenase gene amplicons from global marine surface waters are dominated by genes of non-cyanobacteria.PLoS ONE6:e19223 DOI 10.1371/journal.pone.0019223.
Farnelid H, Bentzon-Tilia M, Andersson AF, Bertilsson S, Jost G, Labrenz M, Jür-gens K, Riemann L. 2013.Active nitrogen-fixing heterotrophic bacteria at and below the chemocline of the central Baltic Sea.The ISME Journal7:1413–1423 DOI 10.1038/ismej.2013.26.
Fish JA, Chai B, Wang Q, Sun Y, Brown CT, Tiedje JM, Cole JR. 2013.FunGene: the functional gene pipeline and repository.Frontiers of Microbiology4:1–14 DOI 10.3389/fmicb.2013.00291.
Follows MJ, Dutkiewicz S. 2011.Modeling Diverse Communities of Marine Microbes.
Annual Review of Marine Science3:427–451 DOI 10.1146/annurev-marine-120709-142848.
Gasol JM, Del Giorgio PA. 2000.Using flow cytometry for counting natural planktonic bacteria and understanding the structure of planktonic bacterial communities.
Scientifica Marina64:197–224.
Gaube P, McGillicuddy Jr DJ, Chelton DB, Behrenfeld MJ, Strutton PG. 2014.Regional variations in the influence of mesoscale eddies on near-surface chlorophyll.Journal of Geophysical Research Oceans119:8195–8220DOI 10.1002/2014JC010111.
Hagino K, Onuma R, Kawachi M, Horiguchi T. 2013.Discovery of an Endosymbiotic Nitrogen-Fixing Cyanobacterium UCYN-A inBraarudosphaera bigelowii (Prymne-siophyceae).PLoS ONE8:e81749DOI 10.1371/journal.pone.0081749.
Hassler C, Djajadikarta RJ, Doblin MA, Everett JD, Thompson P. 2011. Characterisa-tion of water masses and nutrient limitaCharacterisa-tion of phytoplankton in the separaCharacterisa-tion zone of the East Australian Current in spring 2008.Deep Sea Research II, Special Issue on East Australian Current 58:664–677DOI 10.1016/j.dsr2.2010.06.008.
Hassler CS, Ridgway K, Bowie AR, Butler ECV, Clementson L, Doblin MA, Ralph P, Law CS, Davies DM, Van der Merwe P, Watson R, Ellwood MJ. 2014.Primary pro-ductivity induced by Iron and Nitrogen in the Tasman Sea-an overview of the PINTS expedition.Marine and Freshwater Research65:517–537 DOI 10.1071/MF13137. Honjo S, Dymond J, Collier R, Manganini SJ. 1995.Export production of particles to the
interior of the equatorial Pacific Ocean during the 1992 EqPac experiment.Deep Sea Research II 42:831–870DOI 10.1016/0967-0645(95)00034-N.
Karl DM, Church MJ, Doreb JE, Letelier RM, Mahaffey C. 2012.Predictable and efficient carbon sequestration in the North Pacific Ocean supported by symbiotic nitrogen fixation.Proceedings of the National Academy of Sciences of the United States of America109:1842–1849DOI 10.1073/pnas.1120312109.
Krupke A, Mohr W, LaRoche J, Fuchs BM, Amann RI, Kuypers MM. 2015.The effect of nutrients on carbon and nitrogen fixation by the UCYN-A-haptophyte symbiosis.
The ISME Journal9:1635–1647DOI 10.1038/ismej.2014.253.
marine cyanobacteriumTrichodesmiumspp. (cyanophyta).Journal of Phycology
39:12–25DOI 10.1046/j.1529-8817.2003.01156.x.
La Roche J, Breitbarth E. 2005.Importance of diazotrophs as a source of new nitrogen in the ocean.Journal of Sea Research53:67–69DOI 10.1016/j.seares.2004.05.005. Langlois RJ, LaRoche J, Raab PA. 2005.Diazotrophic diversity and distribution in the
tropical and subtropical Atlantic Ocean.Applied and Environmental Microbiology
71:7910–7919DOI 10.1128/AEM.71.12.7910-7919.2005.
Law CS, Woodward EMS, Ellwood MJ, Marriner A, Bury SJ, Safi KA. 2011. Re-sponse of surface nutrient inventories and nitrogen fixation to a tropical cy-clone in the southwest Pacific.Limnology and Oceanography56:1372–1385 DOI 10.4319/lo.2011.56.4.1372.
Liu H, Probert I, Uitz J, Claustre H, Aris-Brosou S, Frada M, Not F, De Vargas C. 2009. Extreme diversity in noncalcifying haptophytes explains a major pigment paradox in open oceans.Proceedings of the National Academy of Sciences of the United States of America106:12803–12808DOI 10.1073/pnas.0905841106.
Litchman E, Klausmeier CA, Schofield OM, Falkowski PG. 2007.The role of functional traits and trade-offs in structuring phytoplankton communi-ties: scaling from cellular to ecosystem level.Ecology Letters10:1170–1181 DOI 10.1111/j.1461-0248.2007.01117.x.
Marie D, Partensky F, Jacquet S, Vaulot D. 1997.Enumeration and cell cycle analysis of natural populations of marine picoplankton by flow cytometry using the nucleic acid stain SYBR Green I.Applied Environmental Microbiology 63:186–193.
Mata MM, Wijffels S, Tomczak M, Church JA. 2007.Eddy shedding and energy conversions in the East Australian Current.Journal of Geophysical Research111: C09034DOI 10.1029/2006JC003592.
Matear RJ, Chamberlain MA, Sun C, Feng M. 2013.Climate change projection of the Tasman Sea from an Eddy-resolving Ocean Model.Journal of Geophysical Research Oceans118:2961–2976DOI 10.1002/jgrc.20202.
McCarthy JJ, Goldman JC. 1979.Nitrogenous nutrition of marine phytoplankton in nutrient-depleted waters.Science203:670–672 DOI 10.1126/science.203.4381.670. McGillicuddy Jr DJ. 2016.Mechanisms of physical-biological-biogeochemical
inter-action at the oceanic mesoscale.Annual Review of Marine Science8:13.1–13.36 DOI 10.1146/annurev-marine-010814-015606.
McGillicuddy DJ, Robinson AR, Siegel DA, Jannasch HW, Johnson R, Dickey TD, McNeil J, Michaels AF, Knap AH. 1998.Influence of mesoscale eddies on new production in the Sargasso Sea.Nature 394:263–265DOI 10.1038/28367. Messer LF, Mahaffey C, Robinson C, Jeffries TC, Baker KG, Bibiloni Isaksson J,
Milligan AJ, Aparicio UA, Behrenfeld MJ. 2012.Fluorescence and nonphotochemical quenching responses to simulated vertical mixing in the marine diatomThalassiosira weissflogii.Marine Ecology Progress Series448:67–78DOI 10.3354/meps09544. Moisander PH, Beinart RA, Hewson I, White AE, Johnson KS, Carlson CA, Montoya
JP, Zehr JP. 2010.Unicellular cyanobacterial distributions broaden the oceanic N2 fixation domain.Science327:1512–1514DOI 10.1126/science.1185468.
Moisander PH, Serros T, Paerl RW, Beinart R, Zehr JP. 2014.Gammaproteobacterial diazotrophs andnifH gene expression in surface waters of the South Pacific Ocean.
The ISME Journal8:1962–1973DOI 10.1038/ismej.2014.49.
Moisander PH, Zhang R, Boyle E, Hewson I, Montoya JP, Zehr JP. 2012.Analogous nutrient limitations in unicellular diazotrophs andProchlorococcusin the South Pacific Ocean.The ISME Journal6:733–744DOI 10.1038/ismej.2011.152.
Moore CM, Mills MM, Arrigo KR, Berman-Frank I, Bopp L, Boyd PW, Galbraith ED, Geider RJ, Guieu C, Jaccard SL, Jickells TD, La Roche J, Lenton TM, Mahowald NM, Marañón E, Marinov I, Moore JK, Nakatsuka T, Oschlies A, Saito MA, Thingstad TF, Tsuda A, Ulloa O. 2013.Processes and patterns of oceanic nutrient limitation.Nature Geoscience6:701–710 DOI 10.1038/ngeo1765.
Pedersen MF, Borum J. 1996.Nutrient control of algal growth in estuarine waters. Nutrient limitation and the importance of nitrogen requirements and nitrogen storage among phytoplankton and species of macroalgae.Marine Ecology Progress Series142:261–272DOI 10.3354/meps142261.
Platt T, Gallegos CL, Harrison WG. 1980.Photoinhibition of photosynthesis in natural assemblages of marine phytoplankton.Journal of Marine Research38:687–701. Quast C, Pruesse E, Yilmaz P, Gerken J, Schweer T, Yarza P, Peplies J,
Glock-ner FO. 2013.The SILVA ribosomal RNA gene database project: improved data processing and web-based tools.Nucleic Acids Research41:D590–D596 DOI 10.1093/nar/gks1219.
Ridgway K, Godfrey J. 1997.Seasonal cycle of the East Australian Current.Journal of Geophysical Research102:22,921–22,936DOI 10.1029/97JC00227.
Roughan M, Middleton J. 2002.A comparison of observed upwelling mecha-nisms off the east coast of Australia.Continental Shelf Research22:2551–2572 DOI 10.1016/S0278-4343(02)00101-2.
Schreiber U. 2004. Pulse-Amplitude-Modulation (PAM) fluorometry and saturation pulse method: an overview. In: Papageorgiou G, Govindjee, eds.Chlorophyll a fluorescence: a signature of photosynthesis. Dordrecht: Springer, 279–319. Seymour JR, Doblin MA, Jeffries TC, Brown MV, Newton K, Ralph PJ, Baird M,
Mitchell JG. 2012.Contrasting microbial assemblages in adjacent water-masses associated with the East Australian Current.Environmental Microbiology Reports
4:548–555DOI 10.1111/j.1758-2229.2012.00362.x.
Uitz J, Huot Y, Bruyant G, Babin M, Claustre H. 2008.Relating phytoplankton pho-tophysiological properties to community structure on large scales.Limnology and Oceanography 53:614–630DOI 10.4319/lo.2008.53.2.0614.
Waite AM, Pesant S, Griffin DA, Thompson PA, Holl CM. 2007.Oceanography, primary production and dissolved inorganic nitrogen uptake in two Leeuwin Current eddies.Deep-Sea Research II 54:981–1002DOI 10.1016/j.dsr2.2007.03.001. Wang Q, Quensen III JF, Fish JA, Lee TK, Sun Y, Tiedje JM, Cole JR. 2013.Ecological
patterns ofnifHgenes in four terrestrial climatic zones explored with targeted metagenomics using FrameBot, a new informatics tool.mBio4:e00592-13 DOI 10.1128/mBio.00592-13.
Wu L, Cai W, Zhang L, Nakamura H, Timmermann A, Joyce T, McPhaden MJ, Alexan-der M, Qiu B, Visbeck M, Chang P, Giese B. 2012.Enhanced warming over the global subtropical western boundary currents.Nature Climate Change2:161–166 DOI 10.1038/nclimate1353.
Zehr J, Jenkins B, Short S, Steward G. 2003.Nitrogenase gene diversity and microbial community structure: a cross system comparison.Environmental Microbiology
5:539–554DOI 10.1046/j.1462-2920.2003.00451.x.
Zehr J, McReynolds L. 1989.Use of degenerate oligonucleotides for amplification of thenifHgene from the marine cyanobacteriumTrichodesmium thiebautii.Applied Environmental Microbiology55:2522–2526.
Zehr JP, Mellon MT, Hiorns WD. 1997.Phylogeny of cyanobacterialnifHgenes: evolu-tionary implications and potential applications to natural assemblages.Microbiology
143:1443–1450DOI 10.1099/00221287-143-4-1443.
Zehr J, Turner P. 2001.Nitrogen fixation: nitrogenase genes and gene expression.
![Figure 2 Dissolved nitrogen pool relative to phosphorus. The ratio of dissolved nitrate and phosphate (A) and nitrate deficit (N ∗ = [NO − 3 ] − 16[PO 3−4 ]) (B) in waters of the study domain, including the conti-nental shelf (white triangles), East Austr](https://thumb-eu.123doks.com/thumbv2/123dok_br/18131509.325382/9.918.276.857.121.535/dissolved-nitrogen-relative-phosphorus-dissolved-phosphate-including-triangles.webp)