Submitted18 December 2015 Accepted 15 March 2016 Published30 March 2016
Corresponding author Orlando Schwery, [email protected]
Academic editor Mihai Pop
Additional Information and Declarations can be found on page 5
DOI10.7717/peerj-cs.56
Copyright
2016 Schwery and O’Meara
Distributed under
Creative Commons CC-BY 4.0
OPEN ACCESS
MonoPhy
: a simple R package to find and
visualize monophyly issues
Orlando Schwery and Brian C. O’Meara
Department of Ecology and Evolutionary Biology, University of Tennessee, Knoxville, TN, USA
ABSTRACT
Background.The monophyly of taxa is an important attribute of a phylogenetic tree. A lack of it may hint at shortcomings of either the tree or the current taxonomy, or can indicate cases of incomplete lineage sorting or horizontal gene transfer. Whichever is the reason, a lack of monophyly can misguide subsequent analyses. While monophyly is conceptually simple, it is manually tedious and time consuming to assess on modern phylogenies of hundreds to thousands of species.
Results.The R packageMonoPhyallows assessment and exploration of monophyly of taxa in a phylogeny. It can assess the monophyly of genera using the phylogeny only, and with an additional input file any other desired higher order taxa or unranked groups can be checked as well.
Conclusion.Summary tables, easily subsettable results and several visualization options allow quick and convenient exploration of monophyly issues, thus makingMonoPhya valuable tool for any researcher working with phylogenies.
SubjectsBioinformatics, Computational Biology
Keywords Phylogeny, Evolution, Monophyly, R package, Taxonomy, Rogue taxa, Tree conflict, Horizontal gene transfer, Incomplete lineage sorting
INTRODUCTION
Phylogenetic trees are undoubtedly crucial for most research in ecology or evolutionary biology. Whether one is studying trait evolution (e.g.,Coddington, 1988;Donoghue, 1989), diversification (e.g.,Gilinsky & Good, 1991;Hey, 1992), phylogeography (Avise et al., 1987), or simply relatedness within a group (e.g.,Czelusniak et al., 1982;Shochat & Dessauer, 1981;
assess whether the established taxa are monophyletic. A lack of group monophyly however, can also be an indicator for conflict between gene trees and the species tree, which may be a result of incomplete lineage sorting or horizontal gene transfer. In any case, monophyly issues in a phylogeny suggest a potential error that can affect downstream analysis and inference. For example, it will mislead ancestral trait or area reconstruction or introduce false signals when assigning unsampled diversity for diversification analyses (e.g., in diversitree (FitzJohn, 2012) or BAMM (Rabosky, 2014)). In general, a lack of monophyly can blur patterns we might see in the data otherwise.
As this problem is by no means new, approaches to solve it have been developed earlier, particularly for large scale sequencing projects in bacteria and archaea, for which taxonomic issues are notoriously challenging. The program GRUNT (Dalevi et al., 2007) uses a tip to root walk approach to group, regroup, and name clades according to certain user defined criteria. The subsequently developed ‘taxonomy to tree’ approach (McDonald et al., 2012) matches existing taxonomic levels onto newly generated trees, allowing classification of unidentified sequences and proposal of changes to the taxonomic nomenclature based on tree topology. Finally,Matsen & Gallagher (2012)have developed algorithms that find mismatches between taxonomy and phylogeny using a convex subcoloring approach.
The new tool presented here, the R packageMonoPhy, is a quick and user-friendly method for assessing monophyly of taxa in a given phylogeny. While the R packageape (Paradis, Claude & Strimmer, 2004) already contains the helpful functionis.monophyletic, which also enables testing for monophyly, the functionality ofMonoPhy is much broader. Apart from assessing monophyly for all groups and focal taxonomic levels in a tree at once, MonoPhy is also not limited to providing a simple ‘yes-or-no’ output, but rather enables the user to explore underlying causes of non-monophyly. In the following, we outline the structure and usage of the package and provide examples to demonstrate its functionality. For a more usage-focused and application-oriented treatment, one should refer to the tutorial vignette (vignette(‘‘MonoPhyVignette’’)), which contains stepwise instructions for the different functions and their options. For any other package details, consult the documentation (help(‘‘MonoPhy’’)).
DESCRIPTION
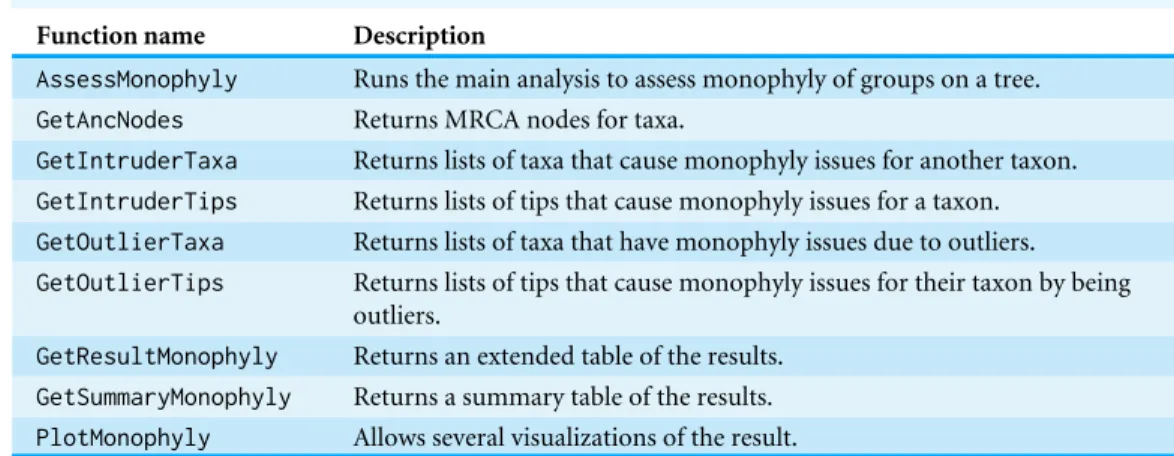
Table 1 Functions of the packageMonoPhy.
Function name Description
AssessMonophyly Runs the main analysis to assess monophyly of groups on a tree. GetAncNodes Returns MRCA nodes for taxa.
GetIntruderTaxa Returns lists of taxa that cause monophyly issues for another taxon. GetIntruderTips Returns lists of tips that cause monophyly issues for a taxon. GetOutlierTaxa Returns lists of taxa that have monophyly issues due to outliers. GetOutlierTips Returns lists of tips that cause monophyly issues for their taxon by being
outliers.
GetResultMonophyly Returns an extended table of the results. GetSummaryMonophyly Returns a summary table of the results. PlotMonophyly Allows several visualizations of the result.
descendants of its MRCA. If there are more descendants than taxon members, the function will identify and list the tips that do not belong to the focal taxon and we then call these tips ‘intruders.’ Accordingly, we will further refer to the taxa whose monophyly was disrupted by these ‘intruders’ as ‘intruded.’ Note that if two taxa are reciprocally disrupting each other’s monophyly, certain tips of intruded taxa will often be intruders themselves: if the phylogeny is ((A1, B1), (A2, B2)), where A and B are genera, it is not clear if the A tips are intruding in B or the B tips are intruding in A.
Biologically, identifying a few intruders may suggest that the definition of a group should be expanded; observing some group members in very different parts of the tree than the rest of their taxon may instead suggest that these individuals were misidentified, that their placement is the result of contaminated sequences or due to horizontal gene transfer between members of two remote clades. Moreover, the approach as described above would suggest that the clades that are intruded by the outlier tips would in turn be intruders to the taxon the outliers belong to, which intuitively would not make sense. We thus implemented an option to specify a cutoff value, which defines the minimal proportion of tips among the descendants of a taxon’s MRCA that are labeled as being actual members of that taxon. If a given group falls below this value, the function will find the ‘core clade’ (a subclade for which the proportion matches or exceeds the cutoff value) by moving tipward, always following the descendant node with the greater number of tips in the focal taxon (absolute, relative if tied), and at each step evaluating the subtree rooted at that node to see if it exceeds the cutoff value. Once such a subtree is found, it is then called the ‘core clade’, and taxon members outside this clade are then called ‘outliers’. As there is no objective criterion to decide at what point individuals should be considered outliers, a reasonable cutoff value must be chosen by the user.
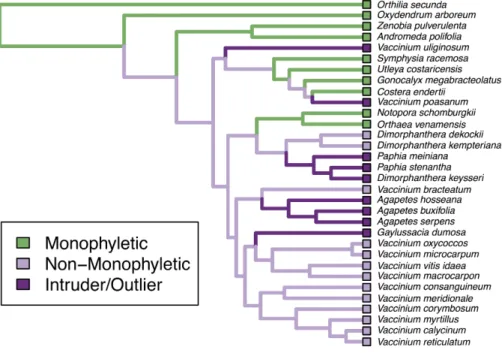
Figure 1 Monophyly plot of the genera of Ericaceae.Close-up on subfamily Vaccinioideae only. Branches of the tree coloured according to monophyly status. We can see thatVacciniumhas two outliers and that its intruders arePaphia,Dimorphanthera,AgapetesandGaylussacia.
All inference results are stored in a solution object, from which the other functions can extract information (e.g., summary tables, intruder and outlier lists) for one or more higher-level taxa of interest.PlotMonophylyreconstructs and plots the monophyly state of the tips usingphytools (Revell, 2012). Apart from the basic monophyly plot (Fig. 1), branches can be coloured according to taxonomic groups or to highlight intruders and outliers. Monophyletic groups can be collapsed and plots can be saved directly to PDF to facilitate the visualization of large trees.
It is important to remember that the results produced by the package are merely the product of the used phylogeny and the available taxonomic information. It thus only makes the mismatches between those accessible, but does not reveal any more than that. The decision of whether the result suggests problems in the phylogeny or the taxonomy, whether a tip should be considered a rogue taxon and be removed or whether gene tree-species tree conflicts should be investigated, is entirely up to the user’s judgment.
MonoPhy is available through CRAN (https://cran.r-project.org/package=MonoPhy/) and is developed on GitHub (https://github.com/oschwery/MonoPhy). Intended extensions and fixes can be seen in the issues list of the package’s GitHub page. Among the planned extensions of the package are: multiple trees, displaying the result for specific subtrees, proposing monophyletic subgroups, enabling formal tests for monophyly (incorporating clade support) and providing increased plot customizability.
EXAMPLES
original data, seeSchwery et al., 2014) and two taxon files assigning tribes and subfamilies to the tips (in both files, errors have been introduced for demonstration purposes; see code and output for both examples inSupplemental Information 1). Running the main analysis commandAssessMonophylyon genus level (i.e., tree only) and tribe level (i.e., tree plus taxonomy file) using standard settings took 0.045 and 0.093 s respectively on a MacBook Pro with 2.4 GHz Intel Core i5 and 8 GB Ram. We could now use the remaining commands to extract the information of interest from the saved output object (e.g., summary tables, lists of problem taxa, etc.). The basic monophyly plot for the genus level analysis is displayed for a subclade of the tree inFig. 1(the figure of the full tree is shown inFig. S1).
For the second example, we demonstrate the package’s performance on a tree of 31,749 species of Embriophyta (Zanne et al., 2014; data seeZanne et al., 2013), using an outlier-cutoff of 0.9 this time. Just checking monophyly for genera took 1.78 h, but revealed that 22% of genera on the tree are not monophyletic, while around half of all genera are only represented by one species each. Furthermore, we can see that the largest monophyletic genus is Iris(139 tips), that Justicia had the most intruders (13 tips) and thatAcacia produced the most outliers (99 tips). Finally, with 2,337 other tips as descendants of their MRCA, the 3 species ofAldinaare most spread throughout the tree.
CITATION
Researchers usingMonoPhyin a published paper should cite this article and indicate the used version of the package. The citation information for the current package version can be obtained usingcitation(‘‘MonoPhy’’).
ACKNOWLEDGEMENTS
We want to thank the members of the O’Meara lab for helpful discussions, Frederik Matsen IV and two anonymous reviewers for well-considered criticism to improve the manuscript, Brian Looney and Sam Borstein for beta testing, and the members of the Tank lab, Arne Mooers, Karen Cranston, Bruce Cochrane and Daniel Gates for great ideas on increasing the usefulness of this package.
ADDITIONAL INFORMATION AND DECLARATIONS
Funding
This work has been supported via a GTA to OS by the University of Tennessee, Knoxville. The funders had no role in study design, data collection and analysis, decision to publish, or preparation of the manuscript.
Grant Disclosures
The following grant information was disclosed by the authors: University of Tennessee, Knoxville.
Competing Interests
Author Contributions
• Orlando Schwery conceived and designed the experiments, performed the experiments,
analyzed the data, contributed materials/analysis tools, and wrote the paper, prepared figures and tables, performed the computation work.
• Brian C. O’Meara contributed materials/analysis tools, and wrote the paper.
Data Availability
The following information was supplied regarding data availability: CRAN:https://cran.r-project.org/package=MonoPhy/
GitHub:https://github.com/oschwery/MonoPhy.
Supplemental Information
Supplemental information for this article can be found online athttp://dx.doi.org/10.7717/ peerj-cs.56#supplemental-information.
REFERENCES
Avise JC, Arnold J, Ball RM, Bermingham E, Lamb T, Neigel JE, Reeb CA, Saunders NC. 1987.Intraspecific phylogeography—the mitochondrial-DNA bridge between population-genetics and systematics.Annual Review of Ecology and Systematics 18:489–522DOI 10.1146/annurev.es.18.110187.002421.
Chamberlain SA, Szocs E. 2013.taxize: taxonomic search and retrieval in R. F1000Research2:191–191DOI 10.12688/f1000research.2-191.v1.
Coddington JA. 1988.Cladistic tests of adaptational hypotheses.Cladistics4:3–22 DOI 10.1111/j.1096-0031.1988.tb00465.x.
Czelusniak J, Goodman M, Hewettemmett D, Weiss ML, Venta PJ, Tashian RE. 1982. Phylogenetic origins and adaptive evolution of avian and mammalian hemoglobin genes.Nature298:297–300DOI 10.1038/298297a0.
Dalevi D, DeSantis TZ, Fredslund J, Andersen GL, Markowitz VM, Hugenholtz P. 2007.Automated group assignment in large phylogenetic trees using GRUNT: GRouping, ungrouping, naming tool.BMC Bioinformatics8:402.
Donoghue MJ. 1989.Phylogenies and the analysis of evolutionary sequences, with examples from seed plants.Evolution43:1137–1156DOI 10.2307/2409353.
Felsenstein J. 1985.Confidence limits on phylogenies: an approach using the bootstrap. Evolution39:783–791DOI 10.2307/2408678.
FitzJohn RG. 2012.Diversitree: comparative phylogenetic analyses of diversification in R. Methods in Ecology and Evolution3:1084–1092
DOI 10.1111/j.2041-210X.2012.00234.x.
Gilinsky NL, Good IJ. 1991.Probabilities of origination, persistence, and extinction of families of marine invertebrate life.Paleobiology 17:145–166.
Larget B, Simon DL. 1999.Markov chain Monte Carlo algorithms for the Bayesian analysis of phylogenetic trees.Molecular Biology and Evolution16:750–759 DOI 10.1093/oxfordjournals.molbev.a026160.
Matsen F, Gallagher A. 2012.Reconciling taxonomy and phylogenetic inference: formalism and algorithms for describing discord and inferring taxonomic roots. Algorithms for Molecular Biology 7(1):8.
McDonald D, Price MN, Goodrich J, Nawrocki EP, DeSantis TZ, Probst A, Andersen GL, Knight R, Hugenholtz P. 2012.An improved Greengenes taxonomy with explicit ranks for ecological and evolutionary analyses of bacteria and archaea.ISME Journal 6:610–618DOI 10.1038/ismej.2011.139.
Neuwirth E. 2014.RColorBrewer: colorbrewer palettes. R package version 1.1-2. ed. Paradis E, Claude J, Strimmer K. 2004.APE: analyses of phylogenetics and evolution in
R language.Bioinformatics20:289–290DOI 10.1093/bioinformatics/btg412. R Development Core Team. 2014.R: a language and environment for statistical
comput-ing. Vienna: R Foundation for Statistical Computing.Available athttp:// www.R-project.org/.
Rabosky DL. 2014.Automatic detection of key innovations, rate shifts, and diversity-dependence on phylogenetic trees.PLoS ONE9:e89543
DOI 10.1371/journal.pone.0089543.
Revell LJ. 2012.phytools: an R package for phylogenetic comparative biology (and other things).Methods in Ecology and Evolution3:217–223
DOI 10.1111/j.2041-210X.2011.00169.x.
Robinson DF. 1971.Comparison of labeled trees with valency three.Journal of Combina-torial Theory, Series B11:105–119 DOI 10.1016/0095-8956(71)90020-7.
Schliep KP. 2011.phangorn: phylogenetic analysis in R.Bioinformatics27:592–593 DOI 10.1093/bioinformatics/btq706.
Schwery O, Onstein RE, Bouchenak-Khelladi Y, Xing Y, Carter RJ, Linder HP. 2014. Data from: as old as the mountains: the radiations of the Ericaceae.Dryad Digital Repository DOI 10.5061/dryad.t3fg2.
Schwery O, Onstein RE, Bouchenak-Khelladi Y, Xing Y, Carter RJ, Linder HP. 2015.As old as the mountains: the radiations of the Ericaceae.New Phytologist 207:355–367 DOI 10.1111/nph.13234.
Shochat D, Dessauer HC. 1981.Comparative immunological study of albumins of anolis lizards of the Caribbean Islands.Comparative Biochemistry and Physiology a-Physiology68:67–73DOI 10.1016/0300-9629(81)90319-4.
Sibley CG, Ahlquist JE. 1981. The phylogeny and relationships of the ratite birds as indicated by DNA-DNA hybridization. In:Evolution today. Proceedings of the second International Congress of Systematic and Evolutionary Biology, 301–335.
to the radiation of angiosperms into freezing environments.Nature506:89–92 DOI 10.1038/nature12872.