The Predecessors of Bitcoin and Their
Implications for the Prospect of Virtual
Currencies
Thomas Kim*
School of Business Administration, University of California Riverside, Riverside, CA, 92521, United States of America
Abstract
To examine whether the recent price patterns and transaction costs of Bitcoin represent a general characteristic of decentralized virtual currencies, we analyze virtual currencies in online games that have been voluntarily managed by individuals since 1990s. We find that matured game currencies have price stability similar to that of small size equities or gold, and their transaction costs are sometimes lower than real currencies. Assuming that virtual currencies with a longer history can provide an estimate for Bitcoin’s prospects, we project that Bitcoin will be less influenced by speculative trades and become a low cost alternative to real currencies.
Introduction
Throughout history, the management of currency has been a responsibility and a right of a cen-tral authority. The recent debut of virtual currencies, such as Bitcoin, however, challenges this tradition. Electronic currencies are unique as the creation and management of these currencies are done by non-government entities. Further, there is an ongoing debate regarding whether these decentralized currencies are capable of serving as a substitute for the role of real curren-cies. In his letter to the Senate in 2013, Bernanke, the Federal Reserve Board chairman, states that cyber currencies“may have long-term promise.”On the other hand, Krugman [1] criti-cizes virtual currencies because they are used primarily for speculation rather than as a method of transaction.
It has been only a few years since Bitcoin received much public attention, and it is difficult to determine whether the current observations from Bitcoin represent general characteristics of decentralized virtual currencies or are Bitcoin-specific. To acquire a more general under-standing about virtual currencies, we examine a similar type of virtual currency that has been voluntarily traded and managed by individuals since the 1990s. The first cash payments be-tween players for a virtual item occurred in 1987 (Heeks [2]). The purpose of our analysis is to obtain the prospects of Bitcoin from other similar virtual currencies with a longer history.
OPEN ACCESS
Citation:Kim T (2015) The Predecessors of Bitcoin and Their Implications for the Prospect of Virtual Currencies. PLoS ONE 10(4): e0123071. doi:10.1371/journal.pone.0123071
Academic Editor:Luo-Luo Jiang, Wenzhou University, CHINA
Received:November 3, 2014
Accepted:January 3, 2015
Published:April 28, 2015
Copyright:© 2015 Thomas Kim. This is an open access article distributed under the terms of the Creative Commons Attribution License, which permits unrestricted use, distribution, and reproduction in any medium, provided the original author and source are credited.
Data Availability Statement:The price data of game currencies in this paper are acquired fromitemmania. comandige.com. Bitcoin prices are obtained from www.coindesk.comand the exchange rates of real currencies are acquired fromwww.oanda.com. Gold pricing data comes from the Federal Reserve Bank of St. Louis website. Stock prices are acquired from the Center for Research in Security Prices (CRSP) at the University of Chicago.
Funding:The authors have no support or funding to report.
Multiplayer online games have their own virtual currency to facilitate in-game transactions among game players. The virtual currencies used in online games closely resemble the virtual currencies recently developed for transaction purposes, including Bitcoin, in that the currencies are created and managed by non-government entities and are based on cyber space. Game cur-rencies have surprisingly large economic significance. Korea Bureau of Statistics estimates that the annual dollar volume of game currency trading is over $1 billion in 2007 in Korea alone and that the volume is growing. Mt. Gox exchange, which handled 70% of the Bitcoin transac-tions worldwide in 2013, was initially an exchange trading online game related items. Many of these game currencies have been used for more than a decade, and the number of currency users is sometimes larger than a nation’s population. For example,World of Warcraft, an on-line game, has more than 7 million players. The game servicing company, Activision Blizzard, reports 7.6 million subscribers as of the second quarter of 2014.
Our empirical analyses are focused on two aspects that Bitcoin has been criticized for. The first refers to high price volatility. To be a used as money, a currency should not have too much volatility as money has to be a unit of account or store value (Yermack [3]). Yermack [3] argues that Bitcoin prices are driven by speculative factors, based on the observation that Bit-coin prices have high volatility and almost no correlation with other assets. A possible basis for this high volatility is the absence of a central authority. This paper examines whether game cur-rencies, which are also managed by non-government entities, display similar characteristics.
The second aspect concerns ambiguous transaction costs. Although enthusiasts insist that Bitcoin can provide lower transaction costs than real currencies, there are few empirical tests to support this argument. This paper investigates whether the transaction costs of virtual curren-cies can be lower than that of real currencurren-cies. Instead of relying on theoretical arguments about the transaction costs, we calculate the costs directly from our empirical price data.
We find that the recent high volatility of Bitcoin is not a general characteristic of a non-gov-ernment managed virtual currency. While new game currencies are as volatile as Bitcoin, ma-tured game currencies have one-third of Bitcoin’s volatility, a level similar to that of a small size equity listed on a U.S. public exchange. Economic factors, such as exchange rates or game servicing a company’s stock returns, explain 40% of all game currency price variations indicat-ing that the prices are not totally determined by speculative factors.
Transaction costs are calculated with two measures endorsed by the market microstructure literature. The negative covariance measure of Roll [4] and the Zeros measure of Lesmond, Ogden, and Trzcinka [5] demonstrate that the transaction costs of game currencies and Bitcoin are sometimes lower than that of real currencies, such as the Euro. The transaction costs of a virtual currency significantly differ by the degree of competition among the exchanges. Coun-try specific regulations, such as residency checks, seem to protect inefficient exchanges.
Assuming that the case of more matured game currencies indicate Bitcoin’s prospects, we project that Bitcoin will have lower price volatilities and higher correlations with economic fac-tors. If Bitcoin can combine the price stability with its already low transaction costs, it may be-come a more widely accepted method of transaction.
Virtual Currencies in Online Games
Creation and Management of Virtual Currencies in Games
among different players’avatars. These two characteristics encourage players to compete with each other in developing their avatars. A more powerful avatar in a game provides the personal utility of winning a competition and enjoying more game content. These cyber competitions may be directly related to real rewards. A few online games allow powerful players to collect taxes from other players, and the collected game currency can be converted to real currency in the game currency markets.
Avatars become more capable and powerful when: 1) players spend more time on the game and 2) players equip the avatars with better items. It is in the equipment that real world wealth can make a large difference. Players are willing to spend real wealth to acquire a scarce virtual item so that they can gain more utility from a game.
The competition for game items and the willingness to spend real world wealth gave birth to markets in which players can purchase game items with real currency. Markets for cyber items are typically separate websites where players can trade game goods (items and cyber currency) with each other. These markets connect the game currencies with the real economy, as game currencies are priced in terms of real currencies.
There is a considerable demand for these markets. However, an obstacle to cyber goods trading is that the transfer of cyber goods and the payment of real currency cannot occur si-multaneously. The payment of real currency can be made by direct wire transfers or payment services, such as PayPal. The transfer of cyber goods, in comparison, must be made within a game. A seller and a buyer should both have an avatar in the game, and the seller should trans-fer the cyber goods from their avatar to the buyer’s avatar. Because it is cumbersome to trade every item in two different spaces, players use game currencies as a method of transaction. Each online game has its own virtual currency that is used to trade goods and items in the game. The in-game transaction process is comparable to a real world version of giving a dollar bill to a person for a good or service. In most of the games, it is as simple as sending or receiving emails. Players typically convert real currency into game currency using outside markets and then complete most of game-related transactions with game currency. They can convert a game currency back to a real currency in the game currency markets. In virtual worlds, game currencies are a better method of completing a transaction than are real currencies. Game cur-rencies are similar to Bitcoin in that both curcur-rencies are created in a virtual world and can be converted to real currencies in specified markets.
Game currencies share another important feature with Bitcoin; that is, the currency can be created by the players. Players can create game currency by completing a task in a game. For example, a player may earn one piece of game currency by hunting down a deer. The hunting creates additional game currency in the game economy as new currency is added to the game economy and a virtual deer (no value) disappears. Alternatively, a player can spend the curren-cy to purchase game goods for his avatar. The game currencurren-cy is effectively erased from a game economy when a player spends the currency to buy consumable goods from a game, such as food for his avatar. Thus, the creation and consumption of cyber currency in online games is largely influenced by game players.
Since game currency can be created by the players and markets for the game currency en-able players to exchange cyber goods for real currency, there are those players who play only to create game currency and to sell it in markets for real money. These players repeat tedious tasks, such as hunting a deer, to accumulate game gold. They may get $10 by selling their 1,000 pieces of game gold at markets for game currency. This type of game currency generation pro-cess is often executed on an industry scale. Dibbell [6] reports that as of 2007, the size of this
creation and to develop game contents that force players to spend more game currencies. Game players also cooperate to with the game managers’policies as they recognize a greater in-flation of the currency is harmful to their wealth in cyber space.
The issue of industrialized game currency creation closely resembles what is recently occur-ring in Bitcoin mining. With the recent public interest in Bitcoin, the Bitcoin mining process is becoming more industrialized. Since a better computing system has a greater probability of solving the math challenges of Bitcoin, miners who can pool more computing resources are likely to acquire more Bitcoins. Unlike game currencies, however, Bitcoin does not yet have a mechanism to control the amount of rewards for industrial mining.
A Comparison Between Game Currency and Other Virtual Currency
A comparison between game currency and the recently debuted virtual currencies would be useful in understanding the general characteristics of virtual currencies. A virtual currency is comprised of digital data that can be used as a method of transaction among Internet users. The most important feature of virtual currencies is that non-government entities can create or manage the currencies. A game player can create game currency through various game activi-ties. Bitcoin is created through a computer system that solves a decoding problem.
These free creation mechanisms can create supply problems like high inflation. It is said that Bitcoin does not have these supply related issues as the supply is controlled by a math algo-rithm. The maximum number of Bitcoins is 21 million (Surowiecki [7]) and the algorithm of the Bitcoin system is designed to generate a pre-determined rate of Bitcoins. However, the structure of Bitcoin is not absolutely fixed. Bitcoin users can implement new changes to the structure if a majority of the users agree to do so. A shock from outside of the system can also change the structure. For example, the rate of the Bitcoin supply is determined by the balance between the difficulty of the encryption and the decoding power of today’s computers. If com-puting power improves substantially, the math algorithm may not be able to maintain the pro-jected speed. Bitcoin wiki website (en.bitcoin.it) already worries about the possible debut of quantum computers, which can solve the current math exercise of Bitcoin at a much faster rate. In addition, there is the possibility that the Bitcoin system could be hacked. Although the system is regarded as secure at this point, without a central authority that has enforcement power, this currency may be facing attempts by outsiders to break the system.
currencies. If a game is to be shut down, in most cases, the game currency is converted to the currency of another game managed by the same servicing company. It would be comparable to a large shock to real currencies provoking public unrest. Bitcoin users also have incentives to guard their currency value, and they may display actions similar to that of game
currency holders.
The other important characteristic of virtual currencies is anonymity. Real money transac-tions conducted through the Internet are closely monitored and recorded by the government and by financial institutions. In contrast, since virtual currencies are managed by individuals, there is no designated monitor of the currencies. Game currencies and Bitcoin share a similar degree of anonymity. One can trade Bitcoin anonymously, as the transaction record does not completely reveal the true identification of a trader. It indicates only that a user who has cyber-space name“xy23z”used a certain amount of Bitcoin. Bitcoin users can generate billions of Bit-coin trading accounts (called“wallets”) and it is difficult to connect each of these accounts with a real identity. Due to its anonymity, there is the suspicion that Bitcoin is used for money laun-dering (FBI Report [8]).
Unlike Bitcoin, transaction records for game currencies are not automatically generated. The transactions can be recorded by game managers for back-up purposes, but those managers have little incentive to keep the records for an extended period of time as it requires the dedica-tion of too many resources to maintain such a database. As a result, it would be difficult for a third party to track the whole transaction. In a similar vein, the New York Times reports that the NSA and CIA have been secretly trying to monitor in-game activities since 2008 for the purpose of discovering illegal activities (Elliott [9]). It can be said that anonymity reduces the costs of the transactions that are regulated by law, such as trades related to illegal goods, tax evasion, or money laundering.
Overall, game currencies and Bitcoin share two important characteristics of a virtual curren-cy: 1) the management by individuals and 2) anonymity in cyber space. Thus, by examining game currencies, we expect to acquire an estimate of the prospects of Bitcoin and other recently debuted virtual currencies.
Empirical Analysis on Game Currency
Game Currency Data
South Korea is known to have the largest market of gaming goods trading and the most de-tailed gaming goods transaction statistics in the world (Heeks [1]). The price data of game cur-rencies in this paper are acquired from,www.itemmania.com, one of the two largest online markets for gaming goods in the country. The two largest markets comprise over 90% of the market share in South Korea, and both of the markets are indirectly owned by a U.S. invest-ment bank, Goldman Sachs. As a result, the structures of the two markets are similar to each other. The market structure resembles that of a stock exchange; trades occur continuously and traders can place either a limit order (place quotes) or a market order (accept the existing quotes). The market provides daily game money price data. The data defines a daily price as the last trading price near midnight, as this market operates 24 hours per day.
We also obtain price data from a U.S.-based cyber goods trading website,www.ige.com. The website is closer to a dealer than to a market in that players cannot post their quotes and can only accept the website’s quotes. The website is known as one of the most frequently used gam-ing goods tradgam-ing websites in the U.S. The site revises its quotes intermittently, approximately once a week. The site displays only sell (ask) quotes to the public.
trades. This secrecy is related to several factors. First, many game players are not comfortable with other players’using real wealth to win competitions in a game. Buying gaming goods with real currency is sometimes regarded as“cheating.”The markets and their participants seek to hide their transactions to dodge the criticism of other players. Additionally, game managers have not reached a consensus regarding the real money trading of their game goods. Heeks [1] reports that the reaction of game managers to cyber goods trading varies from an attempt to completely ban it to a laissez-faire policy. The policy may also change over time in the same game. A game goods trader may receive a penalty from game managers unexpectedly. More-over, legal authorities have made several attempts to regulate cyber goods trading when they suspect money laundering activities or fraud. Similar to game managers, regulators do not have an organized view of cyber goods trading yet making regulation unpredictable. For example, South Korea’s Supreme Court decided that the“trading of cyber goods is legal”in 2009, while in 2013, the Korean Ministry of Culture, Sports, and Tourism attempted to ban all cyber goods trading in non-adult-rated games. Overall, there are plenty of incentives to conceal the transac-tion data. Accordingly, we made the name of the Korean game currency market and the U.S. website anonymous in this paper to prevent any issues in regard to the use of publicly posted price information. Details regarding the data sources are available upon request.
This study employs the game currency prices of the gamesDiablo IIIandWorld of
War-craft. While the game currency trading data are from South Korea,Diablo IIIandWorld of
Warcraftare made and managed by Activision Blizzard, a U.S. company, and the games are
played worldwide. Therefore, the two game currencies are less influenced by country-specific factors. We acquire historical prices of the two game currencies. In the market from which we obtain the data, historical prices are available for only a handful of the most widely traded game currencies.
World of Warcraftis the most popular online game in the world and holds the Guinness
World Record for the largest number of subscribers around the globe (10 million subscribers in 2008). As a result, its game currency is the most widely traded game currency in the world. The history ofWorld of Warcraftgame currency trading spans over a decade.Diablo IIIhas over one million players daily. It is a fairly new game, released in May 2012. The game is partic-ularly interesting in that it has its own market for cyber goods called“Real Money Auction House”(RMAH) that allows a player to buyDiablo IIIitems from other players with real cur-rency, such as U.S. dollars. A player can use a real currency that is convenient for that player. For example, a Canadian user may use Canadian dollars, while a Russian user may use Rubles. The establishment of RMAH was a response from the game servicing company, as many users have already been trading game currency with real currency.
From the Korean market, we acquire about one year of daily prices of theDiablo IIIgame currency from November 2012 to November 2013. In addition, approximately five months of
World of Warcraftgame currency prices are accessible (from July 2013 to November 2013).
The price data from the U.S. dealer is scarcer. About two months of price data is available per game. Although theWorld of Warcraftpricing data have shorter time-series coverage, the data are much broader cross-sectionally as the data contain prices from 12 servers as compared to only three servers forDiablo III.
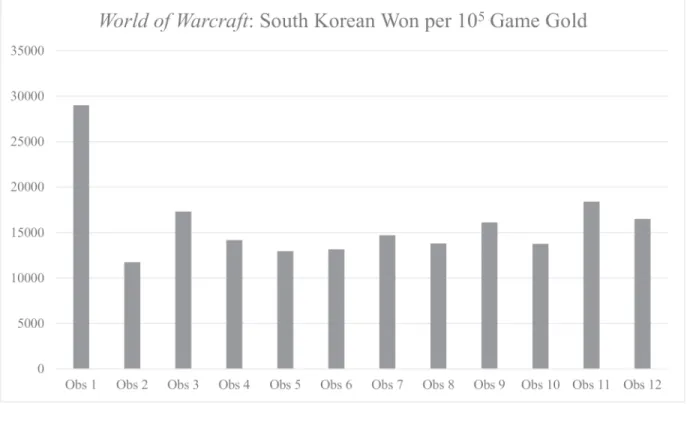
currency in one server cannot be transferred to another server. Due to the isolation of servers and because each server will have a different number of players, game play styles, and so forth, the value of one server’s currency can be quite different from the value of another server’s cur-rency. As of 2013, there are approximately 1,000World of Warcraftservers around the globe, but price data are available for only six of the servers that are played primarily by South Korean users.Fig 1illustrates the distribution of cyber currency prices ofWorld of Warcraftservers
andDiablo IIIservers as of October 31, 2013.
We obtain price data for six servers ofWorld of Warcraft, but there are 12 prices inFig 1 be-cause even within the same server, the price differs by the side a gamer is playing. InWorld of
Warcraft, a player has to select a side to play (Alliance vs. Horde) and cannot switch his
ava-tar’s side once the choice has been made. Further, no direct transaction is allowed between dif-ferent side players. As such, there are a considerable number of transaction costs involved to transfer a good from one side to the other. The different prices are actually a sign of efficiency. Whenever there is a restriction in currency flow, an efficient market should have different prices for each isolated economy so that the prices reflect the unique economic situation of each cyber economy.
Price Stability
The decentralized control structure of virtual currencies may generate an irrational pattern or high volatility in their prices. This view is supported by the recent high volatility of Bitcoin. Our first analysis is to examine if these high volatilities are Bitcoin specific or one of the charac-teristics of non-government managed virtual currencies. We compare the price volatilities of non-government managed virtual currencies (game currencies and Bitcoin) with that of real currencies and frequently traded assets. Note that game currencies do not have a supply con-trolling algorithm such as Bitcoin’s. This difference may generate higher volatilities in game currency prices.
Using the price data obtained from the South Korean exchange, we calculate the daily mean and standard deviation of game currency price changes by each server/side and report the aver-age of the statistics. We also present the annualized volatility calculated from the daily standard deviations. Following standard procedures, the price change of a currency is defined as the dif-ference between two consecutive days’prices divided by the previous day’s price.
Returni;t¼
Pricei;t Pricei;t 1
Pricei;t 1
ð1Þ
The standard deviation of game currency returns is 9.3% forDiablo IIIcurrencies and 2.7%
forWorld of Warcraftcurrencies. Bitcoin’s standard deviation is 7.3% during the entire year of
Fig 1. Price Distribution by Different Servers and Sides.This figure illustrates average game currency prices in South Korean Won. Each bar represents an observation from a server/side. ForWorld of Warcraft, there are six servers in our dataset and each server has two sides for a total of 12 observations.
2013. These figures are higher than any of the real currency exchange rates reported, indicating that virtual currencies have higher volatilities than real currencies. The annualized volatilities of theDiablo IIIcurrency and theWorld of Warcraftcurrency are 146% and 43%, respectively. The price volatility of theDiablo IIIcurrency is 13% higher than that of Bitcoin, while the vola-tility of theWorld of Warcraftcurrency is about one-third of Bitcoin’s and similar to that of small or middle sized equities. The question is what level of volatility is acceptable as a curren-cy. Since equities are sometimes used to store value, we suppose that the volatility of theWorld
of Warcraftcurrency is at a level enabling the currency to operate as an (inferior) alternative of
a real currency. Also, equities held by a firm are often regarded as a cash equivalent asset in ac-counting. Note thatDiablo IIIbegan its service only in 2011, whileWorld of Warcrafthas a his-tory longer than a decade. Bitcoin gained much of its current public attention around the time
whenDiablo IIIwas initiated. The case of theWorld of Warcraftcurrency demonstrates that
the high volatility of Bitcoin is not a common attribute of non-government managed virtual currencies. Rather, high volatilities may be a characteristic of newly introduced currencies, as demonstrated in the case ofDiablo IIIcurrency.
An alternative way to measure price stability is to examine the size of devaluation or revalu-ation during a certain period. Too much devalurevalu-ation or revalurevalu-ation is an indicrevalu-ation of poor sta-bility. Devaluation can be particularly problematic to game currencies as any player can create the currencies by playing a game. Alternatively, the math algorithm of Bitcoin is designed to re-ward new Bitcoin to a few miners at a pre-determined rate.
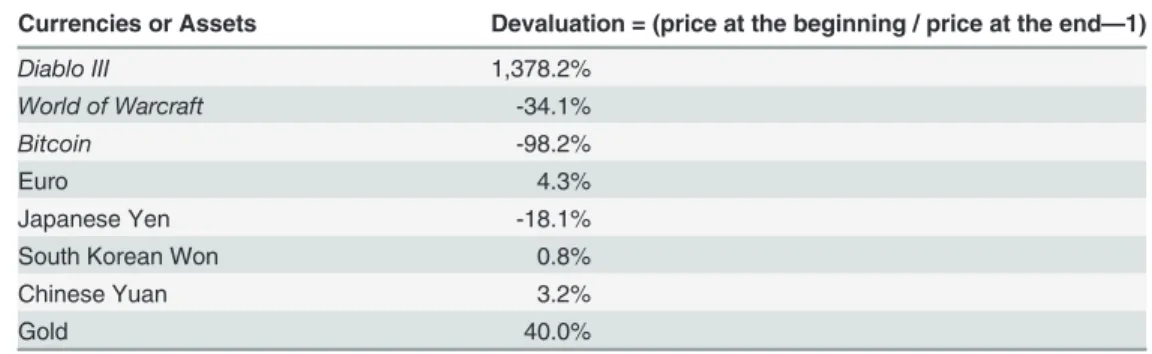
The devaluation of a currency is calculated by (the price at the beginning/the price at the end—1). Positive numbers represent devaluation (decrease in value), while negative numbers represent revaluation (increase in value). The prices are measured in U.S. dollars.Table 2 shows the devaluation of currencies.
Diablo IIIhas a devaluation of 1,378% during a one-year period, while theWorld of
War-craftcurrency price increased by 34%. It is actually surprising to observe a revaluation of a
game currency. Since the currency can be created by individuals, the revaluation indicates that there are effective mechanisms that can offset/overcome the continuous mining activities of some individuals. These mechanisms include an increased amount of in-game spending and
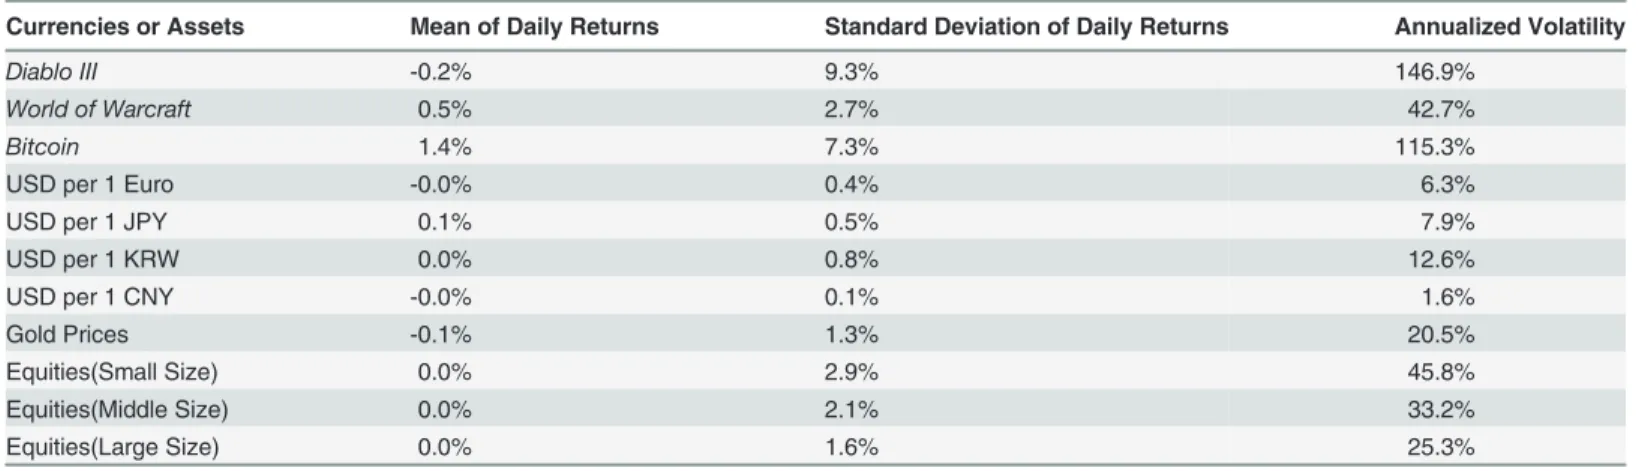
Table 1. Summary Statistics on Price Changes.
Currencies or Assets Mean of Daily Returns Standard Deviation of Daily Returns Annualized Volatility
Diablo III -0.2% 9.3% 146.9%
World of Warcraft 0.5% 2.7% 42.7%
Bitcoin 1.4% 7.3% 115.3%
USD per 1 Euro -0.0% 0.4% 6.3%
USD per 1 JPY 0.1% 0.5% 7.9%
USD per 1 KRW 0.0% 0.8% 12.6%
USD per 1 CNY -0.0% 0.1% 1.6%
Gold Prices -0.1% 1.3% 20.5%
Equities(Small Size) 0.0% 2.9% 45.8%
Equities(Middle Size) 0.0% 2.1% 33.2%
Equities(Large Size) 0.0% 1.6% 25.3%
We report summary statistics on the daily returns of various assets. The mean, standard deviation, and annualized volatility are reported. The data period is from November 2012 to November 2013 forDiablo IIIcurrency and from July 2013 to November 2013 forWorld of Warcraftcurrency. For comparison, we report the statistics of Bitcoin, Euro, Japanese Yen (JPY), South Korean Won (KRW), and Chinese Yuan (CNY) exchange rates with the U.S. Dollar, as well as gold and equities. We use all of the daily prices in 2013 for the assets not related to games.
the supervision of mining activities. Anecdotal evidence suggests that not only game managers, but also game players supervise each other to prevent losses in game currency value. The case
ofDiablo IIImay indicate that the free creation of game currencies leads to the devaluation of
the currency, but the case ofWorld of Warcraftstands as a counter example. Bitcoin has a price increase of 98%, which is a substantial increase in the value. Real currencies have devaluation or revaluation rates under 20%. Again, the subsequent question is what devaluation rate is to be regarded as too large. We suppose that the change in gold prices can serve as a basis. Gold, an asset that is sometimes used in lieu of real currencies, has a 40% devaluation in 2013.World
of Warcraftcurrency has a smaller price change (in absolute value) than gold. Thus, we find
that the price stability of some virtual currencies is comparable to that of frequently traded as-sets like gold or small size equities.
The instability and large devaluation ofDiablo IIIcurrency is a typical pattern of virtual cur-rencies in newly launched online games. Inflation is inevitable in new games as: 1) the liquidity of game currency must be increased rapidly to accommodate new incoming players and 2) the degree of competition among players is typically greatest at the beginning of a game. This is be-cause a new game is like a new land where a player can obtain an advantage over others if they become the first to possess the land. Game currency prices are the highest at the beginning as players compete to be the first. The price quickly declines as a game economy becomes more established. Similarly, Bitcoin may have large price volatility because it is a newly launched currency.
Price Determinants
Another uncertainty concerning Bitcoin arises in that Bitcoin prices have almost no correlation with other assets (Yermack [3]). We examine whether this is true for other virtual currencies as well. We use a multivariate regression to test the relationship between virtual currency prices and economic factors. This analysis is feasible for game currencies as our data provides a few variables possibly related to game currency prices. This analysis would be one of the first at-tempts to identify the factors that determine the price of a virtual currency.
We examine the supply and demand factors of the game currency used inWorld of
War-craft. We have price data for 12 of its game servers and sides, as well as some information
Table 2. Devaluation of Currencies.
Currencies or Assets Devaluation = (price at the beginning / price at the end—1)
Diablo III 1,378.2%
World of Warcraft -34.1%
Bitcoin -98.2%
Euro 4.3%
Japanese Yen -18.1%
South Korean Won 0.8%
Chinese Yuan 3.2%
Gold 40.0%
We measure the devaluations of various currencies and gold. The devaluation of a currency is calculated as: (price at the beginning/price at the end—1). A negative devaluation indicates an increase in currency value (revaluation). Currency prices are measured in U.S. dollars, using the exchange rates acquired from
www.oanda.com. The data period is from November 2012 to November 2013 forDiablo IIIcurrency and from July 2013 to November 2013 forWorld of Warcraftcurrency. We use the full 2013 data for Bitcoin, real currencies, and gold.
about the server characteristics. As a supply factor, we estimate the number of professional game currency creators, also referred to as miners, by server/side. The number can be estimated from the quotes on the market for game currency. Every week, we compute the number of sell quotes perWorld of Warcraftserver that are posted within the previous three hours. Profes-sional currency miners try to sell their game currency through the markets quickly, and they update their quotes at least every hour for better visibility. Individual sellers, in contrast, do not update their quotes as frequently, and their quotes are often older than one day. Therefore, a higher number of fresh updated sell quotes indicates a greater number of professional currency miners.
We measure the demand for game currency with two variables. The first demand variable is the number of players in each server. There would be more demand for game currency when there are more players. The cross-sectional difference in the number of players can be estimat-ed by the server status report on theWorld of Warcraftwebsite. The website periodically pro-vides information on the crowdedness of a server using a three-step indicator (low, medium, and high). In the regression analysis, we use a three-step variable that takes a value from one (Low) to three (High) to proxy for the number of players by server.
The next demand factor is the degree of competition. Players try to win the in-game compe-tition by better equipping their avatars. This compecompe-tition leads to more game related trading, which increases the demand for game currency. The degree of competition can be captured by server type. The servers ofWorld of Warcrafthave slightly different game contents in terms of competition. A Player vs. Environment (PvE) server allows battles between players, but the bat-tle must be consensual. In a Player vs. Player (PvP) server, a player can be attacked by an op-posing side player at any time. Therefore, the level of competition among players can be higher in a PvP server. We use a dummy variable for server type that takes a value of one when a serv-er is a PvP sserv-ervserv-er and zserv-ero othserv-erwise. Both of demand variables are collected evserv-ery week.
As a control variable, we include real currency exchange rates. The price of a game currency is in South Korean Won (KRW), as the market is mainly for South Korean players, but the game’s currency is also used by players outside of the country. Thus, a devaluation of the South Korean Won may be accompanied with a revaluation of a game’s currency. Daily exchange rates between South Korean Won and U.S. dollars are obtained from quotes from the Korea Exchange Bank. This exchange rate represents the retail exchange rate (the rate that banks charge to retail customers) in South Korea.
Another control variable is the stock returns of the game management company, Activision Blizzard. This variable can represent other supply and demand factors for their game currency, as stock prices are likely to be correlated with the contents of the game. According to the firm’s 2010 annual report, over 80% of the firm’s revenue is related toWorld of Warcraft.
The explanatory variables do not have enough time-series variability when compared to game currency prices. The most frequent series are exchange rates and stock returns, but they are not available on non-business days. Other variables, such as the number of quotes or server types, are obtained weekly. Alternatively, game currency prices are available seven days a week. We use weekly game currency prices that are measured every Friday. Likewise, weekly stock re-turns and exchange rate changes are calculated from Friday prices.
Our left-hand side variable is the weekly game currency prices, while our right-hand side variables are the number of currency creators measured by the number of fresh quotes, server crowdedness, server competition, KRW/USD exchange rate changes, and the game manager stock returns. The regression utilizes panel data that pools prices from differentWorld of
correct for server fixed effects. The estimation equation has the following form:
LogðPricei;tÞ ¼aþd1Quotesi;tþd2Server Crowdednessi;tþd3Server Competitioni;t
þd
4Exchange Ratei;tþd5Stock Returnsi;tþε
ð2Þ
where Log(Pricei,t)is the natural log of game currency price in server or sideiat weekt,Quotes is the number of fresh quotes on the market for game currency,Server Crowdednessis the num-ber of users on a server measured by a three-step scale (high, medium, and low),Server
Compe-titionis a dummy variable that is equal to one when a server has more competition among
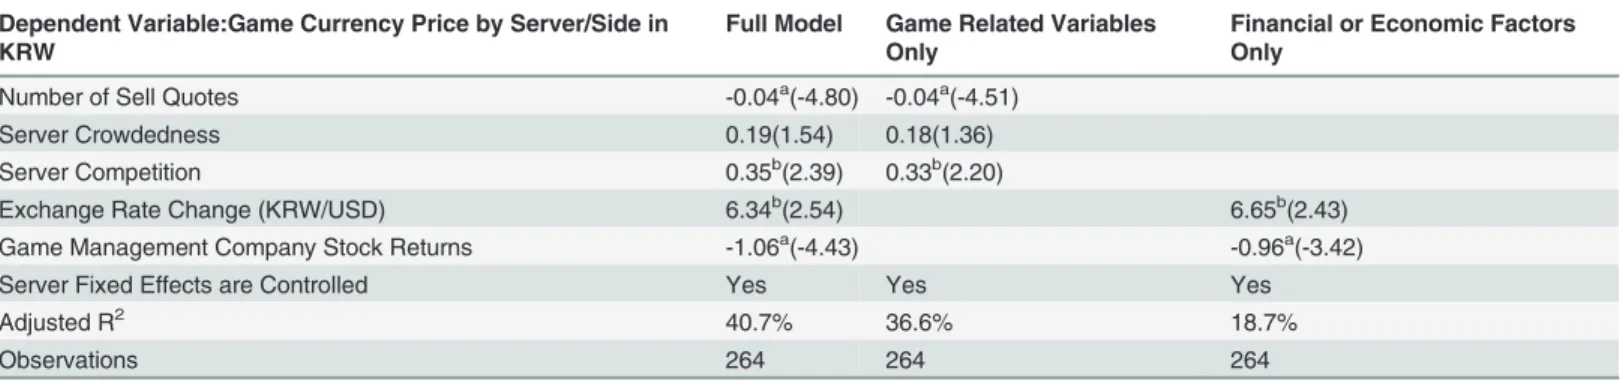
players,Exchange Rateis the exchange rate between KRW and USD, andStock Returnsis the weekly stock returns of the game servicing company. The estimation method is Generalized Method of Moments (GMM) that corrects for heteroscedasticity and autocorrelation in the re-gression error terms.Table 3presents the results of the regression.
Column 1 presents the full model. Column 2 contains a reduced form model that only uses game related variables, while Column 3 reports a model that only uses financial or economic factors. The signs of the coefficients are consistent with our intuition. The demand factors, which are server crowdedness and competition, have positive coefficients. The supply factor, which is the number of professional currency miners, has a negative coefficient. The coefficient on the KRW per one USD exchange rate is positive, as a devaluation of KRW is accompanied with a revaluation of game currency. The coefficients on competition, quotes, and exchange rates are significant at the 5% level. The reduced form models in Columns 2 and 3 demonstrate that the significance of a coefficient does not change much by model specification. The adjusted
R-square of the full model is 40% indicating that a large portion of the game currency prices is determined by economic factors rather than speculative factors. The reduced form model that only contains financial or economic factors (in Column 3) has an adjusted R-square of 18% in contrast to the almost zero correlation of Bitcoin with other assets. These results demonstrate that the price of some virtual currencies is determined by economic factors.
Table 3. Game Currency Price Determinants.
Dependent Variable:Game Currency Price by Server/Side in KRW
Full Model Game Related Variables Only
Financial or Economic Factors Only
Number of Sell Quotes -0.04a(-4.80) -0.04a(-4.51)
Server Crowdedness 0.19(1.54) 0.18(1.36)
Server Competition 0.35b(2.39) 0.33b(2.20)
Exchange Rate Change (KRW/USD) 6.34b(2.54) 6.65b(2.43)
Game Management Company Stock Returns -1.06a(-4.43) -0.96a(-3.42)
Server Fixed Effects are Controlled Yes Yes Yes
Adjusted R2 40.7% 36.6% 18.7%
Observations 264 264 264
We examine the determinants of game currency prices with a multivariate regression. RecallEq 2.
The dependent variable is Log(Pricei,t), which is the natural log of game currency price in serveriat weekt. Independent variables includeQuotes,Server
Crowdedness,Server Competition,Exchange Rate,and Stock Returns.Quotesis the number of fresh quotes on the market for game currency,Server Crowdednessis the number of users in a server measured by a three-step scale (high, medium, and low),Server Competitionis a dummy variable is equal to one when a server has more competition among players,Exchange Rateis the exchange rate between KRW and USD, andStock Returnsis the weekly stock returns of the game servicing company. Serverfixed effects are controlled. The estimation method is Generalized Method of Moments (GMM) that corrects for heteroscedasticity and autocorrelation in the regression error terms. t-statistics are in parentheses. Coefficients significant at the 1%, 5%, and 10% level are marked by a small a, b, and c, respectively.
Transaction Costs
In this section, we explore another question related to virtual currencies. A major argument for Bitcoin is that the currency can provide lower transaction costs than real currencies, as Bitcoin is free from government regulation/taxation or fees from financial institutions. Theoretically, the P2P (peer-to-peer) transfer system of Bitcoin is free because it is sending data from one user to the other, comparable to sending and receiving emails. In reality, however, often times the P2P system of Bitcoin requires fees for the following reasons. First, fees are necessary to prevent too many small transactions jamming the Bitcoin transaction system. In addition, Bit-coin miners are supposed to use past transaction records when creating additional BitBit-coin. A Bitcoin transaction has to be acknowledged by a certain number of Bitcoin miners to become valid. In contrast, miners do not have an obligation to examine and approve transactions. Transaction fees expedite the approval process by rewarding miners. We do not have access to data regarding the level of these“voluntary fees”in the Bitcoin system.
Rather, we focus on the transaction costs of virtual currency exchanges. A large portion of the fees imposed to Bitcoin users actually comes from the exchanges that convert real cies to Bitcoin. Although the network is growing, Bitcoin is not as widely used as real curren-cies, so Bitcoin adopters have to convert real currencies to Bitcoin at these exchanges and pay fees. An alternative way of using Bitcoin without paying fees to the exchanges is to mine Bit-coin, but the competition for mining is severe as of 2013, that it was almost impossible to gen-erate enough Bitcoins to do everyday transactions. Bitcoin wiki website (en.bitcoin.it) estimates that as of 2013, it would take approximately five years to mine one Bitcoin with a personal computer. Given that one Bitcoin has a price around $500, buying Bitcoins from exchanges is a much more realistic way of using Bitcoin. In this respect, the math algorithm that controls the supply of Bitcoin acts against the widespread of the currency.
Game currencies share the same characteristics as Bitcoin. In-game transactions with game currencies are P2P transactions and are mostly free of charge. It is often difficult to mine enough currencies from game play alone (although the difficulty is much lower than Bitcoin mining), so players choose to buy game currencies through exchanges that trade game curren-cies. The exchanges for game currencies have existed since the 1990s indicating that these ex-changes are in high demand by virtual currency users.
www.coincompare.comprovides a comparison of Bitcoin exchange fees imposed by the
ex-changes. These fees would include the transaction cost of Bitcoin and the expenses to run a Bit-coin exchange. The Mt. Gox exchange, which handled 70% of the worldwide BitBit-coin
transactions in 2013, has a fee ranging between 0.25% and 0.60%. Other Bitcoin exchanges charge fees ranging from 0.2% to 2.0%. The only information we have are for game currency exchanges in South Korea, where the exchanges typically impose a 5% fee to sellers only. The fee seems to be much higher than that of Bitcoin exchanges, but only sellers pay the fees and the maximum fee is capped at $30 if the trade size is larger than $600. The sellers of game cur-rencies are mostly professional miners, so most of the retail level exchange users are not direct-ly subject to the fee. Note that in the cases of foreign exchange wire transfers, a retail customer typically pays a wire transfer fee of around $40 per outgoing transfer.
spreads, are often not available. Still, there are two measures that can be derived from only daily prices, which we do have access to. They are the covariance measure of Roll [4] and the Zeros measure of Lesmond et al. [5]. The Roll [4] measure and the Zeros measure have signifi-cant correlations with true transaction costs, as demonstrated by Goyenko, Holden, and Trzcinka [11] and Marshall, Nguyen, and Visaltanachoti [12].
The Roll [4] measure calculates the covariance between two consecutive price changes. The measure is intended to capture the price change due to bid-ask spreads (bid-ask bounce). Fol-lowing Goyenko et al. [11], the Roll [4] measure is defined as:
Roll¼
(
2 ffiffiffiffiffiffiffiffiffiffiffiffiffiffiffiffiffiffiffiffiffiffiffiffiffiffiffiffiffiffiffiffiffiffiffiCovðDP t;DPt 1Þ
p
When CovðDPt;DPt 1Þ<0
0 When CovðDP
t;DPt 1Þ>0
ð3Þ
The Zeros measure counts the number of days with zero returns. Many days of zero returns indicates that there is little trading activity, which is associated with higher transaction costs. The Zeros measure is defined as:
Zeros¼ ð # of days with zero returns
Number of total trading daysÞ ð4Þ
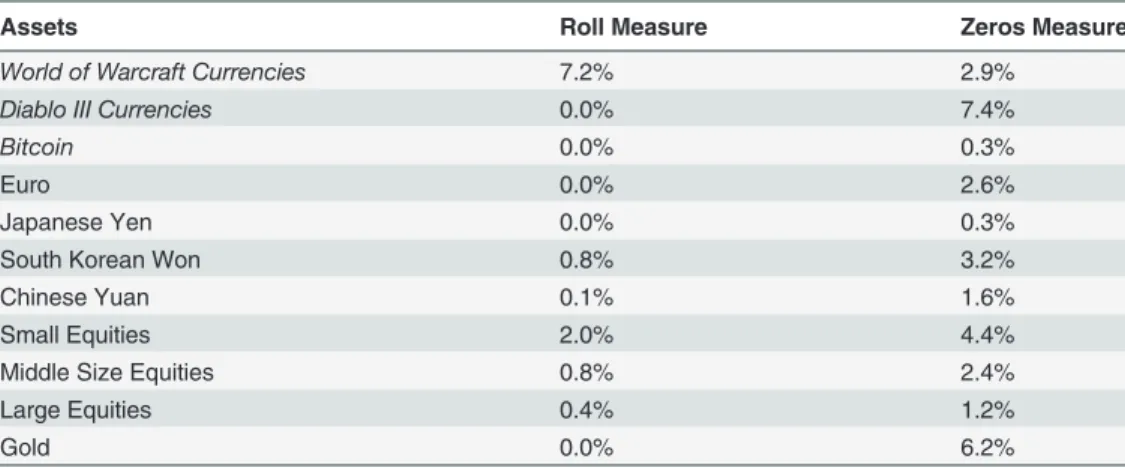
We calculate the Roll [4] measure and the Zeros measure of three virtual currencies: two game currencies in our data and Bitcoin. For comparison, the same measures are calculated from the exchange rates of Euro, Japanese Yen (JPY), South Korean Won (KRW), and Chinese Yuan (CNY). Althoughwww.oanda.comreports exchange rates for all weekdays, wefind that the returns are frequently zero on Mondays (based on the website’s date). This phenomenon indicates that the Monday rates of this website are recorded when most foreign exchanges are closed. As a response, when calculating the Roll [4] and the Zeros measure from the website’s price data, we omit the observations on Mondays. In addition to real currencies, the measures calculated from U.S. exchange listed equity prices and gold prices are included. If an asset has more than one series in its category, such as small size equities, we report the median of the measure following Marshall et al. [12] as a few large outliers, such as non-trading stocks, may heavily influence the average.
The Roll [4] measure is 7.9% for theWorld of Warcraftcurrency and 0% for theDiablo III
currency and Bitcoin. Real currencies have Roll [4] measures ranging from 0% to 0.7%. Among other assets, small size equities have the highest Roll [4] measure of 2.0%. Thus, the Roll [4] measure provides mixed results regarding the hypothesis that virtual currencies have lower transaction costs than real currencies. The Zeros measure displays a similar pattern, but is more positive toward virtual currencies. The highest Zeros measure among virtual currencies is theWorld of Warcraftcurrency with a Zeros measure of 2.9%. This figure is lower than the Zeros measure of South Korean Won. Bitcoin excels in both measures. The Roll [4] measure is 0% and the Zeros measure is 0.3%. The Zeros measure of Bitcoin is on par with that of the Japa-nese Yen, which has the lowest Zeros measure among the real currencies reported inTable 4. Overall, we find indications that the transaction costs of virtual currencies are lower than that of real currencies.
Competition of Exchanges
currency that can be transferred almost freely in cyber space. In reality, however, many of the virtual currency exchanges are not facing high competition because there are barriers prevent-ing traders from switchprevent-ing. Most of these barriers are country specific regulations, such as re-quiring a trader to have a valid social security number of the country to open an account for an exchange. As we do not have access to Bitcoin historical price data by exchange, we examine this issue by comparing the game currency prices obtained from two exchanges that are located in different countries: the U.S. and South Korea.
While South Korea has relatively large markets for online game currencies, these established markets do not exist in the U.S. Instead, we were able to collect price quotes from a popular game currency dealer in the U.S. The dealer is much smaller in size when compared to ex-changes in South Korea. The website posts only their sell quotes, and the sell quotes are up-dated sporadically (i.e., once a week). The quotes are also much less sophisticated when compared to those of the South Korean market, as the U.S. dealer quotes the same price for all game servers/sides. We have U.S. dealer quotes data forDiablo IIIgame currency from May 2012 to June 2012 and forWorld of Warcraftgame currency from October 2013 to December 2013.
Since the game currency price of the U.S. dealer website is quoted in U.S. dollars, we convert their sell quotes to South Korean Won (KRW) using the exchange rate between the South Ko-rean Won and the U.S. dollar. We take the average of theWorld of Warcraftcurrency prices by exchange as there are multiple servers and sides.Fig 2presents a plot of the prices by exchange. U.S. dealer prices are plotted by dotted lines, and Korean game currency market prices are plot-ted by solid lines.
In the case of the American server ofDiablo III, the prices are similar in both exchanges in that the sell quotes of the U.S. dealer are, on average, 1.2% higher than the prices in the Korean market. Since players incur a 5% transaction fee when selling game currency in Korean market, this price difference does not allow an arbitrage transaction when buying game currencies from one market and selling them on another for profit. The prices on the two different
Table 4. Transaction Costs.
Assets Roll Measure Zeros Measure
World of Warcraft Currencies 7.2% 2.9%
Diablo III Currencies 0.0% 7.4%
Bitcoin 0.0% 0.3%
Euro 0.0% 2.6%
Japanese Yen 0.0% 0.3%
South Korean Won 0.8% 3.2%
Chinese Yuan 0.1% 1.6%
Small Equities 2.0% 4.4%
Middle Size Equities 0.8% 2.4%
Large Equities 0.4% 1.2%
Gold 0.0% 6.2%
We calculate the Roll (1984) measure and the Zeros measure of virtual currencies and various assets. We use the median of each measure by asset class if there are multiple assets in the class, as in the case of small size equities. The data period is from November 2012 to November 2013 forDiablo IIIcurrency and from July 2013 to November 2013 forWorld of Warcraftcurrency. We use the full 2013 data for other assets.
Fig 2. Game Currency Prices Measured from Two Different Countries—in KRW.The game currency prices from two different markets are plotted in this figure. We have approximately two months of sell quotes data from a U.S. based game currency dealer. The quotes are compared with the prices reported by a Korean game currency exchange. The dollar prices of the dealer are converted to South Korean Won using the corresponding exchange rates.Diablo III
markets also move in a similar direction indicating that Purchasing Power Parity somewhat holds for this game currency.
The price difference is larger in the Asian server. The U.S. dealer’s sell quotes are almost twice as high as the Korean exchange prices. This contrast may be because the dealer is operat-ing in the U.S. and they primarily trade on an American server. Consistent with this conjecture, a few months after this sample is acquired, the dealer stopped posting quotes for the
Asian server.
The game currency prices ofWorld of Warcraftare almost 10 times more expensive in the U.S. A large arbitrage profit would be possible if one can buy game currency in South Korea and sell it in the U.S. This transaction may not be feasible, however, as we only observe sell quotes from the U.S. dealer. The dealer may buy currencies at much lower prices than their sell quotes or impose other restrictions. Note that the dealer is the largest game currency trader in the U.S. thus far, indicating that any game player in the U.S. who wants to buy currencies must contend with these high prices.
The large difference in prices implies that the U.S. dealer is not subject to competition from other exchanges. We wondered whyDiablo IIIgame currency is relatively well priced on its American server, if U.S. game currency trading does not have much competition. We offer two reasons. First,Diablo IIIhas a Real Money Auction House (RMAH) in the game, where players can use real currency to purchase other players’game items. Players will select RMAH (al-though there are quite a few restrictions in using the in-game auction house) if the quotes from a game currency dealer are unrealistic. In addition, there are only three servers forDiablo III. It will be easier to set a price that ensures profit from all three servers if a dealer quotes one price for all of the servers.World of Warcraft, in contrast, has approximately 1,000 servers. This con-trast indicates that the transaction costs of virtual currencies can be heavily influenced by the amount of competition among the exchanges. It can be projected that greater competition among exchanges may further diminish the already low transaction costs of Bitcoin and other virtual currencies.
Summary and Conclusion
This paper examines the price stability and transaction costs of game currencies that have com-monalities with Bitcoin. We find that more mature game currencies have a price volatility of one-third of that of Bitcoin, at a level similar to that of small size equities or gold. The decen-tralized structure of Bitcoin does not seem to be the cause of the recent price instability, as game currencies are also managed by non-government entities. We observe a similar price in-stability from the game currencies that are launched around the time when Bitcoin gained much of its current public attention (around the year 2011). The contrast between mature and newly introduced virtual currencies indicates that the Bitcoin price may stabilize over time.
The transaction costs of virtual currencies are sometimes lower than that of real currencies. With more competition among virtual currency exchanges, the transaction costs may drop fur-ther making virtual currencies a lower cost alternative to real currency transactions. Econo-mists agree that a properly functioning currency should include a method of transaction, a unit of account, and store value (Yermack [3]). Bitcoin may meet the criteria if it can combine its low transaction costs with more stable prices.
estimate how widespread Bitcoin will be. Also, our analysis does not justify that virtual curren-cies should have greater value. A large volume of Bitcoin trading in these days is speculative trading, betting on the possible appreciation of Bitcoin prices. Speculative trades are necessary to discover the reasonable exchange rates of Bitcoin, but it is unknown when the market will reach the equilibrium. As we demonstrate from the comparison of exchanges with varying de-grees of competition, various regulations imposed on Bitcoin exchanges may be a dragging fac-tor in the price discovery process.
A note concerning the other uses of game currencies is warranted. The results in this paper suggest that game currencies may be an interesting topic for future research in the areas of monetary economics and consumer behavior. Game currencies are tightly connected to real currencies through the markets for game currencies. Likewise, Castronova [13] finds that game players do not become irrational decision makers because they are in a virtual world. Thus, cyber economies may serve as a lab for monetary policies. For example, economists may exam-ine an ongoing debate as to whether monetary expansion actually creates greater production by gifting each game player with a certain amount of gaming currency. Experiments in this fashion may be much more costly and possibly dangerous in a real economy, while they can be conducted with relative ease in a gaming economy with results that are quantifiable.
Author Contributions
Conceived and designed the experiments: TK. Performed the experiments: TK. Analyzed the data: TK. Contributed reagents/materials/analysis tools: TK. Wrote the paper: TK.
References
1. Krugman P (2013) Golden Cyberfetters. New York Times, 2013; September 7. Available:http:// krugman.blogs.nytimes.com/2011/09/07/golden-cyberfetters/.
2. Heeks R (2008) Current analysis and future research agenda on‘gold farming.’2008. Working Paper, University of Manchester.
3. Yermack D (2013)“Is Bitcoin a real currency? Working Paper, National Bureau of Economic Research.
4. Roll R (1984) A simple implicit measure of the effective bid-ask spread in an efficient market. Journal of Finance 1984; 39: 1127–1139.
5. Lesmond D, Ogden J, Trzcinka C (1999) A new estimate of transaction costs. Review of Financial Stud-ies 1999; 12,: 1113–1141.
6. Dibbell J (2007) The life of a Chinese gold farmer. New York Times, 2007; June 17. Available:http:// www.nytimes.com/2007/06/17/magazine/17lootfarmers-t.html?pagewanted = all&_r=0.
7. Surowiecki J (2011)“Cryptocurrency. MIT Technology Review 2011.
8. FBI Report, 2012 Bitcoin virtual currency: Unique features present distinct challenges for deterring illicit activity. 2012; April 24.
9. Elliott J (2013) World of Sprycraft: NSA and CIA spied in online games. New York Times, 2013; Decem-ber 9. Available: http://www.propublica.org/article/world-of-spycraft-intelligence-agencies-spied-in-online-games.
10. Stoll H (2000) Friction. Journal of Finance 2000; 55: 1479–1514.
11. Goyenko R, Holden C, Trzcinka C (2009) Do liquidity measures measure liquidity? Journal of Financial Economics 2009; 92:: 153–181.
12. Marshall B, Nguyen N, Visaltanachoti N (2012) Commodity liquidity measurement and transaction costs. Review of Financial Studies 2012; 25: 599–638.