a System with Migrating Prey
L. Mark Elbroch
1*, Patrick E. Lendrum
1, Jesse Newby
2, Howard Quigley
1, Derek Craighead
21 Panthera, New York, New York, United States of America, 2 Craighead Beringia South, Kelly, Wyoming, United States of America
Abstract
We tested for seasonal differences in cougar (Puma concolor) foraging behaviors in the Southern Yellowstone Ecosystem, a multi-prey system in which ungulate prey migrate, and cougars do not. We recorded 411 winter prey and 239 summer prey killed by 28 female and 10 male cougars, and an additional 37 prey items by unmarked cougars. Deer composed 42.4% of summer cougar diets but only 7.2% of winter diets. Males and females, however, selected different proportions of different prey; male cougars selected more elk (Cervus elaphus) and moose (Alces alces) than females, while females killed greater proportions of bighorn sheep (Ovis canadensis), pronghorn (Antilocapra americana), mule deer (Odocoileus hemionus) and small prey than males. Kill rates did not vary by season or between males and females. In winter, cougars were more likely to kill prey on the landscape as: 1) elevation decreased, 2) distance to edge habitat decreased, 3) distance to large bodies of water decreased, and 4) steepness increased, whereas in summer, cougars were more likely to kill in areas as: 1) elevation decreased, 2) distance to edge habitat decreased, and 3) distance from large bodies of water increased. Our work highlighted that seasonal prey selection exhibited by stationary carnivores in systems with migratory prey is not only driven by changing prey vulnerability, but also by changing prey abundances. Elk and deer migrations may also be sustaining stationary cougar populations and creating apparent competition scenarios that result in higher predation rates on migratory bighorn sheep in winter and pronghorn in summer. Nevertheless, cougar predation on rare ungulates also appeared to be influenced by individual prey selection.
Citation: Elbroch LM, Lendrum PE, Newby J, Quigley H, Craighead D (2013) Seasonal Foraging Ecology of Non-Migratory Cougars in a System with Migrating Prey. PLoS ONE 8(12): e83375. doi:10.1371/journal.pone.0083375
Editor: Marco Festa-Bianchet, Université de Sherbrooke, Canada
Received July 11, 2013; Accepted November 1, 2013; Published December 12, 2013
Copyright: © 2013 Elbroch et al. This is an open-access article distributed under the terms of the Creative Commons Attribution License, which permits unrestricted use, distribution, and reproduction in any medium, provided the original author and source are credited.
Funding: Funding was provided by the Summerlee Foundation, The Richard King Mellon Foundation, The Charles Engelhard Foundation, The Laura Moore Cunningham Foundation, Tim and Karen Hixon Foundation, National Geographic Society, The Norcross Wildlife Foundation, Inc., Earth Friends Conservation Fund, The Cougar Fund, The Bay Foundation, Michael Cline Foundation, Eugene V. & Clare E. Thaw Charitable Trust, Connemara Fund, Hogan Films, Community Foundation of Jackson Hole, The Oregon Zoo Foundation, the Global Felid Genetics Program of the Sackler Institute for Comparative Genomics at the American Museum of Natural History, Mr. and Mrs. G. Ordway, Mr. and Mrs. M. Manship, Mr. and Mrs. N. Jannotta, Mr. L. Westbrook, Mr. and Mrs. S. Robertson, and several anonymous donors. The funders had no role in study design, data collection and analysis, decision to publish, or preparation of the manuscript.
Competing interests: The authors received an additional donation from a small, 1-person commercial enterprise, called Hogan Films. This donation, as well, was given without any demands on how the money was spent, nor did Hogan Films make any demands on research methods or direction. Hogan Films does not lay claim to any ownerships, patents etc. that would represent a conflict of interest. This donation does not alter the authors' adherence to all the PLOS ONE policies on sharing data and materials.
* E-mail: [email protected]
Introduction
Ungulate migrations, driven by the seasonal availability of forage, result in large-scale redistributions of resources for carnivores, and in response, carnivores exhibit variable foraging behaviors in systems with migrating prey [1]. Carnivore responses to migratory prey, in turn, influence predator-prey dynamics, including predator functional responses and apparent competition influencing rare prey during seasonal overlap with more abundant prey (e.g., cougar, Puma concolor, and bighorn sheep, Ovis canadensis, [2]). On the one hand, migrating prey change prey availability for non-migratory predators, and on the other, predators that select
Previous research has shown that some terrestrial carnivores exhibit seasonal variation in prey selection and kill rates dependent upon seasonal variation in prey vulnerability [8,9,10]. Thus, predator-prey modeling based upon sampling in a single season may lead to inaccurate conclusions [10]. Winter prey selection in North America and dry-season prey selection in Africa is driven by the increased availability of animals of poorer health [8,10], and seasons in which ungulates give birth provide a pulse of vulnerable, smaller prey [11]. Whereas previous research has focused upon prey availability in terms of prey vulnerability, here we assess predator foraging ecology as affected by prey availability driven by ungulate migrations.
Cougars are a solitary felid and occupy the largest geographic range of any terrestrial mammal in the western hemisphere, exhibiting plasticity in habitat use and prey selection [12]. Cougar populations are primarily non-migratory and hunt non-migratory prey [12]. Nevertheless, where mule deer (Odocoileus hemionus) exhibit seasonal migrations, some cougars follow them, exhibiting seasonal ranges themselves; other cougars remain in winter deer range through the summer, where deer persist, but at lesser numbers [4,13]. Cougars also exhibit numerous seasonal foraging strategies, including seasonal prey selection [11], seasonal kill rates [11], and seasonal habitat use [4,13]. Whereas previous research on other predators have emphasized that predators select different prey in different seasons due to variation in prey vulnerability [8,10], cougars as a species do not always select disadvantaged prey exhibiting physical vulnerability. Instead, cougars select prey opportunistically (i.e., of any health) in areas where structural complexity (e.g., slope, trees, boulders) provide them an advantage [14,15,16]. Therefore, it is logical to hypothesize that cougar seasonal prey selection and kill rates may be driven by prey availability in terms of actual prey numbers, as well as prey vulnerability.
Our goals were to test for differences in a suite of seasonal cougar foraging behaviors, including prey selection, kill rates, and habitat use, in the Southern Yellowstone Ecosystem (SYE), a multi-prey system in which many ungulate prey migrate, and cougars remain in place. Our study system included numerous potential prey for cougars, including abundant elk (Cervus elaphus) and numerous mule deer, and smaller populations of bighorn sheep, moose (Alces alces) and pronghorn (Antilocapra americana). All of these species, except moose, exhibit seasonal migrations within the study area [17,18,19]. Elk migration is in part due to historic and ongoing food subsidies provided them on and adjacent the National Elk Refuge in winter. Due to their low and declining numbers, moose, pronghorn, and bighorn sheep are of critical conservation concern, and elk and mule deer, too, are exhibiting declines [20,21]. Thus a better understanding of patterns of predation on ungulates in the SYE, including the influence of ungulate migrations on seasonal cougar prey selection, holds immediate conservation value.
We defined prey specialization as killing a prey species in greater numbers than any other prey [22], and we hypothesized that unlike elsewhere in their range, cougars would specialize on deer in summer but elk in winter. We also
hypothesized that cougar kill rates would be higher in summer than winter because of selecting for smaller, younger ungulates with less energetic value than adult animals [11]. Further, we hypothesized that cougar predation on less abundant bighorn sheep would be highest in winter and predation on pronghorn would be highest in summer, when these species migrated into the range of stationary, resident cougars monitored as part of our study. We expected predation on moose to occur equally across seasons because they did not migrate in and out of the study area. Last, we hypothesized that cougars would utilize different habitats for hunting in summer versus winter, because of changes in prey assemblage, distributions, and availability.
Methods
Ethics statement
Our capture protocols for cougars, a species which is neither threatened or endangered, followed those outlined in Quigley [23], adhered to the guidelines outlined by the American Society of Mammalogists [24], and were approved by the Jackson Institutional Animal Care and Use Committee (Protocol 027-10EGDBS-060210). Every effort to ameliorate suffering of cougar subjects was made, and no cougars were ever killed/sacrificed as part of research methods. Our research was carried out on the Bridger-Teton National Forest (United States Forest Service, USFS Authorization ID JAC760804), Grand Teton National Park (NPS Permit GRTE-2012-SCI-0067), and National Elk Refuge (USFW permit NER12),with permission to handle cougars granted by the Wyoming Game and Fish Department (ID 297).
Study area
Our study area encompassed approximately 2,300 km2 of
the Southern Yellowstone Ecosystem (SYE), inclusive of Grand Teton National Park (United States Park Service), the National Elk Refuge (United States Fish and Wildlife Service), and the Bridger-Teton National Forest (United States Forest Service) north of the town of Jackson, Wyoming (Figure 1). Elevations in the study area ranged from 1,800 m in the valleys to > 3,600 m in the mountains. Plant communities included cottonwood (Populus angustifolia) riparian zones interspersed with sagebrush (Artemisia spp.) uplands at lower elevations. At intermediate elevations, aspen (P. tremuloides), Douglas-fir (Pseudotsuga menziesii), and lodgepole pine (Pinus contorta) were the dominant species. Spruce (Picea engelmannii) and fir (Abies lasiocarpa) were the primary tree species at the higher elevations [25]. The area was characterized by short, cool summers and long winters with frequent snowstorms. Precipitation occurred mostly as snow, and mean maximum snow depths ranged from 100 cm at lower elevations to > 245 cm at intermediate and higher elevations (2,000 m +).
virginianus). Deer, elk, bighorn sheep, and pronghorn exhibited seasonal migrations [7,17,18,19].
Cougar capture and collar programming
Beginning in 2001, we captured cougars with permission from the Wyoming Game and Fish Department during winters, from late-November through March of the following year on the Bridger-Teton National Forest, when determining the presence of a cougar was facilitated by snow. We used trailing hounds to force cougars to retreat to a tree or rocky outcrop where we could safely approach them. Cougars were immobilized with ketamine (4.0 mg/kg) and medetomidine (0.07 mg/kg), and then their temperature, heart rate, and respiration were monitored at 5 minute intervals while they were processed, sampled, and fitted with either a VHF (Telonics, Mesa, AZ) or GPS collar (Telonics, Mesa, AZ; Televilt, Bandygatan, Sweden; Vectronics, Berlin, Germany). Once an animal was completely processed, the effects of the capture drugs were reversed with Atipamezole (0.375 mg/kg), and cougars departed the capture sites on their own.
Determining cougar prey selection
We conducted site searches of areas on the Bridger Teton National Forest, Grand Teton National Park, and National Elk Refuge, where triangulation of cougars wearing VHF collars revealed that they had not moved for 24+ hrs, or spatially aggregated GPS points, called GPS clusters [26], indicated a cougar had remained in place for 8+ hours. Prey remains, including hair, skin, rumen (stomach), and bone fragments, were used to identify prey species. We determined sex of ungulate prey using external morphology, and the relative age of prey using tooth eruption sequences and wear in the lower mandible [27] as follows: < 1 yr of age (young of the year), 1-3 yrs (subadult), > 3yrs (adult).
Testing for differences in prey selection between males/females and summer/winter
Following well-established elk migration dates in the study area, we defined winter as Dec 1st of one year through May 31st
of the next year, and summer as June 1st through November
30th of the same year. To account for variable number of prey
killed by individual cougars, we quantified each individual
Figure 1. Location of the study area in northwest Wyoming, USA. Location of the study area in northwest Wyoming, USA, and a close up of land ownership within the area of focus. The smaller rectangle delineated by a black line was the area in which we focused capture efforts and our interaction study using marked individuals.
cougar’s prey selection as the proportions of prey killed by each cougar, before conducting any population level analyses. We employed two-proportion z-tests to account for variable numbers of kills between males and females, and winter and summer, to test whether female and male cougars selected different proportions of different prey, and then whether males and females selected different proportions of prey in summer versus winter.
Estimating kill rates and testing for seasonal variation We estimated seasonal kill rates for cougars wearing GPS collars with models that differentiated between GPS clusters with a high probability of being a kill versus GPS clusters with a low probability of being a kill. GPS collars were programmed to acquire location data at variable intervals, ranging from every 3 to 10 hour intervals, with the majority of collars being programmed to acquire 6-8 locations each day. To identify clusters, GPS data were analyzed with a Python script (Python Software Foundation Hampton, NH) developed by Knopff et al. [28] to identify 2 or more locations within 100 meters and 48 hrs of each other. We did not include cougars wearing VHF collars in our kill rate calculations.
First, we developed competing models to test 4 spatial and 7 temporal attributes of clusters potentially predictive of kill sites (Table 1) [26,29,30]. We tested these models against our database of a subset of GPS clusters we visited in the field, and for which we determined whether or not a kill was present. Additional sites where the presence of a kill could be confirmed were provided by visits based on VHF radio telemetry for clusters later identified with GPS data stored on collars. For cluster analysis, site searches conducted ≥ 4 months from the beginning date of cluster formation and site searches of questionable reliability (eg. when snow fall may have obscured evidence) were omitted.
We employed logistic regression to assess the ability of univariate and multivariate models to predict at which clusters we would likely find a cougar kill. We employed residual plots of univariate models to assess assumptions of linearity and normality and transformed data accordingly. We also excluded models in which variables exhibited collinearity ≥ 0.7. We applied backwards and forwards model selection to select the best supported model, based on Akaike’s Information Criterion, and obtain parameter estimates. We did not use weighted parameter estimates for predictor variables because of the large number of highly correlated variables. We assessed the fit of the top model from receiver operative characteristic (ROC) curves [31].
We employed sensitivity and specificity curves to assess the efficiency of models in predicting kill sites and determining the optimum probability cut-point for clusters to identify kills [31]. High sensitivity may effectively classify clusters with kills successfully (reduce false-negatives), but is likely to attribute kills to clusters without them (increase false-positives). In contrast, high specificity may result in more false negatives, but few false positives.
We applied our final model to GPS cluster data for all individuals that wore GPS collars to predict which clusters were likely to contain kills as follows: Pr(kill) = exp(β0 + β1*X1 + β2*X2 +
βn*Xn)/1 + exp(β0 + β1*X1 + β2*X2 + βn*Xn). Where β
0 is the intercept and
βn are coefficients for predictor variables Xn [32]. We applied
this model to identify clusters that likely contained kills in the entire GPS location data from all cats. We used these identified clusters in the full GPS dataset to estimate seasonal kill rates for each individual cougar. We conducted a test of whether there were differences in kill rates due to season or cougar sex with a 2-way analysis of variance, where individual cougar was included as a random effect.
Due to the low success rate of the final models in classifying clusters, we examined an alternative model for identifying kills. This model was based on previous research by Anderson and Lindzey [26] and Ruth et al. [30], which employed the number of nights a cougar visited a cluster as an efficient means to distinguish between kill and non-kill sites. In this approach, kills were assigned only to clusters that spanned more than one night. We reported kill rates determined using both the “best” and night>1 models, because the benefit of the night>1 model’s ability to positively detect kills at sites may outweigh the cost of over attributing kills to clusters where none were found. As this method likely missed small prey that could be consumed in shorter time frames, we defined these kill rates as ungulate-only kill rates (which may have additionally underestimated the number of fawns, calves and lambs killed by cougars).
Testing for seasonal cougar space use
We determined seasonal fixed-kernel home ranges for marked, adult cougars resident in the study area from 2001 to 2011 using ArcGIS 10 and the calculation of kernel density estimators (KDE) [33,34] and isopleths in the Geospatial Modeling Environment (GME) [35]. We examined home ranges at 90% KDE. Annual home ranges were calculated for cougars Table 1. Spatial and temporal attributes of clusters examined as potential predictors for cougar kills.
Variable name Variable description Duration (hours) Number of hours in cluster Day-period Number of 24 hour periods in cluster
Number of nights Number of separate nights (19:00 – 7:00hrs) in cluster
Days>1 True/False identifying clusters including more than one 24 hour period
Nights>1 True/False identifying clusters including more than one night (19:00 – 7:00hrs)
Night 1+ True/False identifying clusters including at least one night (19:00 – 7:00hrs)
Night hours Number of hours in cluster occurring between 19:00 – 7:00hrs
Fidelity Proportion of locations at cluster site vs. away over time frame of cluster
Cluster radius Radius of cluster in meters Average distance
from centroid
Average distance in meters between locations and the center of the cluster
for which we had gathered a minimum of 20 independent locations for each season across at least 10 months in a given year. Cougars with VHF collars were triangulated on the ground and from fixed-wing aircraft. We determined the smoothing factor (h) for VHF data with least squares cross validation (LSCV) [33], and for GPS data, using the Plug-in method [36] in the GME. To test whether cougars remained stationary through the seasons, we quantified their seasonal home range overlap. We defined “stationary” as a mean overlap of 50% or more between summer and winter ranges.
We also quantified the seasonal overlap between the marked cougar population and the seasonal ranges for pronghorn, bighorn sheep, mule deer and elk. We employed the 90% kernel density of all cougar data for summer and winter home ranges, and seasonal ungulate distributions determined by Wyoming Game and Fish Department surveys (wgfd.wyo.gov/ web2011/wildlife-1000819.aspx).
Testing for differences in seasonal cougar hunting areas
We identified 7 landscape variables as potentially important predictors of cougar kill sites: elevation (m), slope (%), aspect (transformed into categories of North, East, South, West), terrain ruggedness (vector ruggedness measure; VRM), vegetation type, distance to water, and distance to edge habitat. We estimated elevation using a digital-elevation model (DEM) at a resolution of 30 m (http:// datagateway.nrcs.usda.gov/). We then used ArcGIS 10.0 Spatial Analyst Tools to derive values of slope and aspect from the DEM. In addition, we also derived a vector ruggedness measure (VRM) from the DEM following Sappington et al. [37]. A Gap Analysis Program (GAP) land cover (gapanalysis.usgs.gov/gaplandcover) was used, at a resolution of 30 m, which included 87 cover classes, which we reclassified into 5 cover based on similarity of land cover types: (1) open meadows or crop lands, (2) barren habitats and open water bodies, (3) shrub-steppe, (4) forested, (5) and riparian zones. Water sources included streams and rivers obtained from hydrologic units (http://datagateway.nrcs.usda.gov/). We converted all forested lands from the GAP into a polygon layer in ArcGIS to be used as an indication of cover. We then created edge layers as the perimeter of each forested section.
Prior to modeling, we used a correlation matrix to evaluate collinearity (|r| > 0.7) among predictor variables. No predictor variables were correlated (|r| < 0.50) and therefore, all variables remained in the modeling process. We then modeled all possible combinations of the 7 predictor variables. For the categorical variable of aspect, we used southerly aspect as a reference category because southerly aspects are commonly used by prey species [38].
To estimate resource-selection functions for each season, we employed conditional logistic regression [39,40,41] to compare kill sites with random locations, located 2 km from the kill site along each cardinal direction. Each cougar was considered a stratified variable to control for variation among individuals (i.e., individuals were sampling units), and the logistic model for each study area was made condition upon that variable [42,43]. We calculated Akaike’s Information
Criterion adjusted for small sample size (AICc), ΔAICc, and Akaike weights (wi) for each model [44]. We considered models
with ΔAICc values > 2.0 to measurably differ in information content and then used model-averaged parameter estimates and unconditional standard errors (SE) to assess the influence of each predictor variable on resource selection from the top models [44]. To evaluate predictive strength of the resource-selection functions for kill sites for each season, we used k-fold cross validation [45]. We portioned kill sites into five equal sets, and models were fit to 80% partition of the data, while the remaining 20% of the data were used as test data [46,47]. We used RSF scores to rank the observed location of each stratum against the test data. We then regressed the number of locations from the observed dataset in each bin against the median RSF value of the test data, and recorded the coefficient of determination (r2). Additionally, we calculated a Spearman’s
rank correlation (rs) as an additional metric of predictive
strength. Values with a high r2 and r
s were indicative of models
with high predictive strength [45].
Based on our seasonal RSF results, and with respect to a reference vector, defined as the set of mean values for each variable within the domain of availability, we then calculated the relative probability of a cougar killing prey across the landscape in ArcGIS 10 [46,47]. We converted parameter estimates to odds ratios by exponentiation for simplicity of interpretation. Therefore, if the 95% confidence interval around an odds ratio contained 1, then that variable was considered not significant [43,46]. The resulting odds ratio expression for a given landscape location was then calculated using the spatial distribution of cougar kills to generate a probability surface that served as a template to identify landscape heterogeneity [46,47]. Cells with a higher value indicated a higher relative probability of kill occurrence.
Results
Seasonal prey indices and prey selection
Between January, 2001, and October 1, 2012, we recorded 411 winter prey and 239 summer prey killed by 28 female and 10 male cougars, and an additional 37 prey items recorded for unmarked cougars (30 winter, 7 summer). Of these, only 29 prey were not ungulates, and so we lumped them together under “small prey” in analyses. Small prey included 8 North American porcupines (Erethizon dorsatum), 6 snowshoe hares (Lepus americanus), 3 grouse (Bonasa spp.), 3 Northern raccoons (Procyon lotor), 2 red squirrel (Tamiasciurus hudsonicus), 1 red fox, 1 yellow-bellied marmot (Marmota flaviventris), 1 great-horned owl (Bubo virginianus), 1 American marten (Martes americanus), 1 red-naped sapsucker (Sphyrapicus nuchalis), 1 Canada goose (Branta canadensis), and 1 cougar.
females killed bighorn sheep and 3 of 28 females killed pronghorn. Five of 28 females and 4 of 10 males killed moose.
Cougar kill rates
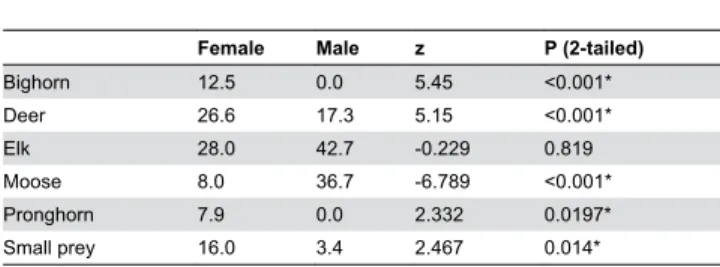
From 2005 to 2012, we collected location data adequate to identify clusters from 17 cougars wearing GPS collars. During this same time period, we visited 309 clusters from 14 individuals (average clusters visited/cat = 22; range 1-81 clusters/cat) to search for prey remains. Sites were visited between 0 – 98 days after initial cluster formation (average = 8 days). We found kills at 269 clusters and classified 40 clusters as non-kills, and with these data, we tested our kill rate models. The final logistic regression model for determining if a cluster was likely a kill included the cluster spanning more than one night (z = 3.042; P = 0.002), the square root of the number of hours at night in a cluster (z = 2.084; P = 0.037), fidelity (z = 2.205; P = 0.027), and distance to nearest consecutive cluster (z = 2.284; P = 0.022). The probability of finding a kill was positively associated with all 4 variables included in the final model. Model fit was moderate for the final model (AUC = Table 2. A comparison of proportions (%) of different prey killed by male and female cougars, and the results of the two-proportions z-test.
Female Male z P (2-tailed)
Bighorn 12.5 0.0 5.45 <0.001*
Deer 26.6 17.3 5.15 <0.001*
Elk 28.0 42.7 -0.229 0.819
Moose 8.0 36.7 -6.789 <0.001*
Pronghorn 7.9 0.0 2.332 0.0197*
Small prey 16.0 3.4 2.467 0.014*
Significant results are marked with an asterisk (*). doi: 10.1371/journal.pone.0083375.t002
Table 3. A comparison of proportions (%) of different prey killed by female and male cougars in summer and winter, and the results of the two-proportions z-test.
Females
Summer (n=189) Winter (n=329) z P (2-tailed)
Bighorn 2.7 8.3 -2.904 0.004*
Deer 43.5 10.2 8.376 <0.001*
Elk 41.6 75.0 -7.747 <0.001*
Moose 0.5 2.1 -1.694 0.09
Pronghorn 2.2 0.1 1.942 0.052*
All small 9.6 4.3 2.191 0.028*
Males
Summer (n=50) Winter (n=82) z P (2-tailed)
Deer 17.3 1.3 2.913 0.004*
Elk 58.6 87.6 -3.690 <0.001*
Moose 16.7 10.6 0.9721 0.331
All small 7.5 0.5 1.840 0.066
Significant results are marked with an asterisk (*). doi: 10.1371/journal.pone.0083375.t003
0.827). The probability cut-off of 0.887 maximized both sensitivity and selectivity in discriminating between clusters with and without kills, however, this cut-off resulted in only a 49.7% success of correctly classifying our known kill and non-kill clusters, identified with field investigations.
The variable “night>1” was found to be the strongest predictor of a cluster being a kill in both the multivariate models and among all univariate models (R2 for night>1 = 0.148; all
other independent variables R2 < 0.057). The night>1 model
was found to successfully identifying clusters as having kills 86% of instances, but attributed kills to 40% of sites at which we did not find prey remains. This resulted in a 46.0% classification success for the night>1 model. The benefit of the night>1 model’s ability to positively detect kills at sites (86% for night>1 model vs. 75% for full model) may have outweighed the cost of over attributing kills to clusters where none were found (40% for night>1 model vs. 25% for full model) (Table 4). Field crews often searched sites many days after the cluster had formed and it was likely that they failed to find evidence of some kills that actually occurred. Given the potential bias in assigning kills to non-kill clusters, it is reasonable to assume the model that over attributed kills to clusters was more reliable.
Based on 211 ungulates of known age killed in summer and 382 ungulates of known age in winter, cougars as a population selected equal proportions of adult (37.4% in summer vs. 45.3% in winter, z = 1.88, P = 0.06) and subadult (14.7% in summer vs. 15.2% in winter, z = 0.163, P = 0.87) ungulates in summer and winter. Cougars did kill higher proportions of ungulates < 1 year of age in summer (47.9% in summer vs. 39.5% in winter, z = 1.97, P = 0.05), however, ungulate kill rates did not vary by season (F1,52.32=0.42, P=0.52) or between
males and females (F1,13.59=0.11, P=0.52). Kills rates are
reported in Table 4.
Seasonal cougar ranges
We analyzed the seasonal ranges of 16 cougars. Of these, three home ranges were quantified from locations obtained from fixed-wing telemetry of VHF collars, seven from GPS locations, and the remaining from a combination of VHF and GPS locations. Mean overlap between summer and winter ranges was 59.8% ± 4.91 (range of 19.7 to 92%).
Table 4. Individual cougar kill rates as determined with the >1 night model, and full model criteria, and sex and season.
Cat ID Sex Days monitored Season >1 night Model No. Kills >1 Model Kill Rate (Kills/Day) Full Model No. Kills Full Model Kill Rate (Kills/Day)
F13 F 69 Winter 14 0.20 7 0.10
F13 F 86 Summer 16 0.19 15 0.17
F13 F 35 Winter 7 0.20 6 0.17
F13 F 119 Winter 22 0.18 16 0.13
F13 F 183 Summer 29 0.16 23 0.13
F13 F 149 Winter 17 0.11 15 0.10
F13 F 63 Winter 13 0.21 10 0.16
F13 F 169 Summer 23 0.14 20 0.12
F27 F 20 Winter 3 0.15 2 0.10
F27 F 25 Summer 3 0.12 3 0.12
F30 F 27 Summer 3 0.11 3 0.11
F47 F 36 Summer 5 0.14 4 0.11
F47 F 182 Winter 31 0.17 20 0.11
F47 F 183 Summer 26 0.14 22 0.12
F51 F 182 Winter 31 0.17 21 0.12
F51 F 183 Summer 30 0.16 21 0.11
F51 F 183 Winter 30 0.16 19 0.10
F51 F 112 Summer 13 0.12 10 0.09
F57 F 160 Winter 24 0.15 20 0.13
F57 F 183 Summer 24 0.13 20 0.11
F57 F 182 Winter 24 0.13 16 0.09
F57 F 183 Summer 20 0.11 15 0.08
F57 F 165 Winter 21 0.13 15 0.09
F61 F 91 Winter 14 0.15 9 0.10
F61 F 134 Summer 15 0.11 12 0.09
F69 F 26 Winter 3 0.12 3 0.12
F69 F 156 Winter 19 0.12 15 0.10
F69 F 183 Summer 18 0.10 19 0.10
F69 F 182 Winter 18 0.10 16 0.09
F69 F 183 Summer 20 0.11 22 0.12
F69 F 34 Winter 3 0.09 3 0.09
F101 F 91 Winter 8 0.09 8 0.09
F101 F 167 Summer 27 0.16 18 0.11
F101 F 58 Winter 9 0.16 9 0.16
F101 F 183 Summer 30 0.16 23 0.13
F101 F 72 Winter 11 0.15 10 0.14
F101 F 35 Summer 6 0.17 5 0.14
F101 F 183 Winter 22 0.12 19 0.10
F101 F 183 Summer 18 0.10 15 0.08
F101 F 175 Winter 20 0.11 16 0.09
F104 F 35 Summer 4 0.11 3 0.09
F109 F 27 Winter 5 0.19 4 0.15
F109 F 183 Summer 30 0.16 24 0.13
F109 F 183 Winter 29 0.16 22 0.12
F109 F 44 Summer 12 0.27 10 0.23
M21 M 183 Winter 21 0.11 20 0.11
M21 M 183 Summer 16 0.09 19 0.10
M21 M 182 Winter 16 0.09 16 0.09
M21 M 183 Summer 14 0.08 15 0.08
M21 M 182 Winter 15 0.08 17 0.09
M21 M 183 Summer 27 0.15 27 0.15
M21 M 182 Winter 27 0.15 24 0.13
M21 M 183 Summer 20 0.11 25 0.14
Seasonal hunting areas
In winter, the relative probability that a hunting cougar would kill prey at a particular place on the landscape increased as: 1) elevation decreased (β = -0.005115), 2) distance to edge habitat decreased (β = -0.00633), 3) distance to large bodies of water and rivers decreased (β = -0.00069), and 4) steepness increased (β = 0.09395). Relative to categorical variables, cougars in winter were less likely to make a kill on North- and East- facing slopes compared to South-facing. There was no statistical difference in the probability of a cougar killing on either South- or West- facing slopes. The probability of a cougar kill was lower in open habitats, such as meadows or pastures, compared to sagebrush-dominated communities, and the likeliness of a kill was similar among forested landscapes, riparian zones, and sagebrush communities (Table 5).
During summer, cougars were more likely to make a kill in areas with: 1) decreasing elevation (β = -0.000865), 2) decreasing distance to edge habitat (β = -0.00495), and 3) increasing distance from large bodies of water and rivers (β = 0.000616; Table 5). Neither slope, aspect, nor vegetation type were significant in predicting kill site selection during summer. Terrain ruggedness was not a strong determinant in kill site selection during either season. Cross-validation analyses indicated that resource-selection functions were highly predictive for both winter and summer kill site selections (winter rs = 0.97, r2 = 0.94; summer rs = 0.83, r2 = 0.68). We used our
model averaged parameter estimates to map the probability surface of cougars successfully killing prey across the landscape (Figure 4).
Discussion
Whereas some cougars elsewhere follow migrating prey [4], they primarily remain sedentary in the Southern Yellowstone Ecosystem while their prey base change with the seasons. This is further evidence of the plasticity of this wide-ranging predator, and suggests that like wolves [7], cougars exhibit variable foraging strategies in systems with migrating prey. No doubt cougars in the SYE exhibited seasonal prey selection
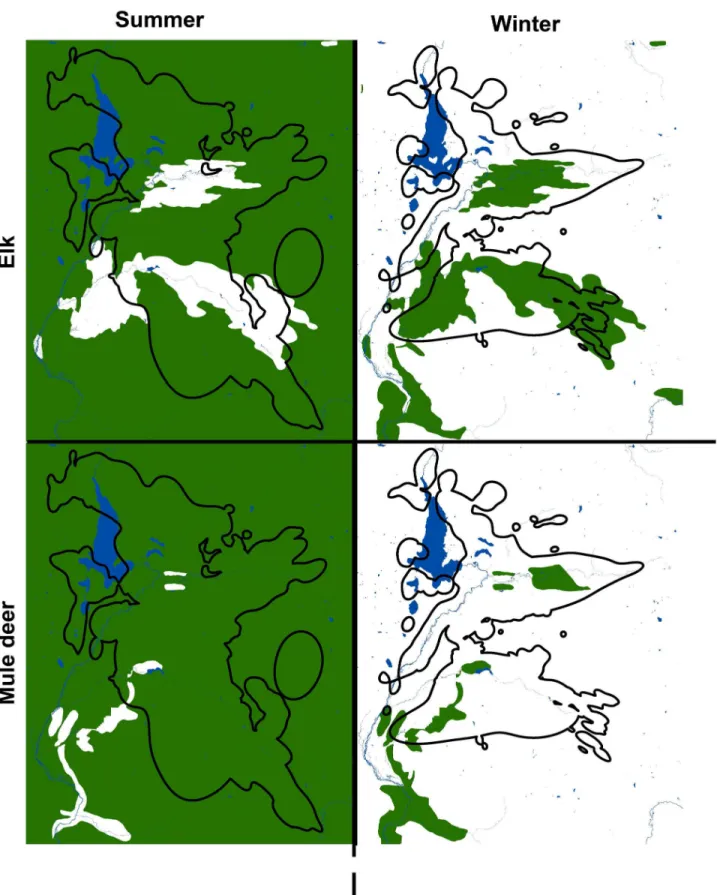
due to seasonal variation in prey vulnerability [8,10], but our data also supported the notion that cougar prey selection was also due to prey availability driven by seasonal variation in the availability of abundant, migratory elk and mule deer (Figure 3). We found support for our hypothesis that cougars would specialize on deer in summer and elk in winter, though only female cougars exhibited this pattern. Male cougars specialized on elk in both seasons, but increased their predation on deer in summer.
Cougars also exhibited seasonal predation of several rare species. In a pattern very similar to that reported in Johnson et al. [2], bighorn sheep were almost exclusively killed in winter, when they dropped in elevation and congregated in larger groups in areas overlapping with abundant elk on winter feed grounds. In contrast, migratory pronghorn were killed almost exclusively in summer when overlapping with abundant mule deer on their summer range. In both cases, an abundant primary prey supported the cougar population, creating the potential for apparent competition scenarios that may be impacting rare prey. Nevertheless, we did not detect a single bighorn sheep or pronghorn killed by a male cougar, and only 9 of 38 (24%) cougars for which we documented prey selection killed moose. This suggests that bighorn sheep, pronghorn, and moose predation is likely stochastic and driven by the presence of individual cougars that select for these prey [22,48], as well as influenced by seasonal shifts in prey abundances and distributions. Only 25% of females and 0 males killed bighorn sheep; only 11% of females and 0 males killed pronghorn. Further, this suggests that any population-level management of cougars to protect rare ungulates in the SYE, such as increasing harvest quotas, would prove ineffective, unless by chance those individual cougars that select for these rare prey species were removed in the process [22].
We did not find support for our prediction that kill rates would be higher in summer than winter, as reported for southern Alberta by Knopff et al. [11]. Whereas cougars did select for younger animals in summer, they may abandon more meat in winter due to scavengers or ice, which can limit their access to carcasses in cold temperatures. However, our model outputs Table 4 (continued).
Cat ID Sex Days monitored Season >1 night Model No. Kills >1 Model Kill Rate (Kills/Day) Full Model No. Kills Full Model Kill Rate (Kills/Day)
M28 M 159 Winter 26 0.16 19 0.12
M28 M 177 Summer 24 0.14 18 0.10
M62 M 140 Winter 22 0.16 13 0.09
M62 M 183 Summer 23 0.13 19 0.10
M62 M 183 Winter 18 0.10 18 0.10
M62 M 77 Summer 6 0.08 7 0.09
M70 M 138 Winter 11 0.08 11 0.08
M70 M 183 Summer 14 0.08 12 0.07
M101 M 117 Winter 15 0.13 13 0.11
M101 M 75 Summer 12 0.16 14 0.19
M101 M 22 Winter 2 0.09 1 0.05
M101 M 69 Summer 11 0.16 12 0.17
Figure 2. Seasonal ranges of mule deer, elk, and cougars in the study area. Seasonal ranges of mule deer and elk in green in the study area, as they overlap with the seasonal ranges of cougars outlined in black. The large lake is Jackson Lake in Grand Teton National Park.
Figure 3. Seasonal ranges of pronghorn, bighorn sheep, and cougars in the study area. Seasonal ranges of pronghorn and bighorn sheep in green in the study area, as they overlap with the seasonal ranges of cougars outlined in black. The large lake is Jackson Lake in Grand Teton National Park.
for kill rates were likely influenced by the difficulty in finding kills too long after the cougar had departed, or when the prey was small (including ungulates up to several months of age). This would influence both our comparison of selection for younger ungulates and the predictive power of our kill rate models. The multiplicity of GPS fix rates employed over the life of the project also likely reduced the effectiveness of many explanatory variables in identifying clusters with and without kills.
Cougars also exhibited seasonal habitat selection for hunting (Figure 4), which we expect was partially driven by prey switching and the habitat preferences of their seasonal prey, as Table 5. Odds ratios for top ranked resource selection function model of seasonal kill sites by cougars.
Winter Summer
Parameter Point estimate
Lower 95% CI
Upper 95% CI
Point estimate
Lower 95% CI
Upper 95% CI Elevation 0.995 0.994 0.996 0.999 0.998 1.000
Edge 0.994 0.992 0.995 0.996 0.994 0.997
H2O 0.999 0.999 1.000 1.001 1.000 1.001
Slope 1.100 1.082 1.119 North 0.622 0.412 0.939 East 0.553 0.394 0.775 West 0.757 0.566 1.013 Meadow 0.473 0.287 0.779
Barren n/a n/a n/a
Forested 0.909 0.694 1.191 Riparian 0.764 0.450 1.298
For categorical variables (aspect and habitat type) south aspects and sagebrush steppe were used as the reference category.
doi: 10.1371/journal.pone.0083375.t005
well as winter snows which restrict movements of predators and prey in the SYE [7,17,18]. As cougars kill prey in different habitats through the year, they distribute resources for numerous scavengers and decomposers [49], as well as macronutrients and microbial biomass (e.g., 50), that in turn, influence distributions of flora and pollinators on the landscape.
Conclusions
Figure 4. Seasonal habitat use by cougars. A comparison between Summer (A) and Winter (B) habitats utilized by cougars projected across the landscape based upon outputs from our Resource Selection Function outputs. The central body of water is Lower Slide Lake in the Bridger-Teton National Forest. Note the position of the Gros Ventre River, which we highlighted to emphasize the influence of “distance to water” in seasonal hunting.
Acknowledgements
We thank our collaborators, including Kerry Murphy (Bridger-Teton NF), Steve Cain (Grand (Bridger-Teton NP), Tim Fuchs (WY Game and Fish), and Eric Cole (National Elk Refuge).
Author Contributions
Conceived and designed the experiments: LME PL JN. Performed the experiments: LME PL JN HQ. Analyzed the data: LME PL JN. Contributed reagents/materials/analysis tools: HQ DC. Wrote the manuscript: LME PL JN HQ DC.
References
1. Giroux MA, Berteaux D, Lecomte N, Gauthier G, Szor G et al. (2012) Benefiting from a migratory prey: spatio-temporal patterns in allochthonous subsidization of an arctic predator. J Anim Ecol 81: 533-542. doi:10.1111/j.1365-2656.2011.01944.x. PubMed: 22268371. 2. Johnson HE, Hebblewhite M, Stephenson TR, German DW, Pierce BM
et al. (2013) Evaluating apparent competition in limiting the recovery of an endangered ungulate. Oecologia 171: 295-307. doi:10.1007/ s00442-012-2397-6. PubMed: 22791131.
3. Schaller GB (1972) The Serengeti Lion: a Study of Predator-Prey Relations. University of Chicago Press, Chicago.
4. Pierce BM, Bleich VC, Wehausen JD, Bowyer RT (1999) Migratory patterns of mountain lions: implications for social regulation and conservation. J Mamm 80: 986-992. doi:10.2307/1383269.
5. Ballard WB, Ayres LA, Krausman PR, Reed DJ, Fancy SG (1997) Ecology of wolves in relation to a migratory caribou herd in northwest Alaska. Wildlife Monogr 135: 3-47.
6. Fryxell JM, Sinclair ARE (1988) Causes and consequences of migration by large herbivores. Trends Ecol Evol 3: 237-241. doi: 10.1016/0169-5347(88)90166-8. PubMed: 21227239.
7. Nelson AA, Kauffman MJ, Middleton AD, Jimenez M, McWhirter D et al. (2012) Elk migration patterns and human activity influence wolf habitat use in the Greater Yellowstone Ecosystem. Ecol Appl 22: 2293-2307. doi:10.1890/11-1829.1.
8. Owen-Smith N (2008) Changing vulnerability to predation related to season and sex in an African ungulate assemblage. Oikos 117: 602– 610. doi:10.1111/j.0030-1299.2008.16309.x.
9. Sand H, Wabakken P, Zimmermann B, Johansson O, Pedersen HC et al. (2008) Summer kill rates and predation pattern in wolf—moose system: can we rely on winter estimates? Oecologia 156: 53–64. doi: 10.1007/s00442-008-0969-2. PubMed: 18270746.
10. Metz MC, Smith DW, Smith JA, Vucetich JA, Stahler DR et al. (2012) Seasonal patterns of predation for gray wolves in the multi-prey system of Yellowstone National Park. J Anim Ecol 81: 553–563. doi:10.1111/j. 1365-2656.2011.01945.x. PubMed: 22260633.
11. Knopff KH, Knopff AA, Kortello A, Boyce MS (2010) Cougar kill rate and prey composition in a multiprey system. J Wild Manage 74: 1435-1447. doi:10.2193/2009-314.
12. Hornocker M, Negri S (2010) Cougar Ecology and Conservation. University of Chicago Press, Chicago.
13. Cooley HS, Robinson HS, Wielgus RB, Lambert CS (2008) Cougar prey selection in a white-tailed deer and mule deer community. J Wildl Manage 72: 99-106. doi:10.2193/2007-060.
14. Husseman JS, Murray DL, Power G, Mack C, Wenger CR et al. (2003) Assessing differential prey selection patterns between two sympatric large carnivores. Oikos 101: 591-601. doi:10.1034/j. 1600-0706.2003.12230.x.
15. Atwood TC, Gese EM, Kunkel KE (2007) Comparative patterns of predation by cougars and recolonizing wolves in Montana's Madison Range. J Wild Manage 71: 1098-1106. doi:10.2193/2006-102. 16. Ruth TK, Murphy K (2010) Cougar–prey relationships. In: M
HornockerS Negri. Cougar: ecology and conservation. Chicago: University of Chicago Press. pp. 138-162.
17. Sawyer H, Lindzey F, McWhirter D (2005) Mule deer and pronghorn migration in western Wyoming. Wild Soc B 33: 1266-1273. Available online at: doi:10.2193/0091-7648(2005)33[1266:MDAPMI]2.0.CO;2 18. Smith BL (2007) Migratory behavior of hunted elk. Northwest Sci 81:
251-264. doi:10.3955/0029-344X-81.4.251.
19. Bartnick TR, Van Deelen TR, Quigley HB, Craighead D (2013) Variation in cougar predation habits during wolf recovery in the southern Greater Yellowstone Ecosystem. Can J Zool 91: 82-93. doi: 10.1139/cjz-2012-0147.
20. Ballard WB, Lutz D, Keegan TW, Carpenter JH, deVos JC Jr (2001) Deer–predator relationships: a review of recent North American studies with emphasis on mule and black-tailed deer. Wildl Soc Bull 29: 99-115.
21. Eberhardt LL, White PJ, Garrott RA, Houston DB (2007) A seventy-year history of trends in Yellowstone's northern elk herd. J Wild Manage 71: 594-602. doi:10.2193/2005-770.
22. Elbroch LM, Wittmer HU (2013) The effects of puma prey selection and specialization on less abundant prey in Patagonia. J Mamm 94: 259-268. doi:10.1644/12-MAMM-A-041.1.
23. Quigley K (2000) Immobilization and biological sampling protocols. Hornocker Wildlife Institute/Wildlife Conservation Society, Moscow. 24. Sikes RS, Gannon WL, the Animal Care and Use Committee of the
American Society of Mammalogists (2011) Guidelines of the American Society of Mammalogists for the use of wild mammals in research. J Mamm 92: 235-253. doi:10.1644/10-MAMM-F-355.1.
25. Knight DH (1996) Mountains and plains: the ecology of Wyoming landscapes. Yale University Press, New Haven.
26. Anderson CR, Lindzey FG (2003) Estimating cougar predation rates from GPS location clusters. J Wild Manage 67: 307-316. doi: 10.2307/3802772.
27. Heffelfinger J (2010) Age criteria for Southwestern game animals. Special Report #19 Arizona Game and Fish Department, Arizona. 28. Knopff KH, Knopff AA, Warren MB, Boyce MS (2009) Evaluating global
positioning system telemetry techniques for estimating cougar predation parameters. J Wild Manage 73: 586-597. doi: 10.2193/2008-294.
29. Miller CS, Hebblewhite M, Petrunenko YK, Seryodkin IV, DeCesare NJ, et al. (2013) Estimating Amur tiger (Pantheratigrisaltaica) kill rates and potential consumption rates using global positioning system collars. J Mamm. In Press
30. Ruth TK, Buotte PC, Quigley HB (2010) Comparing ground telemetry and Global Positioning System methods to determine cougar kill rates. J Wild Manage 74: 1122-1133. doi:10.2193/2009-058.
31. Hosmer DW, Lemshow S (2000) Applied Logistic Regression. John Wiley and Sons, New York.
32. Manly B, McDonald L, Thomas D (1993) Resource Selection by Animals. Chapman & Hall, New York.
33. Worton BJ (1989) Kernel methods for estimating the utilization distribution in home-range studies. Ecology 70: 164-168. doi: 10.2307/1938423.
34. Kie JG, Matthiopoulos J, Fieberg J, Powell RA, Cagnacci F et al. (2010) The home-range concept: are traditional estimators still relevant with modern telemetry technology? Philos T R Soc B 365: 2221-2231. doi: 10.1098/rstb.2010.0093. PubMed: 20566499.
35. Beyer HL (2009–2012) Geospatial Modeling Environment. Available: http://www.spatialecology.com/gme//. Accessed 2012 May 3
36. Loader CR (1999) Bandwidth selection: classical or plug-in? Ann Stat 27: 415-438. doi:10.1214/aos/1018031200.
37. Sappington JM, Longshore KM, Thompson DB (2007) Quantifying landscape ruggedness for animal habitat analysis: a case study using bighorn sheep in the Mojave Desert. J Wild Manage 71: 1419-1426. doi:10.2193/2005-723.
38. Stewart KM, Bowyer RT, Kie JG, Hurley MA (2010) Spatial distributions of mule deer and North American elk: resource partitioning in a sage-steppe environment. Am Midl Nat 163: 400-412. doi: 10.1674/0003-0031-163.2.400.
39. SAS Institute Inc. (1990) SAS/STAT user’s guide, 6.03. SAS Institute Inc., Cary, NC.
40. Compton BW, Rhymer JM, McCollough M (2002) Habitat selection by wood turtles: an application of paired logistic regression. Ecology 83: 833-843. Available online at: doi: 10.1890/0012-9658(2002)083[0833:HSBWTC]2.0.CO;2
41. Boyce MS (2006) Scale for resource selection functions. Divers Distrib 12: 269-276. doi:10.1111/j.1366-9516.2006.00243.x.
42. Long RA, Kie JG, Bowyer RT, Hurley MA (2009) Resource selection and movements by female mule deer: effects of reproductive stage. Wild Biol 15: 288-298.
44. Burnham KP, Anderson DR (2002) Model selection and multimodel inference: a practical information theoretic approach, 2nd ed. Springer-Verlag.
45. Boyce MS, Mao JS, Merrill EH, Fortin D, Turner MG et al. (2003) Scale and heterogeneity in habitat selection by elk in Yellowstone National Park. Ecoscience 10: 421-431.
46. Kauffman MJ, Varley N, Smith DW, Stahler DR, MacNulty DR et al. (2007) Landscape heterogeneity shapes predation in a newly restored predator-prey system. Ecol Lett 10: 690-700. doi:10.1111/j. 1461-0248.2007.01059.x. PubMed: 17594424.
47. Kunkel KE, Ruth TK, Atwood TC, Pletscher DH, Hornocker MG (2013) Assessing the value of wolves and cougars as conservation surrogates
by linking carnivore hunting success with landscape characteristics. Anim Conserv 16: 32-40. doi:10.1111/j.1469-1795.2012.00568.x. 48. Festa-Bianchet M, Coulson T, Gaillard JM, Hogg JT, Pelletier F (2006)
Stochastic predation events and population persistence in bighorn sheep. Proc Biol Sci 273: 1537-1543. PubMed: 16777749.
49. Elbroch LM, Wittmer HU (2013) Nuisance ecology: do scavenging condors exact foraging costs on pumas in Patagonia? PLOS ONE 8: e53595. doi:10.1371/journal.pone.0053595. PubMed: 23301093. 50. Bump JK, Peterson RO, Vucetich JA (2009) Wolves modulate soil