Submitted 2 May 2015 Accepted 4 July 2015 Published11 August 2015 Corresponding author Kirsten Grond, [email protected]
Academic editor Ann Hedrick
Additional Information and Declarations can be found on page 13
DOI10.7717/peerj.1125
Copyright 2015 Grond et al.
Distributed under
Creative Commons CC-BY 4.0 OPEN ACCESS
Prey type and foraging ecology of
Sanderlings
Calidris alba
in di
ff
erent
climate zones: are tropical areas more
favourable than temperate sites?
Kirsten Grond1,5, Yaa Ntiamoa-Baidu2,3, Theunis Piersma1,4and
Jeroen Reneerkens1
1Chair in Global Flyway Ecology, Conservation Ecology Group, Groningen Institute for
Evolu-tionary Life Sciences (GELIFES), University of Groningen, Groningen, The Netherlands
2Centre for African Wetlands, University of Ghana, Accra, Ghana
3Department of Animal Biology and Conservation Science, University of Ghana, Accra, Ghana 4Department of Marine Ecology, NIOZ Royal Netherlands Institute for Sea Research, Den Burg,
The Netherlands
5Current a
ffiliation: Division of Biology, Kansas State University, Manhattan, KS, USA
ABSTRACT
Sanderlings (Calidris alba) are long-distance migratory shorebirds with a
non-breeding range that spans temperate and tropical coastal habitats. Breeding in the High Arctic combined with non-breeding seasons in the tropics necessitate long migrations, which are energetically demanding. On an annual basis, the higher energy expenditures during migration might pay offif food availability in the tropics is higher than at temperate latitudes. We compared foraging behaviour of birds at a north temperate and a tropical non-breeding site in the Netherlands and Ghana, respectively. In both cases the birds used similar habitats (open beaches), and experi-enced similar periods of daylight, which enabled us to compare food abundance and availability, and behavioural time budgets and food intake. During the non-breeding season, Sanderlings in the Netherlands spent 79% of their day foraging; in Ghana birds spent only 38% of the daytime period foraging and the largest proportion of their time resting (58%). The main prey item in the Netherlands was the soft-bodied
polychaeteScolelepis squamata, while Sanderlings in Ghana fed almost exclusively
on the bivalveDonax pulchellus, which they swallowed whole and crushed internally.
Average availability of polychaete worms in the Netherlands was 7.4 g ash free dry
mass (AFDM) m−2, which was one tenth of the 77.1 g AFDM m−2estimated for the
beach in Ghana. In the tropical environment of Ghana the Sanderlings combined relatively low energy requirements with high prey intake rates (1.64 mg opposed to
0.13 mg AFDM s−1for Ghana and the Netherlands respectively). Although this may
suggest that the Ghana beaches are the most favourable environment, processing the hard-shelled bivalve (D. pulchellus) which is the staple food could be costly. The large amount of daytime spent resting in Ghana may be indicative of the time needed to process the shell fragments, rather than indicate rest.
Subjects Animal Behavior, Ecology, Zoology
INTRODUCTION
Shorebirds from the same breeding population are known to migrate different distances,
but the proximate and ultimate factors underlying differential migration are still largely unknown (Cristol, Baker & Carbone, 1999;Piersma, 2007;Reneerkens et al., 2009). Several
mechanisms have been proposed, including latitudinal differences in foraging conditions,
predation risk, inter and intra-specific competition and climate. Prey burying depth and variation in bill length were shown to drive differential migration in Western Sandpipers (Calidris mauri), Black-tailed Godwits (Limosa limosa) and Bar-tailed Godwits (Limosa lapponica) (Mathot, Smith & Elner, 2007;Catry et al., 2012;Duijns et al., 2014). Choice of non-breeding sites in birds is also affected by latitudinal variation in predation risk (Nebel & Ydenberg, 2005;D´ıaz et al., 2013), as was shown for Western Sandpipers for which predator escape performance was one of the factors correlating with segregation between and within sexes at non-breeding sites (Nebel & Ydenberg, 2005).
A factor that has been shown to impact shorebird distribution on a local scale is inter-and intra-specific competition (Fern´andez et al., 2003;van Gils et al., 2015). Black-tailed Godwit populations at preferred breeding and non-breeding sites were observed to remain relatively stable, while steep population increases were documented in potentially less favourable areas indicating the presence of a buffer effect (Gill et al., 2001;Gunnarsson et al., 2005). A similar effect was shown for Sanderling populations in coastal Ghana, where non-breeding populations of Sanderlings (Calidris alba) increased in overall size, resulting in possible increased intra-specific competition of Sanderlings at preferred non-breeding sites (Ntiamoa-Baidu et al., 2014).
Sanderlings are long-distance migrants that breed in the High Arctic and have a world-wide non-breeding distribution (Reneerkens et al., 2009;Scott, 2009). Sanderling
non-breeding areas span over 100◦
of latitude and include coastal habitats at north temperate, tropical and south temperate latitudes (Maron & Myers, 1985). Sanderlings migrating to temperate non-breeding areas have short migration distances, but are
subjected to harsher climatic conditions during the non-breeding season (Castro, Myers
& Ricklefs, 1992). In comparison, Sanderlings that spend the non-breeding season in tropical or south temperate areas benefit from higher ambient temperatures and more stable climatic conditions, but can be negatively affected by increased energy expenditure associated with longer migratory distances. Different stages of the avian life cycle have
different energetic demands, of which migration and breeding are usually regarded the
negatively correlated to ambient temperature which explained 70% of the variance in DEE (Castro, Myers & Ricklefs, 1992). High energy expenditures as a result of lower ambient temperatures result in higher energy requirements by Sanderlings that use temperate non-breeding sites. Therefore, selection of non-breeding area can potentially have large effects on daily energy budgets of Sanderlings, and this potentially affects their demography at the scale of the population due to different fitness parameters of individuals wintering at different locations (Alves et al., 2013a).
Food availability and quality are directly related to suitability of habitat for non-breeding shorebirds (Escudero et al., 2012;van Gils et al., 2013), as only abundant and/or high quality food can sustain shorebirds if climatic conditions are unfavourable (Ruthrauff, Gill & Tibbitts, 2013). Sanderlings have been reported to use a wide variety of food
sources, including arthropods and polychaetes (Perez-Hurtado, Goss-Custard & Garcia,
1997;Petracci, 2002;Castro et al., 2009). Foraging conditions have been shown to shape migratory patterns in shorebirds (Nebel, 2007;Mathot, Smith & Elner, 2007;Catry et al., 2012;Alves et al., 2013b).
In this study we compared activity patterns and foraging behaviour of Sanderlings and prey abundance at a temperate and tropical non-breeding site. We aimed to estimate energy intake at two locations by comparing activity patterns, foraging behaviour and prey characteristics of Sanderlings, as well as ascertain how the observed energy requirements of Sanderlings compare to published estimates of energy expenditure of Sanderlings and other shorebird species. With our study, we provide insights into the importance and role of foraging conditions in the choice of non-breeding sites for shorebirds.
METHODS
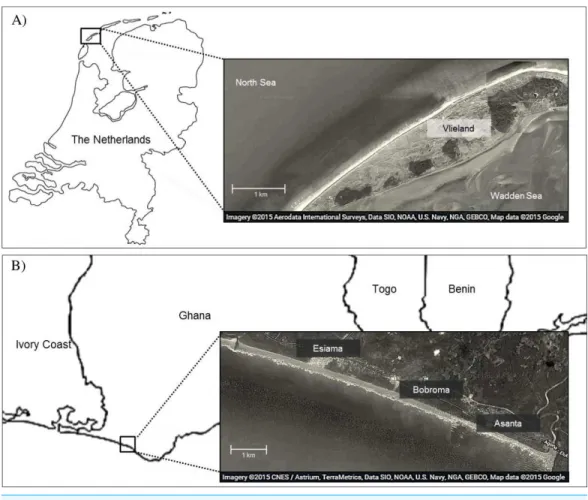
Study sitesWe studied foraging ecology of Sanderlings at Vlieland, an island in the Wadden Sea in the Netherlands (53◦16N, 4◦55E), and at the beach of Esiama (4◦56N, 2◦21W), situated
300 km west of Accra, Ghana (Fig. 1). At Vlieland, Sanderlings were studied along a 6 km
stretch of the North Sea beach for one season between September and November 2007. In Ghana, we studied Sanderlings for two seasons from mid-January to mid-March (2008) and from January to early February (2009). Round trip migration distances from their arctic breeding sites to non-breeding sites in the Netherlands and Ghana approximate 6,300 km and 16,000 km, respectively. Sanderlings remain at temperate non-breeding sites from mid-July to late May, and at tropical non-breeding sites from mid-August until late April (Reneerkens et al., 2009;Lemke, Bowler & Reneerkens, 2012;Ntiamoa-Baidu et al., 2014). Our study sites differed extensively in climatic and site characteristics (Table 1).The weather in the Netherlands in autumn and winter was unstable and heavy storms were not uncommon during this period. Esiama beach (Ghana) stretches over 13 km and is enclosed by the estuaries of two rivers, and the shore was lined with coconut
tree plantations (Ntiamoa-Baidu et al., 2014). Weather in Esiama was stable with few
Figure 1 Map of study area in Vlieland, the Netherlands (A), and Esiama, Ghana (B).Satellite imagery was derived from Google and can be attributed to: Aerodata International Surveys, Data SIO, NOAA, US Navy, NGA, GEBCO, Map data 2015 (A) and CNES/Astrium, TerraMetrica, Data SIO, NOAA, US Navy, NGA, GEBCO, Map data 2015 (B).
Table 1 Study site characteristics of the Netherlands and Ghana.a
Site Years Months Day length (h) Minimum temp (◦C) Maximum temp (◦C) Tidal amplitude (m)
Vlieland, the Netherlands 2007 Sept–Nov 13.2–9.3 3–10 8–17 2.3
Esiama, Ghana 2007, 2008 Jan–Mar 11.8–12.1 23–24 30–31 1.7
Notes.
aNotes: Local day length for the Netherlands and Ghana was taken fromwww.dateandtime.info. Climate data was derived from the Royal Netherlands Meteorological
Institute (www.knmi.nl), and tide data was taken from Rijkswaterstaat—Ministry of Infrastructure and the Environment (www.rijkswaterstaat.nl) for the Netherlands and fromwww.tide-forecast.com/locations/Takoradi-Ghanafor Ghana.
and 11.95 h, respectively. As night foraging is common amongst shorebirds (Robert
& McNeil, 1989;Nol et al., 2014), we extrapolated all estimates of foraging time and
energy intake over a 24 h period. Foraging efficiency at night may be lower for visual
as both consisted of beach habitat (see e.g.,Piersma, de Goeij & Tulp (1993)for issues of comparison).
We spent a total of 37 and 36 field days in the Netherlands and Ghana, respectively, covering 274 and 260 h of observation for time budget estimates. Our observations were spread out over the daylight hours, resulting in 41% of observations between 6 am and 12 noon, and 59% between 12 noon and 6 pm. To monitor prey intake, we observed Sanderlings foraging for a total of 520 and 490 min in the Netherlands and Ghana, respectively. All observations were conducted on wild Sanderlings in their natural environment and we did not handle birds for our study. Therefore, no permission from the Animal Ethics Committee of the University of Groningen (DEC-RUG) was required.
Invertebrate sampling
We studied the marine benthic invertebrate community to assess variation and availability
of different prey species for Sanderlings. In September/October 2008 (Netherlands) and
January 2009/2010 (Ghana), we collected a total of 181 and 614 samples of benthic invertebrates in the upper 20 cm of marine sediment, using sediment cores with inner
diameters of 14.9 cm (0.0174 m2) and 12.5 cm (0.0123 m2). We collected benthos at 100 m
intervals at the tide line, where Sanderlings forage. In 2008, we sampled over the whole length of both study areas seven times during different stages of the tidal cycle, using the
tidal variation to obtain samples at different elevations. We also sampled the Ghanaian
study area twice in 2010 to examine inter-annual variation in the benthic invertebrate community. We sieved samples over 1 mm mesh size on site and benthic invertebrates were frozen until further analyses. We extrapolated benthic invertebrate densities and energetic value to m2.
To assess invertebrate availability to Sanderlings, we measured burying depths of 300 shellfish in Ghana by extracting a core and systematically scraping offvertical layers of sediment. Depth of shellfish exposed was measured from the top of the core to the middle of the shell. We were unable to measure burying depths of the polychaetes in the Netherlands, because they responded to our presence by quickly retreating deep into the sediment.
Benthic invertebrates were identified to species level, counted and measured to the
nearest mm. We dried invertebrate samples at 60◦
C for two days, determined ash-free dry mass (AFDM) by subtracting ash weight from dried sample weight and determined ash mass using the end product of processing the samples in a bomb-calorimeter. We used a bomb-calorimeter to estimate energy content of our polychaete and other invertebrate samples. Where possible, samples were processed as duplicates to assess measurement precision, and values were averaged. For shellfish, we used a fixed value of 22 kJ g−1AFDM,
in further analyses due to inconsistencies in energy measurements (Zwarts & Wanink,
1993). We calculated prey quality followingYang et al. (2013), using:
Q=d×a×AFDMflesh
wheredis the energetic density of the flesh (22 kJ g−1 AFDM) andais digestion efficiency (0.82) (Castro et al., 2008;Yang et al., 2013). Size differences between shells were not taken into account, as the majority (>90%) of shells collected measured between 0.5 and 0.7 cm.
Time budgets
We conducted daily surveys covering the entire study area and recorded time, place and behavior of each individual encountered. We categorized time of observations into hours before and after low tide, enabling us to relate behavior to the tidal cycle. Our ethogram included: (1) Foraging: birds were actively foraging and ingesting food; foraging included both probing and pecking, (2) Resting: birds were not foraging, but stood or lied down with little or no apparent movement, (3) Preening: birds actively preened and/or bathed, and (4) Locomotion: birds were actively moving between locations. Locomotion included all running and flying between foraging and roosting sites. Based on the time birds spent
exerting different behaviors over the period of each survey, we calculated daily time
budgets of Sanderlings at both study sites.
Prey intake
We observed individual Sanderlings for up to 10 min through a spotting telescope to determine food intake rate. To ensure independence of observations among foraging birds, we focused our observations on color-banded individuals and avoided recording measurements from the same individuals within the same flock on the same day. We measured prey intake rate, and identified prey type when possible. We recorded successful ingestion of large-bodied prey by counting swallowing movements of the foraging bird, identified by a fast upward movement of the head. Energy intake was calculated as the weighted average of intake rates observed from Sanderlings foraging during the whole tidal cycle and extrapolated to energy intake/hour, using known energy contents of prey items. Due to distance and the high foraging speed of Sanderlings, prey could only be classified as polychaete or non-polychaete during field observations. We calculated prey intake rates by multiplying the energy values we determined for polychaete and non-polychaete prey by the observed prey ingested during timed foraging observations. For polychaete prey,
energetic content estimated we included polychaetes>20 mm in size, as we were unable
to observe ingestion of smaller polychaetes. We did not differentiate between polychaetes
>20 mm in our calculations, as we could not accurately estimate prey size in the field. As a gauge for the energy requirements at the two sites, we used the empirical value for DEE measured in Texas in winter (135 kJ/day) byCastro, Myers & Ricklefs (1992)for the Netherlands. Ambient temperature during the Texas winter was comparable to average
autumn temperatures in the Netherlands during our study (10◦C and 14◦C, respectively).
As an approximation of DEE in Ghana we used 100 kJ/day, which was measured for Sanderlings spending the non-breeding season in Panama. Temperatures between Panama
and Ghana are also comparable (27◦
C and 32◦
Statistics
We used a Generalized Linear Model to compare proportion of foraging Sanderlings between sites and at different times of the tidal cycle. Our full model is shown below:
%Foraging∼Site+Tide+Tide2+Site∗Tide+Site∗Tide2
Tide was expressed in hours before and after low tide. We used Tide2because we expected a
quadratic relationship between proportion of birds foraging and time in the tidal cycle. All statistical analyses were conducted using the R environment for statistical programming
version 3.1.0 (R Development Core Team, 2010). All means are presented±1SE.
RESULTS
Food availability and quality
Prey type, abundance and energetic content differed extensively between sites. In the
Netherlands, 94.5% of the benthic species in our samples consisted of the polychaete
Scolelepis squamata, with the amphipodHaustorius arenarius(4.5%) as the second most abundant prey species. The biomass of sanderling prey at the beach in the Netherlands
was 7.4±1.6 g AFDM m−2, and invertebrate distributions were positively correlated with
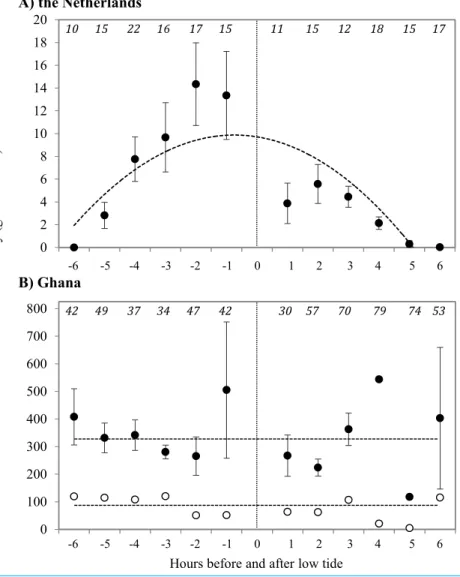
the timing relative to low tide (Fig. 2). The average energy values of these two invertebrate
species were 40.5±0.41 kJ g−1and 20.3±0.04 kJ g−1AFDM, respectively. For AFDM
in the Netherlands, time within the tidal cycle explained 64% of the variation in biomass (R2=0.64;Fig. 2A). The highest densities ofS. squamatawere found furthest away from
the high tide line, and thus only available during low tide. Average AFDM g−1sample for
polychaetes of different sizes (20 mm–>50 mm) varied between 0.75 and 0.88, with an
overall average of 0.83±0.01 g AFDM g−1sample. These intake rates are only based on
the ingestion of polychaetes, as we were unable to identify non-polychaete prey in the field.
Average polychaete prey capture rate was 0.075 polychaete s−1during our 10 min intake
observations. The benthic fauna of the Ghana beach was dominated by the bivalveDonax
pulchelluswhich accounted for over 95% in numbers of all organisms found in the samples.
Sanderlings were observed to feed almost exclusively on this bivalve.Hydrobia ulvaewas
the second most abundant species in Ghana with highest densities further away from the shore thanD. pulchellus.D. pulchelluswere distributed over the whole width of the beach
with an average energetic content of 77 g AFDM m−2, but occurred in highest densities
in a 1–3 m wide shell bank (up to 170,000 individuals m−2/1,146 g AFDM m−2), that was
present in both 2008 and 2009 and clearly visible. Although we sampled benthos up to
a depth of 20 cm, we only detected invertebrates in the top sediment layer.D. pulchellus
had a burying depth of 1.09±0.72 cm, and were thus always available to the Sanderlings,
which have bill lengths of 2.5 cm. Sanderlings in the Netherlands were observed to feed onS. squamataand small prey unidentifiable by sight by us. Polychaetes accounted for 45% of successful prey intakes, and the other 55% was composed of small, unidentifiable prey items. Prey quality ofD. pulchelluswas estimated at 4.59±0.12 kJ g−1DMshell,
Figure 2 Density of prey at the tide line in g AFDM/m2at (A) Vlieland, the Netherlands, and (B) Esiama, Ghana. Invertebrate densities in Ghana are shown as average values of all samples (open circles) and average values of samples collected only from the shell bank (closed circles). (A)Y= −6.086x2+71.207x−35.117,R2=0.6414 (t= −3.825,p=0.004). (B) Dashed lines represent the average benthic invertebrate densities, as correlations were not significant. Open: 337.4 g AFDM/m2 (t= −0.900,p=0.3914); Closed: 78.1 g AFDM/m2(t=0.303,p=0.768). Thex-axis represents hours
before and after low tide, with low tide (0) marked by the dotted line.−6 h before low tide corresponds to high tide, with water receding towards low tide at (0). 0–6 h represent the incoming tide from low (0) to high (6). Number of sediment cores collected are shown in italics at the top of the graphs. Error bars represent standard error.
respectively. We processed allH. arenariusin a single sample, thus cannot provide a
SE estimate.
Sanderling time budgets and prey intake
Average Sanderling densities were 34±0.7 birds km−1in the Netherlands and 214±2.6
birds km−1in Ghana, respectively. We estimated density over a one-dimensional space
Figure 3 Percentage of time spent by Sanderlings in the Netherlands (Vlieland) and Ghana (Esiama) on the four major behaviours observed.
on the beach or in small groups (<10 birds) while in Ghana they occurred in large
flocks (>50 birds). Time budgets of Sanderlings during the non-breeding period in
the Netherlands and Ghana differed predominantly in time spent foraging and resting
(Fig. 3). We adjusted time budget calculations to average day lengths in the Netherlands and Ghana during our study period. In the Netherlands, the Sanderlings’ main activity was foraging, which comprised 68.3% (17.8 h) of their time, while in Ghana, Sanderlings foraged 35.1% (9.0 h) of the time. In Ghana, 56.4% of the birds observed were resting,
opposed to 13.6% in the Netherlands. The interaction Site*Tide and Site*Tide2in our
model were not significant and the model we used for our analyses only included Site and Tide2. The proportion of Sanderlings observed to be foraging differed significantly between sites (GLM,t23=4.0,p<0.0007), but no significant correlation between the
proportion of foraging birds and the stage in the tidal cycle was found at either site
(GLM,t23= −0.576,p=0.57). Preening and locomotion accounted for 4.0–8.1%
and 0.5–14.1% of daily effort in the Netherlands and Ghana. Foraging and resting
was independent of the tidal cycle in Ghana, but in the Netherlands the percentage of foraging birds appeared to show a slight increase around low tide, though not significant (Fig. 4).
The average caloric intake of Sanderlings was estimated to be 0.13 mg AFDM s−1(2.28
J s−1) in the Netherlands compared to 1.64 mg AFDM s−1(36.27 J s−1) in Ghana. For
Sanderlings in the Netherlands there was a tendency for a positive correlation between
foraging time and benthos availability (ANOVA, F2=3.166,p=0.105), while in Ghana
Figure 4 Time budgets of Sanderlings in the Netherlands and Ghana classified per hour before and after low tide.Zero on thex-axis represents low tide and 6 and−6 represents high tide.
DISCUSSION
Selection of non-breeding sites had a large effect on time budgets and behaviour of
Sanderlings. Sanderlings in the Netherlands foraged almost twice as long as in Ghana during the non-breeding season. If tropical habitats are more energetically favourable for non-breeding Sanderlings, why do Sanderlings have such a wide non-breeding range? In tropical areas, we assumed that DEE was lower due to lower thermoregulatory costs as described byCastro, Myers & Ricklefs (1992). If our sites were comparable to sites inCastro, Myers & Ricklefs (1992)with respect to DEE, our estimated energy intake would need Sanderlings to forage 20.1 and 0.9 h per 24 h in the Netherlands and Ghana, respectively, to meet their energy requirements. For our calculations, we assumed a digestive efficiency
of 82% which was estimated for Snowy Plovers (Charadrius alexandrinus) (Castro et al.,
2008). However, if we extrapolate our observed percentages of birds foraging to a 24 h
period, we find that Sanderlings in the Netherlands and Ghana forage for 19.0 and 9.0 h, respectively. Expected foraging time for the Netherlands is close to the observed foraging time, but Sanderlings in Ghana exceed expected foraging time by almost 10-fold. Food availability and quality could cause this discrepancy, because Sanderlings in two other tropical locations with similar ambient temperatures within Sanderlings’ thermoneutral
zone, foraged for different periods per day. Sanderlings in Kenya were observed to spend
51%/12.4 h of their time foraging during the non-breeding period (Fasola & Biddau, 1997), which is longer than at tropical sites investigated in our study (35%/9.0 h) and byCastro, Myers & Ricklefs (1992)in Panama (40%/9.0 h).
We were only able to identify prey type captured in 45% of intake observations in
the Netherlands. Our benthic samples contained amphipods such asH. arenarius, but
abundances were too low to account for over half of our observed ingestions. A recent study identified biofilm on mud flats as an important food source for Western Sandpipers, comprising 50% of their daily energy intake (Kuwae et al., 2008;Jardine et al., 2015).
Although biofilm formation occurs on some beaches as well (Piggot et al., 2012) and
Sanderlings possess the tongue spine structures associated with biofilm feeding (Kuwae et
al., 2012), the powerful waves at Vlieland are likely to inhibit formation of biofilm in high abundances.
Sanderlings utilize a wide variety of food sources throughout the year, which mainly consist of soft-bodied prey items. Benthic fauna in Ghana was dominated by the bivalve
Donax pulchellus, and prey availability in Ghana was high, which could present an
advantage to Sanderlings spending the non-breeding season at this site.Piersma, de
Goeij & Tulp (1993)estimated that total biomass of temperate and tropical intertidal
foraging areas ranged between 5 and 80 g AFDM m−2, with no latitudinal trend present.
The average biomass at our study sites was 77 g AFDM m−2, which is on the richer side
of the spectrum. Local biomass within the shell bank exceeded 1 kg AFDM m−2. The
energetic benefit of bivalve prey could be lower than expected, as different prey types would
require different processing costs. Red Knots develop a muscular gizzard to process food
measured between Red Knots which were fed either soft-bodied prey or shellfish (Piersma et al., 2003). Nonetheless, reliance on a prey source that mainly consists of hard shell throughout the non-breeding season was less energetically favourable for Sanderlings than soft-bodied prey.
High processing costs and relatively low energetic gain of a bivalve diet of Sanderlings
in Ghana translated into low prey quality. Prey quality ofD. pulchelluswas estimated
at 4.59±0.12 kJ g−1DMshell, which was over 20 times lower than quality of the main
soft-bodied prey in the Netherlands,S. squamata. Although low compared to soft-bodied
prey, our estimate of bivalve prey quality was higher than found for Red Knot bivalve prey which ranged from 0.89±0.07 kJ g−1DMshellin Australia (van Gils et al., 2005) to 3.50 ±0.23 kJ g−1DMshellin Argentina (Gonz´alez, Piersma & Verkuil, 2015).Yang et al. (2013)
discovered that despite low prey quality of 1.32 kJ g−1DM
shell, Red Knots were successful
in pre-migratory fattening due to high food availability and local bivalves being easily crushed in the gizzard.D. pulchellusin Ghana are relatively large (∼7 mm) and realized
prey quality could be lower to Sanderlings if hard to crush, as we based prey quality only on flesh to shell ratios and did not take crushability into account (van Gils et al., 2005). We extrapolated hourly intake from our 10 min field observations, and it is likely that the birds did not forage at this rate continuously, but either reduced prey intake or interrupted foraging bouts by short periods of rest. The latter behavior was observed in Red Knots, for which these resting periods were found to be digestive breaks. During digestive breaks, Red Knots processed ingested shell matter which refrained them from foraging at optimal rate (van Gils et al., 2004). This is likely also the case for Sanderlings if crushing and processing ofD. pulchellusis demanding with respect to time and energetic cost. One factor that we did not take into account was the effect of differences in salinity between the Netherlands and Ghana. Tropical environments are usually characterized by high salinity (Talley, 2002), which in shorebirds can result in physiological stress such as an increased Basal Metabolic
Rate (BMR) and suboptimal food intake (Guti´errez et al., 2015). Although this can be an
important factor affecting foraging ecology, our site in Ghana was flanked by two riverine estuaries, which likely decrease salinity on a local scale.
Another reason for spending the non-breeding season in the temperate zone is that the advantages of lower energy expenditure potentially may not compensate for the disadvantages of a longer migration if paired with survival costs. The survival repercussions of longer migration can be large (e.g.,Sillett & Holmes, 2002;Lok, Overdijk & Piersma, 2015). In several species of resident and migratory sparrows, survival during the non-breeding season at southern sites was found to be higher, but annual survival was equal in northern non-breeding birds (Sandercock & Jaramillo, 2002).
We showed that selection of non-breeding sites can result in large differences in
of energy expenditure of Sanderlings throughout their non-breeding range, diurnal and especially nocturnal foraging behaviour, and prey characteristics and availability could further elucidate the relationship between energy expenditure and requirements.
ACKNOWLEDGEMENTS
We thank Edward Koomson, Alfred A. Nuoh and Samuel Adu for providing logistical assistance and valuable help during fieldwork in Esiama, Ghana, and Carl Zuhorn (Staatsbosbeheer) for providing housing and logistical and field support during field work on Vlieland, the Netherlands. Brett K. Sandercock and two anonymous reviewers provided comments, which notably improved our manuscript. All sampling procedures were in compliance with animal welfare laws of the Netherlands.
ADDITIONAL INFORMATION AND DECLARATIONS
Funding
Our study was funded by a WOTRO and an International Polar Year grants from the Netherlands Organisation for Scientific research (TP, YNB and JR), the Waddenfond project ‘Metawad’ (WF 209925; TP, JR) and private support through the Global Flyway Network (YNB). Fieldwork in Ghana was partially funded by a Groningen University Grant and a grant from the Marco Polo Study Abroad Fund from the University of Groningen awarded to KG. Publication of this article was funded in part by the Kansas State University Open Access Publishing Fund. The funders had no role in study design, data collection and analysis, decision to publish, or preparation of the manuscript.
Grant Disclosures
The following grant information was disclosed by the authors:
Netherlands Organisation for Scientific research: WOTRO & IPY grants. Waddenfonds project: WF 209925.
Global Flyway Network. Groningen University Fund. Marco Polo Study Abroad Fund.
Kansas State University Open Access Publishing Fund.
Competing Interests
The authors declare there are no competing interests.
Author Contributions
• Kirsten Grond conceived and designed the experiments, performed the experiments,
analyzed the data, wrote the paper, prepared figures and/or tables, reviewed drafts of the paper.
• Yaa Ntiamoa-Baidu contributed reagents/materials/analysis tools, reviewed drafts of the
paper.
• Jeroen Reneerkens conceived and designed the experiments, performed the
experi-ments, analyzed the data, contributed reagents/materials/analysis tools, reviewed drafts of the paper.
Animal Ethics
The following information was supplied relating to ethical approvals (i.e., approving body and any reference numbers):
We only observed wild Sanderlings in their natural environment and did not handle them for our study. No permission from the Animal Ethics Committee of the University of Groningen (DEC-RUG) was required for this study.
Supplemental Information
Supplemental information for this article can be found online athttp://dx.doi.org/
10.7717/peerj.1125#supplemental-information.
REFERENCES
Alves JA, Gunnarsson TG, Hayhow DB, Appleton GF, Potts PM, Sutherland WJ, Gill JA. 2013a.
Costs, benefits, and fitness consequences of different migratory strategies.Ecology94:11–17
DOI 10.1890/12-0737.1.
Alves JA, Gunnarsson TG, Potts PM, Sutherland WJ, Gill JA. 2013b.Sex-biases in distribution and resource use at different spatial scales in a migratory shorebird.Ecology and Evolution
3:1079–1090DOI 10.1002/ece3.503.
Buehler DM, Piersma T. 2008.Travelling on a budget: predictions and ecological evidence for bottlenecks in the annual cycle of long-distance migrants.Philosophical Transactions of the Royal Society of London, Series B: Biological Sciences363:247–266DOI 10.1098/rstb.2007.2138.
Castro G, Myers JP, Ricklefs RE. 1992.Ecology and energetics of Sanderlings migrating to four latitudes.Ecology73:833–844DOI 10.2307/1940161.
Castro M, Masero JA, Megina C, Amat JA, P´erez-Hurtado A. 2008.Energy and macronutrient assimilation efficiencies of Snowy Plover (Charadrius alexandrinus) feeding on the polychaete ragwormNereis diversicolor.Auk125:368–373DOI 10.1525/auk.2008.060144.
Castro M, Suazo CG, Quiroga E, Baessolo L, Arriagada AM, Santos-Pavletic GD. 2009.Diet selection of Sanderlings (Calidris alba) in Isla Guamblin national park in the Chilean fjords. Ornitolog´ıa Neotropical20:247–253.
Catry T, Alves JA, Gill JA, Gunnarsson TG, Granadeiro JP. 2012.Sex promotes spatial and dietary segregation in a migratory shorebird during the non-breeding season.PLoS ONE7:e33811
DOI 10.1371/journal.pone.0033811.
Cristol DA, Baker MB, Carbone C. 1999.Differential migration revisited. Latitudinal segregation by age and sex class. In: Nolan V, ed. Current Ornithology, vol. 15. New York: Kluwer Academic/Plenum Publishers, 33–88.
D´ıaz M, Møller AP, Flensted-Jensen E, Grim T, Ib´a˜nez- ´Alamo JD, Jokim¨aki J, Mark ´o G, Tryjanowski P. 2013.The geography of fear: a latitudinal gradient in anti-predator escape distances of birds across Europe.PLoS ONE8:e64634DOI 10.1371/journal.pone.0064634.
Duijns S, van Gils JA, Spaans B, ten Horn J, Brugge M, Piersma T. 2014.Sex-specific winter distribution in a sexually dimorphic shorebird is explained by resource partitioning.Ecology and Evolution4:4009–4018DOI 10.1002/ece3.1213.
Escudero G, Navedo JG, Piersma T, De Goeij P, Edelaar P. 2012.Foraging conditions at the end of the world in the context of long-distance migration and population declines in Red Knots. Austral Ecology37:355–364DOI 10.1111/j.1442-9993.2011.02283.x.
Fasola M, Biddau L. 1997.An assemblage of wintering waders in coastal Kenya: activity budget and habitat use.African Journal of Ecology35:339–350DOI 10.1111/j.1365-2028.1997.087-89087.x.
Fern´andez G, De la Cueva H, Warnock N, Lank DB, Powell A. 2003.Apparent survival rates of Western Sandpiper (Calidris mauri) wintering in northwest Baja California, Mexico.Auk
120:55–61DOI 10.1642/0004-8038(2003)120[0055:ASROWS]2.0.CO;2.
Gill JA, Norris K, Potts PM, Gunnarsson TG, Atkinson PW, Sutherland WJ. 2001.The buffer effect and large-scale population regulation in migratory birds.Nature412:436–438
DOI 10.1038/35086568.
van Gils JA, Battley PF, Piersma T, Drent R. 2005. Reinterpretation of gizzard sizes of Red Knots world-wide emphasises overriding importance of prey quality at migratory stopover sites. Proceedings of the Royal Society B: Biological Sciences272:2609–2618
DOI 10.1098/rspb.2005.3245.
van Gils JA, De Rooij SR, van Belle J, van der Meer J, Dekinga A, Piersma T, Drent R. 2004.
Digestive bottleneck affects foraging decisions in Red KnotsCalidris canutus. I. Prey choice. Journal of Animal Ecology74:105–119DOI 10.1111/j.1365-2656.2004.00903.x.
van Gils JA, van der Geest M, De Meulenaer B, Gillis H, Piersma T, Folmer EO. 2015.Moving on with foraging theory: incorporating movement decisions into the functional response of a gregarious shorebird.Journal of Animal Ecology84:554–564DOI 10.1111/1365-2656.12301.
van Gils JA, van der Geest M, Leyrer J, Oudman T, Lok T, Onrust J, De Fouw J, van der Heide T, van den Hout PJ, Spaans B, Dekinga A, Brugge M, Piersma T. 2013.Toxin constraint explains diet choice, survival and population dynamics in a molluscivore shorebird.Proceedings of the Royal Society B: Biological Sciences280:20130861DOI 10.1098/rspb.2013.0861.
Gonz´alez PM, Piersma T, Verkuil YI. 2015.Food, feeding, and refuelling of Red Knots during northward migration at San Antonio Oeste, Rio Negro, Argentina.Journal of Field Ornithology
67:575–591.
Gunnarsson TG, Gill JA, Petersen A, Appleton GF, Sutherland WJ. 2005.A double buffer effect in a migratory shorebird population. Journal of Animal Ecology74:965–971
DOI 10.1111/j.1365-2656.2005.00994.x.
Guti´errez JS, Soriano-Redondo A, Dekinga A, Villegas A, Masero JA, Piersma T. 2015.
How salinity and temperature combine to affect physiological state and performance in Red Knots with contrasting non-breeding environments.Oecologia178:1077–1091
DOI 10.1007/s00442-015-3308-4.
Jardine CB, Bond AL, Davidson PJA, Butler RW, Kuwae T. 2015.Biofilm consumption and variable diet composition of western sandpipers (Calidris mauri) during migratory stopover. PLoS ONE10:e0124164DOI 10.1371/journal.pone.0124164.
Kersten M, Bruinzeel LW, Wiersma P, Piersma T. 1998.Reduced basal metabolic rate of migratory waders wintering in coastal Africa.Ardea86:71–80.
Kuwae T, Beninger PG, Decottignies P, Mathot KJ, Lund DR, Elner RW. 2008. Biofilm grazing in a higher vertebrate: the Western Sandpiper,Calidris mauri.Ecology89:599–606
Kuwae T, Miyoshi E, Hosokawa S, Ichimi K, Hosoya J, Amano T, Moriya T, Kondoh M, Ydenberg RC, Elner RW. 2012.Variable and complex food web structures revealed by exploring missing trophic links between birds and biofilm.Ecology Letters15:347–356
DOI 10.1111/j.1461-0248.2012.01744.x.
Lemke HW, Bowler J, Reneerkens J. 2012.Establishing the right period to estimate juvenile proportions of wintering Sanderlings via telescope scans in western Scotland.Wader Study Group Bulletin119:129–132.
Lok T, Overdijk O, Piersma T. 2015.The cost of migration: spoonbills suffer higher mortality during trans-Saharan spring migrations only.Biology Letters11:20140944
DOI 10.1098/rsbl.2014.0944.
Maron JL, Myers JP. 1985.Seasonal changes in feeding success, activity patterns, and weights of nonbreeding Sanderlings (Calidris alba).Auk102:580–586.
Mathot KJ, Smith BD, Elner RW. 2007.Latitudinal clines in food distribution correlate with differential migration in the Western Sandpiper.Ecology88:781–791DOI 10.1890/06-1225.
Nebel S. 2007.Differential migration of shorebirds in the East Asian–Australasian Flyway.Emu
107:14–18DOI 10.1071/MU06006.
Nebel S, Ydenberg RC. 2005.Differential predator escape performance contributes to a latitudinal sex ratio cline in a migratory shorebird.Behavioral Ecology and Sociobiology 59:44–50
DOI 10.1007/s00265-005-0007-x.
Nol E, MacCulloch K, Pollock L, McKinnon L. 2014. Foraging ecology and time budgets of non-breeding shorebirds in coastal Cuba. Journal of Tropical Ecology30:347–357
DOI 10.1017/S0266467414000182.
Ntiamoa-Baidu Y, Nuoh AA, Reneerkens J, Piersma T. 2014. Population increases in non-breeding Sanderlings in Ghana indicate site preference. Ardea 102:131–137
DOI 10.5253/arde.v102i2.a3.
Perez-Hurtado A, Goss-Custard JD, Garcia F. 1997.The diet of wintering waders in C´adiz Bay, southwest Spain.Bird Study44:45–52DOI 10.1080/00063659709461037.
Petracci P. 2002.Diet of Sanderling in Buenos Aires province Argentina.Waterbirds25:366–370
DOI 10.1675/1524-4695(2002)025[0366:DOSIBA]2.0.CO;2.
Piersma T. 2002.Energetic bottlenecks and other design constraints in avian annual cycles. Integrative and Comparative Biology42:51–67DOI 10.1093/icb/42.1.51.
Piersma T. 2007.Using the power of comparison to explain habitat use and migration strategies of shorebirds worldwide.Journal of Ornithology148:45–59DOI 10.1007/s10336-007-0240-3.
Piersma T, De Goeij P, Tulp I. 1993.An evaluation of intertidal feeding habitats from a shorebird perspective: towards relevant comparisons between temperate and tropical mudflats. Netherlands Journal of Sea Research31:503–512DOI 10.1016/0077-7579(93)90062-W.
Piersma T, Koolhaas A, Dekinga A. 1993.Interactions between stomach structure and diet choice in shorebirds.Auk110:552–564DOI 10.2307/4088419.
Piersma T, Lindstr¨om A, Drent RH, Tulp I, Jukema J, Morrison RIG, Reneerkens J, Schekkerman H, Visser GH. 2003. High daily energy expenditure of incubating shorebirds on High Arctic tundra: a circumpolar study.Functional Ecology17:356–362
DOI 10.1046/j.1365-2435.2003.00741.x.
R Development Core Team. 2010.R: a language and environment for statistical computing. Vienna: R Foundation for Statistical Computing.Available athttp://www.R-project.org/.
Reneerkens J, Benhoussa A, Boland H, Collier M, Grond K, G¨unther K, Hallgrimsson GT, Hansen J, Meissner W, De Meulenaer B, Ntiamoa-Baidu Y, Piersma T, Poot M, van Roomen M, Summers RW, Tomkovich PS, Underhill LG. 2009.Sanderlings using African–Eurasian flyways: a review of current knowledge.Wader Study Group Bulletin116:2–20.
Robert M, McNeil R. 1989.Comparative day and night feeding strategies of shorebird species in a tropical environment.Ibis131:69–79DOI 10.1111/j.1474-919X.1989.tb02745.x.
RuthrauffDR, Gill RE, Tibbitts TL. 2013.Coping with the cold: an ecological context for the abundance and distribution of Rock Sandpipers during winter in upper Cook Inlet, Alaska. Arctic66:269–278DOI 10.14430/arctic4306.
Sandercock BK, Jaramillo A. 2002.Annual survival rates of wintering sparrows: assessing demographic consequences of migration. Auk 119:149–165 DOI
10.1642/0004-8038(2002)119[0149:ASROWS]2.0.CO;2.
Scott D. 2009.Scott D, Delany S, Dodman T, Stroud D, eds.An atlas of wader populations in Africa and Western Eurasia. 1st edition. Wageningen: Wetlands International, 369–374.
Sillett TS, Holmes RT. 2002.Variation in survivorship of a migratory songbird through its annual cycle.Journal of Animal Ecology71:296–308DOI 10.1046/j.1365-2656.2002.00599.x.
Talley LD. 2002.Salinity patterns in the ocean. In: MacCracken MC, Perry JS, eds.The Earth system: physical and chemical dimensions of global environmental change, vol. 1. Chichester: John Wiley & Sons, Ltd, 629–640.
Wiersma P, Piersma T. 1994.Effects of microhabitat, flocking, climate and migratory goal on energy expenditure in the annual cycle of Red Knots.Condor96:257–279DOI 10.2307/1369313.
Yang H, Chen B, Ma Z, Hua N, van Gils JA, Zhang Z, Piersma T. 2013.Economic design in a long-distance migrating molluscivore: how fast-fuelling Red Knots in Bohai Bay, China, get away with small gizzards.Journal of Experimental Biology 216:3627–3636
DOI 10.1242/jeb.083576.
Zwarts L, Wanink J. 1993.How the food supply harvestable by waders in the Wadden Sea depends on the variation in energy density, body weight, biomass, burying depth and behaviour of tidal-flat invertebrates.Netherlands Journal of Sea Research31:441–476