www.atmos-chem-phys.net/11/5407/2011/ doi:10.5194/acp-11-5407-2011
© Author(s) 2011. CC Attribution 3.0 License.
Chemistry
and Physics
Theoretical basis for convective invigoration due to increased
aerosol concentration
Z. J. Lebo1and J. H. Seinfeld1,2
1Environmental Science and Engineering, California Institute of Technology, Pasadena, 91125, CA, USA 2Chemical Engineering, California Institute of Technology, Pasadena, 91125, CA, USA
Received: 3 January 2011 – Published in Atmos. Chem. Phys. Discuss.: 24 January 2011 Revised: 9 May 2011 – Accepted: 27 May 2011 – Published: 9 June 2011
Abstract. The potential effects of increased aerosol load-ing on the development of deep convective clouds and re-sulting precipitation amounts are studied by employing the Weather Research and Forecasting (WRF) model as a de-tailed high-resolution cloud resolving model (CRM) with both detailed bulk and bin microphysics schemes. Both mod-els include a physically-based activation scheme that incor-porates a size-resolved aerosol population. We demonstrate that the aerosol-induced effect is controlled by the balance between latent heating and the increase in condensed wa-ter aloft, each having opposing effects on buoyancy. It is also shown that under polluted conditions, increases in the CCN number concentration reduce the cumulative precip-itation due to the competition between the sedimentation and evaporation/sublimation timescales. The effect of an in-crease in the IN number concentration on the dynamics of deep convective clouds is small and the resulting decrease in domain-averaged cumulative precipitation is shown not to be statistically significant, but may act to suppress precipita-tion. It is also shown that even in the presence of a decrease in the domain-averaged cumulative precipitation, an increase in the precipitation variance, or in other words, andincrease in rainfall intensity, may be expected in more polluted envi-ronments, especially in moist environments.
A significant difference exists between the predictions based on the bin and bulk microphysics schemes of precip-itation and the influence of aerosol perturbations on updraft velocity within the convective core. The bulk microphysics scheme shows little change in the latent heating rates due to an increase in the CCN number concentration, while the bin microphysics scheme demonstrates significant increases
Correspondence to:Z. J. Lebo ([email protected])
in the latent heating aloft with increasing CCN number con-centration. This suggests that even a detailed two-bulk mi-crophysics scheme, coupled to a detailed activation scheme, may not be sufficient to predict small changes that result from perturbations in aerosol loading.
1 Introduction
an oversimplification of the continuous cascade of processes that ensue in response to a perturbation in the aerosol number concentration.
Considerable attention has been given to the effects of aerosol particles on cloud properties for warm stratiform clouds (e.g., Ackerman et al., 2004; Lu and Seinfeld, 2006; Sandu et al., 2008; Hill et al., 2008, 2009; Wang and Fein-gold, 2009a,b; Wang et al., 2010). The extent to which these processes hold in mixed-phase and/or cold clouds is not well established. The ice phase presents significant com-plexities not present in warm clouds (i.e., riming, aggre-gation, accretion, heterogeneous and homogeneous freez-ing, meltfreez-ing, etc.), and the mixed-phase processes are the predominant mechanisms by which rain forms (not directly by collision-coalescence of liquid droplets into larger, rain drops). Recently, the potential effects of polluted environ-ments on the formation and development of deep convec-tive clouds have received attention via both modeling stud-ies using a 3-D CRM with bulk microphysics (e.g., Van den Heever et al., 2006; Van den Heever and Cotton, 2007), 3-D CRM with bin microphysics (e.g., Khain et al., 2008; Khain and Lynn, 2009), 2-D CRM with bin microphysics (e.g., Fan et al., 2009) and, less commonly, observational analyses (e.g., Koren et al., 2005, 2010).
Conceptual hypotheses have been put forth by Rosenfeld et al. (2008a) and Stevens and Feingold (2009) for the in-vigoration of deep convective clouds by increased aerosol loading. These works are discussed in further detail be-low. Briefly however, via different reasoning, both works conclude that an increase in aerosol number concentration should act to increase surface precipitation. Rosenfeld et al. (2008a) suggest that a decrease in invigoration of deep con-vection may occur due to the direct effect of aerosols act-ing to limit the downward shortwave radiative flux at the surface, mitigating surface warming and leading to weaker convection. Although the ability for aerosol perturbations to invigorate deep convective clouds makes sense conceptu-ally, modeling studies are still not in agreement as to the sign of the effect on precipitation owing to increased pollutants. For example, Van den Heever et al. (2006) showed using a 3-D CRM with bulk microphysics that adding aerosol par-ticles in the form of CCN, giant CCN (GCCN), and/or IN causes a decrease in domain-average cumulative precipita-tion in reference to a clean environment observed during the Cirrus Regional Study of Tropical Anvils and Cirrus Layer-Florida Area Cirrus Experiment (CRYSTAL-FACE). On the other hand, Khain and Lynn (2009) demonstrated an increase in precipitation with an increase in CCN concentration using a spectral bin microphysics model but with low spatial res-olution and abbreviated simulation time. In the same study, a decrease in precipitation with an increase in CCN number concentration was shown using a simple two-moment bulk microphysics scheme simulated on the same dynamic frame-work.
One can imagine though that the effect of an increase in the ambient aerosol concentration on surface precipitation (as well as cloud radiative forcing) in deep convective clouds may not be monotonic and likely depends significantly on the environmental conditions (i.e., Rosenfeld et al., 2008a). Khain et al. (2008) attempted to classify the effects of in-creased aerosol concentrations on precipitation for a wide range of cloud types and locations showing that, for example, deep convective clouds in dry environments should exhibit a decrease in precipitation with an increase in the aerosol num-ber concentration. On the other hand, in moist environments, an increase in the aerosol loading was shown to increase pre-cipitation or provide a negligible change depending on the specific cloud type. Moreover, Fan et al. (2009) studied the importance of the magnitude of the vertical wind shear on the aerosol-induced changes in deep convective clouds. The study showed that in a relatively high shear environment, an increase in the CCN number concentration produced a de-crease in vertical velocity and cumulative precipitation.
Additional studies have looked at the potential implica-tions of aerosol perturbaimplica-tions on the anvil cloud develop-ment and microphysical characteristics. The cloud resolv-ing model (CRM) study of Van den Heever et al. (2006) showed that the anvil clouds atop the simulated deep convec-tive clouds cover less area but contain higher amounts of con-densed water when the aerosol number concentration is ele-vated. This results in more intense, localized precipitation. More recently, satellite data analysis has shown that regions with higher aerosol concentrations statistically correlate with areas of larger cloud extent, i.e., broader anvils (Koren et al., 2010). By broadening the anvil, the cloud becomes thinner and thus reduces the cloud albedo while the outgoing long-wave radiation is relatively unchanged since the cloud top temperature does not change much. In turn, this combina-tion results in an increase in the solar radiacombina-tion reaching the surface. Little observational evidence is available at this time (due to the inherent complexities in measuring small concen-trations of IN in regions of very high instability and remote locations) to determine clearly the overall effect of aerosol perturbations on anvil cloud development.
IN number concentration, as predicted by the empirical rela-tions, becomes erroneously large and will likely significantly impacts the model predictions.
Microphysical calculations of deep convective cloud (e.g., Khain et al., 2004, 2008; Teller and Levin, 2006; Khain and Lynn, 2009) and multi-cloud system (e.g., Lee and Feingold, 2010; Lee, 2011) invigoration in response to aerosol changes have been performed in recent years. Potential shortcom-ings exist in the method by which the CCN concentration is implemented and in the representation of the IN number concentration by the empirical Twomey (1959) relationship to predict the number of activated aerosol particles as a func-tion of supersaturafunc-tion. The empirical constants in this re-lation are specific to individual cloud types, i.e., the coeffi-cients that apply for the convective core may not be adequate for other regions of the deep convective cloud, e.g., detrained stratocumulus. Moreover, some of the previous studies have used two-dimensional models (e.g., Khain et al., 2004, 2008; Teller and Levin, 2006) and others that have simulated all three dimensions (e.g., Khain and Lynn, 2009) have been performed at rather low spatial resolution, i.e.,≥2 km in the horizontal. It is natural to ask if with limited computational resources, should one simulate deep convective clouds us-ing detailed bin microphysics or instead use a detailed two-moment bulk scheme at much higher spatial resolution? And, if one accounts for the activation of cloud droplets and nucle-ation of ice particles in a more physically coherent manner, what are the effects of aerosol particles on precipitation in deep convective clouds? These points are addressed in this study.
The remainder of this work is organized as follows: Sect. 2 presents hypotheses regarding aerosol effects on deep con-vective clouds. This is followed in Sect. 3 by a detailed de-scription of the bulk and bin microphysics models that are employed in this study. Section 4 provides information rel-evant to the chosen dynamical model as well as details on the model initialization and simulations. Sections 5.1 and 5.2 discuss our findings regarding the influence of CCN and IN on deep convective clouds, respectively, and include a de-tailed comparison of the simulations performed with both the bulk and bin microphysics schemes. Moreover, Sects. 5.3 and 5.4 review the effects of aerosol perturbations on cloud top height and rainfall intensity, respectively. Lastly, Sect. 6 concludes the work and serves to outline the most important findings of this study.
2 Theoretical basis and hypotheses
Here, we highlight and discuss recent work in the realm of aerosol invigoration of deep convective cloud. Our purpose here is to present the relevant hypotheses related to this work in a concise framework.
2.1 Rosenfeld et al. (2008a)
Rosenfeld et al. (2008a) argue that the effect of an increased concentration of sub-cloud aerosol, and hence cloud conden-sation nuclei (CCN), on convective clouds is to invigorate updrafts and produce an increase in precipitation as a re-sult of upward heat transport via phase change. The argu-ment is based on the results of a bulk thermodynamic parcel model, in which in the baseline simulation it is assumed that all water condenses and is immediately precipitated; hence, no energy is required to lift the hydrometeors (for the pur-pose of this study, hydrometeors are defined to be liquid cloud drops, pristine ice crystals, dendritic snow crystals, and rimed ice, or graupel). In other words, the work re-quired, here in the form of mechanical energy, to lift con-densed forms of water is zero. It is assumed, in addition, that the liquid water freezes at−4◦C such that when the
hy-drometeors freeze at and above the level where this temper-ature is attained, a release of latent heat occurs, providing positive buoyancy. Rosenfeld et al. (2008a) argue that an in-crease in aerosol number concentration will serve to delay the onset of the collision-coalescence process, and energy is required to lift the parcel containing liquid hydrometeors to lower temperatures. Further increases in the aerosol concen-tration require the parcel to be lifted to even higher levels be-fore collision-coalescence ensues. If collision-coalescence is delayed up to the freezing level, droplets are assumed to freeze, releasing latent heat, and then precipitating from the parcel, removing water mass and generating positive buoy-ancy. Hydrometeors are assumed to immediately freeze and precipitate if the parcel is lifted even farther. Rosenfeld et al. (2008a) argue that the addition of aerosol particles above that which would occur in a relatively clean environ-ment (i.e., increasing the aerosol number concentration from
≈100 cm−3to
≥1000 cm−3) can increase the released grav-itational energy, which is equivalent to changing the effec-tive conveceffec-tive available potential energy (CAPE) of the par-cel by>1000 J kg−1. The effect of the resultant increase in CAPE and mitigation of the collision-coalescence process is to delay the onset of precipitation, but increase the total pre-cipitation. Rosenfeld et al. (2008a) also discussed that the increase in evaporative cooling within the downdrafts near the surface provides additional additional upward heat trans-port leading to convective invigoration.
The concentration of CCN required to delay collision-coalescence until the parcel reaches the −4◦C isotherm is
which invigoration should reach a maximum is relevant for anthropogenically influenced locations. For concentrations of CCN above 1200 cm−3, collision-coalescence is delayed beyond the freezing level, more energy is required to lift the parcel, and the invigoration effect is mitigated. For higher CCN concentrations, less incoming solar radiation reaches the surface, reducing surface warming, which in turn, stabi-lizes the boundary layer, hence limiting convective develop-ment.
2.2 Stevens and Feingold (2009)
In addition to invigoration of updrafts within and below deep convective clouds, Stevens and Feingold (2009) proposed that an increase in CCN may act to increase cloud top height (i.e., cloud depth). The basis for this hypothesis is that an increase in CCN should act both to increase cloud droplet number concentration (Nc) and to reduce cloud droplet ef-fective radius (re) in warm clouds, hence delaying the onset of precipitation. This allows hydrometeors to be advected to higher levels, increasing the amount of condensed water within the cloud, in turn increasing evaporation at cloud top, hence cooling and destabilizing the cloud top region. Up-drafts near cloud top are invigorated, increasing cloud depth. Since deeper clouds are expected to have more liquid water, an increase in precipitation is expected. However, the micro-physical complexity of cold clouds (i.e., those containing ice in some form) adds another dimension, hence the effect of increased aerosols no longer follows such a straightforward pathway.
2.3 Khain et al. (2008)
Khain et al. (2008) attempt to classify the effect of aerosol levels on precipitation from clouds of all types. Using a 2-D CRM with spectral microphysics, Khain et al. (2008) show that deep clouds in both tropical and moist urban areas tend to display an increase in precipitation with increasing aerosol levels. The effect of increased aerosol levels on supercell storms is shown to either decrease or increase precipitation depending upon whether the environment is dry or moist, re-spectively.
3 Numerical simulation
We explore the effects of aerosol perturbations on deep con-vective clouds by using the Weather Research and Forecast-ing (WRF) model Version 3.1 (Skamarock et al., 2008) as a CRM. The dynamical core of the WRF model is augmented by a detailed mixed-phase bin microphysics scheme follow-ing Tzivion et al. (1987), Tzivion et al. (1989), Fefollow-ingold et al. (1988), Reisin et al. (1996), and Khain et al. (2004). In ad-dition, we provide comparisons between predictions of the detailed bin model and those of a modified two-moment five-class (i.e., cloud, rain, pristine ice, snow, and graupel) bulk
microphysics scheme (Morrison et al., 2005; Morrison and Pinto, 2005). The bin scheme and the modifications to the bulk scheme are described in detail below.
3.1 Bin microphysics scheme
The mixed-phase bin microphysics scheme divides each hy-drometeor spectrum into 36 bins (i.e.,xj1,xj2,...,xj36, where
j corresponds to the hydrometeor type: c, i, s, and g for liq-uid cloud droplets, pristine ice, snow, and graupel, respec-tively, andx is the mass) with mass doubling between bins such that
xk+1=2xk (1)
in whichk corresponds to the lower boundary of bin num-ber k. The mass of the smallest bin is defined to be 1.598×10⁻¹⁴kg (Reisin et al., 1996), which, for liquid droplets (with density ρl=1000 kg m−3) corresponds to a diameter of 3.125 µm. Additionally, we assume fixed bulk densities for the frozen species, i.e., ρi=900 kg m−3,ρs= 200 kg m−3, ρ
g=500 kg m−3. The choice of 36 bins al-lows hydrometeors to attain appreciable sizes for precipi-tation to occur while minimizing the risk of creating nu-merical instability due to very large particles falling through grid boxes within a single time step. With these assump-tions, the droplets, pristine ice, snow, and graupel can grow to 10.1 mm, 10.5 mm, 17.3 mm, and 12.8 mm, respectively. These sizes are adequate to accurately represent the tion of hail (i.e., large graupel) and the changes in hail forma-tion due to aerosol perturbaforma-tions that have been shown to be important in previous studies (e.g., Andrejczuk et al., 2004; Khain et al., 2011).
3.1.1 Collision-coalescence, accretion, riming, and aggregation
The collision-coalescence process is represented by the moment-conserving numerical solution to the stochastic col-lection equation of Tzivion et al. (1987) for the first two mo-ments of each distribution, namely the number concentration (Njk) and mass mixing ratio (Mjk). For collisions amongst
liquid droplets, we use the Long (1974) collection kernel. For ice-ice, ice-snow, ice-graupel, snow-graupel, snow-snow, liquid-ice, liquid-snow, liquid-graupel, graupel-graupel colli-sions we use the gravitational collection kernel.
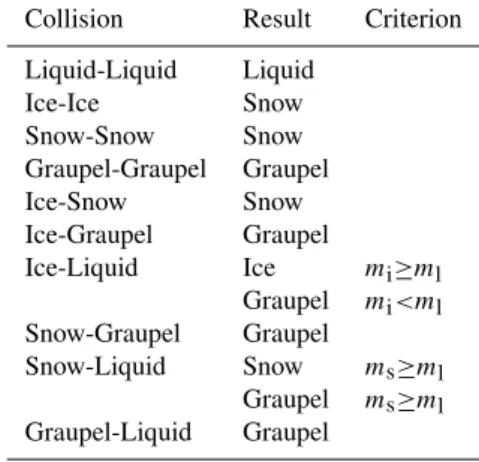
Table 1.Assumptions regarding hydrometeor collisions.
Collision Result Criterion Liquid-Liquid Liquid
Ice-Ice Snow Snow-Snow Snow Graupel-Graupel Graupel Ice-Snow Snow Ice-Graupel Graupel
Ice-Liquid Ice mi≥ml
Graupel mi<ml
Snow-Graupel Graupel
Snow-Liquid Snow ms≥ml
Graupel ms≥ml
Graupel-Liquid Graupel
et al., 1996; Khain et al., 2004). Note thatml,ms, andmi cor-respond to the masses of the liquid, snow, and ice particles involved in a collision.
3.1.2 Vapor condensation/deposition and
evaporation/sublimation
The simulation of condensation and evaporation of water to and from liquid drops, as well as deposition and sublima-tion, can depend strongly on the chosen time step and are highly sensitive to small fluctuations in the supersaturation (both with respect to liquid water as well as ice). Tzivion et al. (1989) formulated the condensational forcing (τ) due to a vapor surplus or deficit (1qv) as the integral of the sur-plus/deficit over a timestep (1t) as
τ=G(P ,T ) Z t+1t
t
1qvdt (2)
in whichG(P ,T )is a known function of pressure (P) and temperature (T) defined in Pruppacher and Klett (1997) and Seinfeld and Pandis (2006) and1qvis defined as
1qv=qv−qs (3)
where qs is the saturated water vapor mixing ratio. Due to condensation/evaporation and deposition/sublimation, and the resulting latent heating, within a timestep,1qvis not nec-essarily constant over the timestep. We use the method of Harrington et al. (2000) to predict the evolution ofqv, and consequently,1qv, over the course of each timestep. By uti-lizing Eq. (2) we can capture the changes in the vapor sur-plus within a timestep as a result of phase changes, i.e., con-densation/evaporation and deposition/sublimation. The full solution to the condensation equation as derived by Tzivion et al. (1989) for linearized distributions within bins is cum-bersome and computationally expensive. Therefore, we em-ploy the method of Stevens et al. (1996) in which the mass and number within a given bin are distributed following a top hat distribution. Moreover, we include gas kinetic effects on
the growth of the hydrometeors following Clark (1974) and Stevens et al. (1996) in which the mass growth equation can be expressed as
dm dt =
m2/3
m1/3+ℓG(P ,T )1qv (4)
in whichℓrepresents a length scale for vapor growth defined as
ℓ=ℓ◦
4 3πρw
1/3
(5) in whichℓ◦ is assumed to be 6.4 µm. There exists an an-alytic solution to Eq. (4), and this solution is used for the remapping of the bins due to condensation/evaporation and deposition/sublimation.
3.1.3 Cloud droplet activation and regeneration
The aerosol size distribution is assumed to follow a single-mode lognormal distribution (Seinfeld and Pandis, 2006),
nd Dp≡ dN dlnDp=
Na
√
2πlnσexp −
ln2DDp
g
2ln2σ
(6)
where,Na is the total aerosol number concentration,σ and Dgare the standard deviation and geometric mean diameter, respectively, and Dp is the particle diameter. For the pur-poses of this study, we letDg= 0.1 µm and σ=1.8. The aerosol distribution is discretized into 36 mass-doubling bins. The first bin corresponds to an aerosol particle in which Dp=1 nm. The total number concentration is set during the model initialization and the aerosol particles that remain after advection are advected throughout the domain. The number of activated aerosol particles (Nact) is computed during each time step by integrating the size distribution over particles with critical supersaturations that are less than the ambient supersaturation,
Nact= Z S
0
ns(s′)ds′ (7)
whereSis the ambient supersaturation andns(s′)is the
to the regeneration of aerosol particles. Xue et al. (2010) demonstrated the significance of aerosol regeneration on cloud microphysical properties. Without including the re-generation of aerosols, the number of cloud droplets acti-vated during a simulation can be erroneously underestimated thus increasing the mean size and ultimately leading to arti-ficially enhanced precipitation. The number of aerosols that are formed in one timestep is assumed to be equivalent to the number of cloud droplets that evaporate following Xue et al. (2010). For the purposes of this study, we assume that the ef-fect of collision-coalescence on the regenerated aerosol size distribution is negligible.
3.1.4 Freezing and melting
Supercooled cloud drops can freeze to form ice crystals via heterogenous (i.e., contact nucleation, immersion freezing, deposition freezing, etc.) and homogeneous freezing. We must turn to previous studies (Bigg, 1953; Fletcher, 1962; Vali, 1975; Cooper, 1986; Meyers et al., 1992) that have shown via various techniques that the ice nuclei (IN) number concentration (and inherently the number of frozen drops) can be diagnosed by empirically derived using the ambient environmental conditions. The expression derived by Bigg (1953) for the rate of change of frozen drops with time can be used to express the number of frozen drops in a bin dur-ing a time step (Nfk) due to both homogeneous freezing
of cloud droplets (forT <−37◦C) and immersion freezing
(−37◦C<T <−5◦C) as (Reisin et al., 1996),
Nfk=Nck(t )
1−exp
−mρck
l
A′exp B′(T◦−T )1t
(8) whereNck(t )is the number of cloud drops in bin k at the
start of the time step,mck is the average droplet mass in bin
k, andA′andB′are constants defined as 10−4cm−3s−1and 0.66 K−1, respectively, from Orville and Kopp (1977). The frozen mass in binkis simplyNfkmck. Here, we use Eq. (8)
only for homogeneous nucleation of ice crystals. The nucle-ation of ice crystals due to immersion freezing is caused by IN being immersed within a cloud droplet. These IN become active at various temperatures. Vali (1975) showed that the number of active immersion IN (Nim) can be expressed as a function of temperature in degrees Celsius (Tc) by
Nim=Nim◦(0.1Tc)γ (9)
in which it is assumed thatNim◦=107m−3 and γ=4.4 for convective clouds. Furthermore, for deposition and conden-sation freezing, we use the formula of Meyers et al. (1992) to relate the number of deposition and condensation IN (Nd) to that of the ambient supersaturation with respect to ice (Sice) as
Nd=Nd◦exp[−0.639+12.96Sice] (10) whereNd◦=10−3m−3. We distribute evenly the number of droplets that freeze due to deposition and contact freezing.
All frozen hydrometeors are assumed to melt over the course of a single timestep when the ambient temperature of the grid box containing such particles is greater than 0◦C.
Sensitivity simulations with more sophisticated, and hence more computationally expensive, melting routines that at-tempt to account for heat transfer within the frozen species demonstrated a qualitatively insignificant change in the re-sults presented here.
3.1.5 Sedimentation
All hydrometeors are assumed to sediment at their terminal fall speeds (vtj, j corresponding to the particle type). As
alluded to above, fall speeds for snow are computed from the mass-fall speed relationships determined by Locatelli and Hobbs (1974) for aggregates of unrimed side planes. For consistency, we use the same mass-fall speed relationships for graupel and hail as in the bulk microphysics scheme (Morrison et al., 2005; Morrison and Pinto, 2005). The mass-fall speed relationships for hail are used to predict sed-imentation of particles in the tail of the graupel distribution. The terminal fall speed of ice crystals is computed follow-ing Heymsfield and Kajikawa (1987). For the purpose of this study, it is assumed that particles in the ice category are pristine crystals in the shape of thin hexagonal plates (type P1a). Terminal velocities are computed by relating the crys-tal Davies or Best number (X) to the crystal Reynolds num-ber (NRe) by (Heymsfield and Kajikawa, 1987),
X=CdNRe2 = 2mDi2g
ρiν2A
(11) wheremis the crystal mass,Diis the crystal dimension, g is the acceleration due to gravity,νis the kinematic viscosity of air, andAis the crystal cross-sectional area normal to the direction of motion. Moreover, we can expressNReas NRe=
vtiDi
ν . (12)
Using theX−NRe parameterization of Heymsfield and Ka-jikawa (1987), i.e.,
NRe=αXβ (13)
and the definitions ofXandNRe, we can writevti in terms
of the crystal equivalent hexagonal diameter (Dieq) as
vti=
να Dieq
" 2mD2i
eqg
ρiν2A #β
(14) where, for a hexagonal plate,
A=3
√
3
2 D
2
ieq. (15)
Lastly, Heymsfield and Kajikawa (1987) define Dieq to be
3.2 Bulk microphysical scheme
For the two-moment bulk microphysics scheme, we use that of Morrison et al. (2005) and Morrison and Pinto (2005), in-cluded with the WRF model. The scheme has a fixed cloud drop number concentration (Nc), and the freezing process is parameterized following Cooper (1986). In order to more ac-curately represent the aerosol effect on cloud properties in the bulk model, we have modified the scheme to include explicit droplet activation as well as to include the freezing mecha-nisms included in the bin scheme described above. In other words, the aerosol population is initiated following a lognor-mal size distribution and binned into 36 mass doubling bins. The activated droplet size is computed as in the bin scheme and the total liquid water mixing ratio and number concentra-tion that activate are computed and added to the bulk quanti-ties. On the first timestep that aerosol particles are activated, the model fits a gamma distribution to the discretized droplet distribution. Computing the activation in this manner limits the differences between the bin and bulk schemes, especially pertaining to the link between CCN and cloud droplets (as well as IN and ice formation).
4 Experimental setup
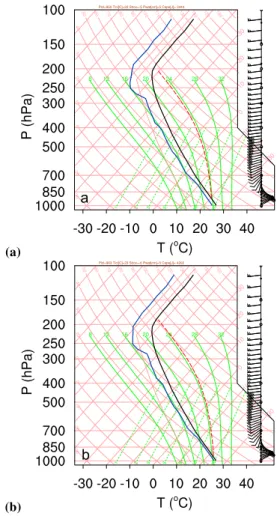
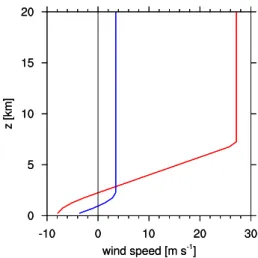
The WRF model, modified as described in Sect. 3, is ini-tialized with an idealized sounding typical for continental locales conducive to deep convective development (Figs. 1 and 2). Two soundings are used in order to analyze the ex-tent to which an aerosol-induced effect on deep convection is dependent upon the ambient moisture content, i.e., the water vapor mixing ratio (qv) or relative humidity (RH). The am-bient RH is permitted to change with height similar to that of Khain and Lynn (2009), except that in the present study, the RH at the surface is 95 % in the moist scenarios and the RH for the drier scenarios is simply 5 % less than that of the moist cases (hereinafter these scenarios are referred to as the highRH and lowRH simulations, respectively). There-fore, the RH at the surface is 90 % for the lowRH simula-tions. Recently, Fan et al. (2009) showed that aerosol effects act to reduce precipitation in deep convective clouds in high shear environments. However, the purpose of this study is not to analyze the dependence of aerosol-induced invigora-tion of deep convective clouds on wind shear. As a result, we limit the vertical wind shear by utilizing the standard quarter circle shear wind profile derived from Weisman and Klemp (1982) (Fig. 2) so as not to influence the results by anoma-lously large vertical wind shear. Convection is initiated in the domain with a perturbation (bubble) in the potential tem-perature field of 3◦C located in the center of the domain in
the north-south direction, and offset to the west in the east-west direction. The horizontal and vertical radii of the bub-ble are 10 km and 2 km, respectively. Khain and Lynn (2009) looked at the dependency of the aerosol induced effects on
(a)
a
(b)
b
Fig. 1. Skew T-Log-P diagrams of the initial temperature and moisture data for the(a)lowRH and(b)highRH simulations. The soundings are adopted from Khain and Lynn (2009) with modifica-tions.
deep convective clouds using surface relative humidities of 95 % and 85 % for the moist and dry cases, respectively. We have increased the surface relative humidity in the lowRH cases since the cumulative domain-averaged precipitation in our simulations was insufficient to draw any definitive, sta-tistically significant, conclusions at the lower RH.
Fig. 2. Quarter circle shear wind profile. The zonal wind (u) is in red and and the meridional wind (v) is in blue. The values are derived following Weisman and Klemp (1982) as modified for in-clusion in WRF.
ambient aerosol concentration (i.e., from 100 to 200 cm−3) can be qualitatively different when a fixed timestep is chosen over that where the timestep is allowed to evolve based upon the stability of the model itself. We find that it is necessary to used a fixed timestep to study the effect of aerosol pertur-bations on the stability of deep convective clouds because if the timestep is allowed to change with the model’s stability, and the cloud contained within the polluted environment is in fact more unstable than its clean counterpart, the timestep will besmallerfor the polluted simulation. Our sensitivity simulations show that the difference in the timestep can be as much as 2 s during the period of time in which convection is strongest. Since sedimentation is computed as simply the mass flux into and and out of a grid box multiplied by the timestep itself, the downward flux of condensed water inte-grated over a timestep is dependent upon the timestep. In other words, a longer timestep may allow more cloud wa-ter to fall out of a particular gridbox before other relevant microphysical processes can occur (i.e., collisions). Hence, the cumulative precipitation can be different between simula-tions with different aerosol number concentrasimula-tions due to the difference in the timestep chosen by the model. To remove this uncertainty, we have chosen to fix the timestep at 4 s for all cases.
Another potential shortcoming of previous works (e.g., Fan et al., 2009; Khain and Lynn, 2009) is the choice of boundary conditions. Periodic boundary conditions are of-ten used. However, CRM simulations of transient deep con-vective cells are not consistent with such boundary tions. In other words, by choosing periodic boundary condi-tions, the western boundary of the domain is forced by the eastern boundary, which is physically implausible. We em-ploy open boundaries, so that the advection of mass out of the eastern boundary does not affect the properties along the
western boundary and thus artificially modify the cloud and ultimately precipitation patterns.
Many previous studies that have attempted to analyze aerosol-induced effects on deep convective clouds or com-pare spectral microphysics to bulk microphysics utilized two-dimensional (2-D) models (e.g., Khain et al., 2004, 2008; Khain and Pokrovsky, 2004; Seifert et al., 2006; Phillips et al., 2007). We use a three-dimensional (3-D) domain. The horizontal domain length is 250 km in both thex- and y-direction while the vertical domain extends from the sur-face to 20 km. This vertical depth allows us to simulate into the lower stratosphere which is important for properly de-picting anvil formation near the tropopause. The horizontal grid spacing is set to 1000 m, and there are 60 stretched grid points in the vertical. The vertical grid spacing is less than 150 m at the surface and stretches to 400 m and 1500 m at 10 km above the surface and at the top of the model, respec-tively. A time step of 4 s is used to ensure numerical stability. The duration of the simulations is 6 h. The duration of the simulations are limited by the domain size. In order to limit the effect of reflection off of the boundaries and or advection along the boundaries, we must limit the simulations to 6 h. We understand that even at the resolution used in the current work, although higher than that of previous studies in which 3-D CRM simulations using bin microphysics was used, still higher resolution would be beneficial in order to fully cap-ture the three-dimensional dynamical feedbacks and energet-ics resulting from changes in the cloud microphysenerget-ics. How-ever, the hard disk space and computational time required to perform such simulations with the bin microphysics model are beyond the magnitude of our current resources.
To analyze the potential effects of CCN and IN on deep convective clouds we perform a set of three simulations with varying concentrations of CCN and IN. These simu-lations are defined as: (1) “Clean” –NCCN=100 cm−3, (2) “Semi-Polluted” – NCCN=200 cm−3, and (3) “Polluted” – NCCN=500 cm−3. The “Clean” scenario will be used as the base case. To analyze the potential impact of changes in the aerosol loading when the added particles act as good IN, we perform additional simulations in which we multiply the pre-dicted IN number concentrations for immersion, deposition, and condensation IN by a factor of 2. Regardless of the mi-crophysics scheme employed for the IN sensitivity tests, the CCN number concentration is doubled from the “Clean” case to 200 cm−3. Hereinafter, the cases with increased IN num-ber concentrations are referred to as “IN-Polluted”. The pur-pose of the “Semi-Polluted” and “IN-Polluted” cases is to show the effect of an increase in aerosol concentration when the particles act only as CCN and when they are CCN and IN, respectively.
increase the spatial resolution so as to capture the important dynamical feedbacks that may result from differential heat-ing caused by phase changes. Moreover, one likely under-estimates the maximum supersaturation within in a grid cell at coarse resolution. In order to predict the cloud drop num-ber concentration, an accurate depiction of the supersatura-tion is required. We have addressed this issue in the modified bulk scheme by using the explicit activation of a bin-resolved aerosol population. Sensitivity simulations (not shown) ex-hibit large discrepancies in the bulk cloud water variables, cumulative precipitation, and dynamical feedbacks (i.e., the track of the deep convective cloud) between simulations at low resolution (i.e.,1x=1y≥2000 m) and higher resolu-tions (i.e.,1x=1y<2000 m). Moreover, we have updated the bin microphysics model of Reisin et al. (1996) to include more accurate collection kernels and collection efficiencies for riming processes. It is important to note that a key dif-ference between in the bulk model employed in Khain and Lynn (2009) and the present study is that the prior used a fixed value forNc, while here we predictNc based on rele-vant physics, aerosol number concentration, and ambient en-vironmental conditions.
5 Results: CCN and IN effects on deep convective
clouds
We begin with a comparison between bin and bulk simula-tions of the potential impact on deep convective cloud devel-opment and precipitation as a result of increasing the CCN number concentration. It is important to keep in mind that the purpose of this study is not to predict with great pre-cision the amount of precipitation that may result from the given initial environmental conditions, but instead to numer-ically determine the extent to which the precipitation patterns and magnitude are altered in response to a modified aerosol loading. Unless stated otherwise, changes in the domain-averaged cumulative precipitation due to an increase in the CCN number concentration are statistically significant at the α=0.05 significance level (whereαdenotes the significance level).
5.1 CCN effects on precipitation and dynamical
feedbacks
5.1.1 High relative humidity
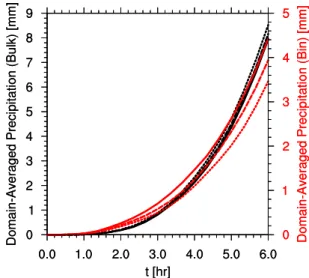
The overall effect of a perturbation in the CCN number con-centration is to modify the precipitation amounting from a deep convective storm cloud. We quantify the effect as the domain-average cumulative surface precipitation in Fig. 3 (highRH simulations only). First, one notices that there is a discrepancy between the total precipitation predicted by the bulk scheme and that of the bin model.
One of the main differences in the inherent assumptions of both microphysics schemes is that the bulk scheme
as-Fig. 3. Domain-averaged cumulative precipitation for the highRH simulations using the bulk (black) and bin (red) microphysics mod-els. CCN effects are shown for the “Clean” (solid), “Semi-Polluted” (dashed), and “Polluted” (dotted) scenarios.
sumes prevents the existence of supersaturation within a grid-box after the microphysical calculations are performed. In other words, the bulk model includes a saturation adjustment scheme that removes excess water vapor at the end of each time step to reduce the saturation ratio to 1. The bin model includes no such scheme. This difference in the underly-ing assumptions may force the bulk model to over-predictqc and thus the total condensed water mixing ratio (qt). The use of a saturation adjustment scheme in the bulk micro-physics scheme is useful for low resolution simulations in which the time step is rather large (i.e., larger than the con-densational growth timescale of the cloud particles). How-ever, in a detailed CRM, such as the one presented in the current study, the time step is likely shorter than the conden-sational timescale of the cloud droplets (Chuang et al., 1997), hence the gridbox will remain supersaturated at the end of the timestep. As a result, the results of the bin model ought to be more accurate given the lack of a saturation adjust-ment scheme within the scheme. Moreover, the difference in precipitation between the simulations performed with each model is acceptable since the overarching goal of this work is to understand how precipitation is affected by changes in the CCN number concentration and not necessarily to fully explain the differences between simulations performed with bin and bulk microphysics.
Table 2.Domain-averaged cumulative precipitation at the completion of the simulations performed,t=6 h.
Micro. RH Profile “Clean” Precip. “Semi-Polluted” Precip. 1Precip.a “Polluted” Precip. 1Precip.b Bin highRH 4.42 mm 3.94 mm −10.9 % 3.46 mm −21.7 % (−12.1 %) Bulk highRH 7.94 mm 8.16 mm 2.71 % 8.52 mm 7.27 % (4.45 %) Bin lowRH 2.39 mm 2.25 mm −5.74 % 2.03 mm −14.9 % (−9.74 %) Bulk lowRH 4.59 mm 4.69 mm 2.23 % 4.85 mm 5.79 % (3.49 %)
aThe relative change in the domain-averaged cumulative precipitation (1Precip.) is computed for the “Semi-Polluted” case compared with that of the “Clean” case. b1Precip. is computed for the “Polluted” case compared with that of the “Clean” case.1Precip. between the “Polluted” and “Semi-Polluted” cases is given in parentheses.
Bulk Bin
(a) (b)
(c) (d)
(e) (f)
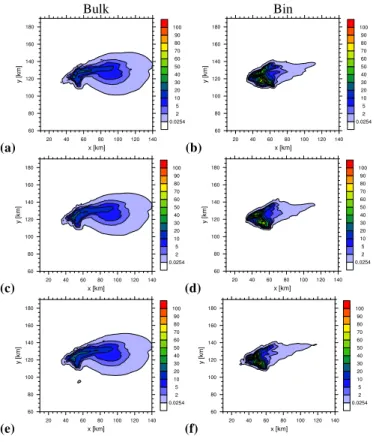
Fig. 4. Cumulative precipitation after 2 h of simulation time for the (aandb) “Clean”, (c andd) “Semi-Polluted”, and (e andf) “Polluted” scenarios for high RH. Simulations performed with bulk microphysics are shown in(a, c, and e)and those with bin micro-physics in(b, d, and f). Note that thex- andy-axes represent the grid location index and that the portrayed region is a subset of the entire domain, chosen to elicit the largest differences amongst the set of simulations performed. The first contour level is chosen to be 0.0254 mm, which corresponds to 0.01 in. Any rainfall below this amount is considered to be a trace amount. Consequently, areas shown in white represent regions in which a trace or less of precip-itation as fallen.
pattern also differs. The latter is seen by comparing, e.g., Fig. 5a (bulk) and b (bin) in which we find that the simula-tion run with bulk microphysics predicts a different trajectory for the northern branch of the system. As the cell splits, the
Bulk Bin
(a) (b)
(c) (d)
(e) (f)
Fig. 5.As in Fig. 4 except after 4 h of simulation time.
the total precipitation using a bulk microphysics model, sub-grid scale fluctuations should be considered using methods like that proposed by Morales and Nenes (2010) to calculate precisely sub-grid scale supersaturations.
Figure 3 shows the domain-averaged cumulative precipi-tation for the highRH simulations. With the discrepancy be-tween the total amount predicted by the bin model in com-parison to that of the bulk scheme aside, we focus on the effect of increased CCN number concentrations on precipi-tation in each model. The overall effect of a doubling of the CCN number concentration (i.e., from 100 to 200 cm−3), us-ing the bin microphysics scheme, is to decrease precipitation by 10.9 % (Table 2). We find that a further increase in CCN number concentration (i.e., from 200 to 500 cm−3) causes a further reduction in precipitation predicted using the bin microphysics model, contrary to that which is suggested by the theoretical arguments of Rosenfeld et al. (2008a). Here lies an additional discrepancy between the two microphysics schemes, since the effect of an increase in CCN acts to in-crease the precipitation predicted by the bulk model. This point will be discussed in more detail below.
In order to understand theoretically how an increase CCN number concentration acts to decrease precipitation from deep convection, we turn our attention to the dynamics of the cloud first to look at the possible invigoration or suppres-sion of convection. We can analyze the invigoration that may result from increased aerosol loading using the buoyancy (B) equation (Houze, 1993):
B=g T⋆
Ta − p⋆
p◦+0.61q ⋆ v−qt
(16) whereT⋆is the perturbed temperature from the ambient state (Ta),p⋆is the pressure perturbation from the base state (P◦), qv⋆ is the deviation in the ambient water vapor mixing ratio from the reference state, andqt is the total condensed wa-ter mass mixing ratio. From Eq. (16), we see that changes in aerosol concentration can be linked to changes in buoy-ancy, and consequently vertical velocity, since perturbing the CCN number concentration will lead to changes in qt and T⋆/Ta (through latent heating). However, the effects are counteractive, since an increase in CCN number concentra-tion will increase the number of particles that reach the freez-ing level, freeze, and grow via vapor deposition, thus increas-ing the latent heatincreas-ing aloft (i.e., increasincreas-ing buoyancy). But, the increased heating comes in part from an increase in vapor deposition and thus acts to also increase theqt (decreasing buoyancy). We see then that if the increase in latent heating outweighs the increase inqt the cloud will be invigorated. While, on the other hand, if vapor deposition is at least as large as the heating influence on the ambient air, the con-tributions to buoyancy can be offset and thus no invigoration (or potentially even a decrease in buoyancy) can theoretically occur.
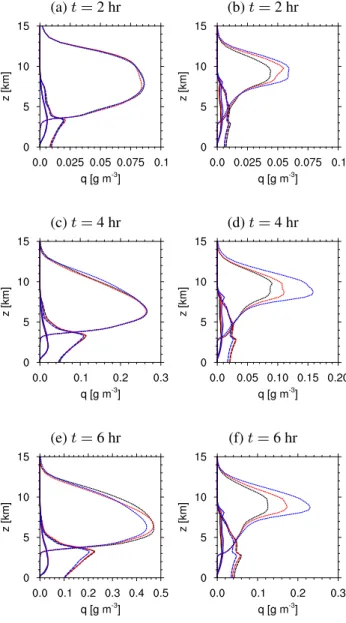
To understand how the performed simulations represent potential changes in buoyancy we showqt in Fig. 6,
sepa-(a)t=2 hr (b)t=2 hr
(c)t=4 hr (d)t=4 hr
(e)t=6 hr (f)t=6 hr
Fig. 6. Hourly domain-averaged cloud (solid), rain (dashed), and ice (dotted) water contents for the bulk (left) and bin (right) sim-ulations. The aerosol sensitivity is shown for the “Clean” (black), “Semi-Polluted” (red), and “Polluted” (blue) scenarios. Note that thex-axes are different in order to clearly demonstrate changes in the bulk cloud properties with time and increased aerosol loading. Simulation time is shown in the subcaptions.
suppressed initially while the cloud water content is slightly enhanced (Fig. 6b, d, and f). This is a direct result of the fact that smaller particles are less likely to collide, hence re-ducing the amount of cloud water converted to rain drops, and since the droplets are smaller, their terminal fall speeds are reduced and can be lofted higher in the atmosphere. On the contrary, the bulk model shows a small increase inqr be-low the melting level (Fig. 6a, c, and e) As time progresses, the peak in the vertical distribution of ice water shifts down-ward, hence increasing the amount of melt water below the freezing water, ultimately leading to an enhancement in the rain water content for an increase in the CCN number con-centration from the bulk model. However, even after 6 h, the bin model shows thatqris still suppressed in the cases with elevated CCN number concentrations in comparison to the “Clean” case. This prolonged suppression is discussed in de-tail below.
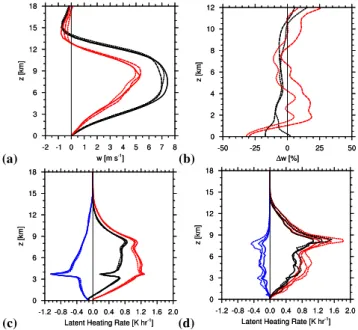
In order to describe how an increase in the CCN number concentration can alter the rain water content by a dynamical feedback, we turn to Fig. 7a and b, in which the mean verti-cal velocity (w) within the convective core after 2 h of sim-ulation time is shown for all highRH simsim-ulations. Here, we define the convective core to contain columns within which the mean vertical velocity between 3.3 km and 11 km is at least 1 m s−1. Any significant dynamical invigoration or sup-pression should appear from such an average. We see that an increase in the CCN number concentration produces a de-crease inw is more or less fixed for the simulations using the bulk microphysics scheme (Fig. 7a and b). However, the bin results show a slight enhancement inwon the order of 5 % to 15 % within the warm sector of the cloud (i.e., below about 4 km) due to increases in the CCN number concentra-tion. In conjunction with the fact that the cloud droplets are smaller, hence more likely to be lofted into the mixed-phase region of the cloud and freeze, thus increasing the rate of va-por deposition, this enhancement inwhelps increaseqi and consequently,qt(Fig. 6b, d, and f).
To confirm that additional vapor deposition is the root cause for the changes inB and hence,w, we show domain-averaged latent heating rates in Fig. 7c and d for the suite of simulations performed. The simulations performed with the bulk microphysics scheme (i.e., Fig. 7c) illustrate that the change in latent heating due to changes in CCN number concentration is quite small, regardless of the magnitude of the CCN perturbation nut negative. From Eq. (16) we would expect that such a small change would result in a small de-crease inwassuming thatqtwere fixed and ifqtwere to have increased, the possibility for a further decrease inw exists. Since, from Fig. 6, we see thatqtincreases when the CCN number concentration is elevated, the result is a decrease in w(Fig. 7a and b). In short, the bulk model suggests a limited convective suppression due to increases in CCN number con-centration, but does exhibit signs of enhanced precipitation at the surface due to increasing the condensed mass within the mixed-phase region of the cloud.
(a) (b)
(c) (d)
Fig. 7. (a)Average of the vertical velocity profile within the con-vective core and(b)the change in the mean vertical velocity due to changes in CCN number concentration. The convective core is defined to contain the columns in which the mean vertical ve-locity is more than 1 m s−1. Bulk (black) and bin (red) are
dis-played on the same graph. The differences are performed for the “Semi-Polluted” (dashed) and “Polluted” (dotted) cases relative to the “Clean” (solid) case.(c)and(d)show the latent heating rates for the bulk and bin model simulations, respectively. The net heating rate (black) is separated into warming (red) and cooling (blue). The vertical axes are different so as to highlight the differences within the cloud itself and because the relative differences at cloud top and above are much larger than those within the cloud. Simulation time is shown in the subcaptions.
The following question is then suggested: why does an increase in CCN number concentration elicit a different re-sponse in precipitation in the bin microphysics simulations? And, why is the change in precipitation of a different sign for the bulk and bin microphysics simulations? As noted above, the bulk simulations produce a small change in latent heat-ing rates (Fig. 7c) and consequently a slight decrease inw (Fig. 7b). Thus, dynamically, the cloud is not invigorated and the resulting increase in precipitation arises from simply a mass balance argument, i.e., what goes up must come down (assuming that the evaporation of cloud/rain water and sub-limation of ice/snow/graupel water is small). In other words, the cumulative precipitation increase results from simply adding more condensed water to the system aloft, that ulti-mately falls to the ground as precipitation. Conversely, we find that the bin model predicts changes to the dynamical na-ture (and microphysics, to be discussed below) of the convec-tive system that provide a different response to an increase in CCN number concentration.
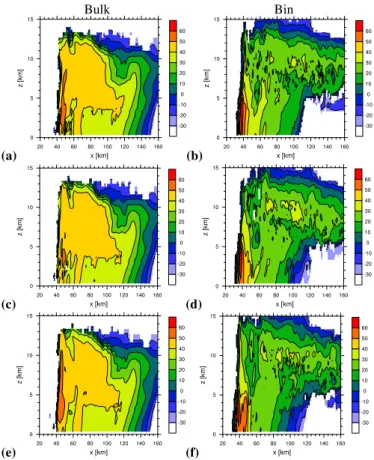
If we focus our attention on the bin microphysics simula-tions, Fig. 6 portrays an increase in qi, and consequently qt, for an increase in the CCN number concentration to 500 cm−3that is over and above that which we find for the increase in CCN to 200 cm−3. Since the cloud droplets are even smaller in the “Polluted” case, even more droplets reach the freezing level at which point they freeze and grow via vapor deposition. This leads to an increase in condensed mass due to an increase in deposition. Figure 7d shows that the latent heating is increased above 7 km for the “Pol-luted” case in comparison with both the “Clean” and “Semi-Polluted” cases. If all else were equal between the “Pol-luted” and “Semi-Pol“Pol-luted” cases, we would expect to find an increase in w and thus invigoration. However, Fig. 7d demonstrates that the increase in warming is offset by a sub-stantial increase in cooling above 7 km. Since the particles are smaller (the increase in number and mass is not linear), they are more readily evaporated/sublimated. Therefore, the ice particles are lofted high into the cloud, at which point they can be advected away from the core (smaller particles have a smaller terminal fall speed and thus can remain aloft for more time) and sublimate as they are detrained from the cloud top/anvil region. As a result, the increase in qt for the increase in CCN number concentration moistens the mid- to upper-troposphere rather than increasing precipita-tion. In other words, as one moves towards a “Polluted” envi-ronment, the aerosol-induced effect on deep convection lies in the subtle competition between sedimentation and evap-oration/sublimation timescales. Here, the latter is decreased whilst the former is increased, thus providing even more time for particles to evaporate on their way to the surface, result-ing in what appears to be a positive feedback loop accordresult-ing to the bin simulations. In order to demonstrate the effect of reduced particles sizes on sedimentation, we use the radar re-flectivity factor (Z) in dBZ as shown in Fig. 8 at 2 h into the simulations. Here,Zis defined as
Bulk Bin
(a) (b)
(c) (d)
(e) (f)
Fig. 8. Zonal vertical transects of the radar reflectivity factor (Z) in dBZ. The transects are taken after 2 hours of simulation for
y= 125 km. (a,c, ande) are for the simulations with bulk mi-crophysics and (b,d, andf) are for the simulations with bin mi-crophysics. The “Clean” (aandb), “Semi-Polluted” (candd), and “Polluted” (eandf) cases are shown.
Z=10log "
X j
Z ∞
0
NjDj6dDj #
(17)
wherej denotes the different hydrometeor types. After a little algebra, we can write Eq. (17) as
Z=10log "
X j
6 π
Z ∞ 0
ρj ρa
qjDj3dDj #
(18)
Fig. 9.Same as in Fig. 3 except for the lowRH simulations.
Figure 8 also sheds more light on the differences between the simulated bin and bulk model results. In general the max-imumZin each simulation is nearly the same. However, the region of high reflectivity in the bulk results, i.e.,Z>30 dBZ, is much wider (by a fact or 2 to 3). This results from precip-itation from the anvil region of the storm and is likely due to the saturation adjustment assumption mentioned above. From Fig. 8 it also becomes clear that the swath of heav-ier precipitation predicted by the bulk model is relatively unchanged due to increased aerosol loading (i.e., the width of the region in whichZ>30 dBZ is nearly fixed) while the bin simulations suggest otherwise. The influence of aerosol loading on rainfall intensity will be discussed in more detail below.
5.1.2 Low relative humidity
It has been suggested that various environmental parameters, e.g., vertical wind shear (Fan et al., 2009), ambient rela-tive humidity (Khain et al., 2008; Khain and Lynn, 2009), etc., may influence the aerosol-induced effect on deep con-vection. Here we extend the work of Khain et al. (2008) and Khain and Lynn (2009) by analyzing the effect on the aerosol-induced invigoration discussed above due to a small change in ambient relative humidity. It was shown previously that a reduction in the RH by 10 % throughout the sounding may act to limit any invigoration, or in fact weaken the con-vective cloud when aerosols are added to the system. Here, we have reduced the RH by just 5 % (Fig. 1b) to ensure that deep convection forms in all cases, and we permit the simu-lations to run for 12 h, in order to encapsulate the period of time in which the rain rate attains a maximum.
From Fig. 9, we see that like in the highRH cases, pre-cipitation is suppressed in the bin simulations and enhanced
Bulk Bin
(a) (b)
(c) (d)
(e) (f)
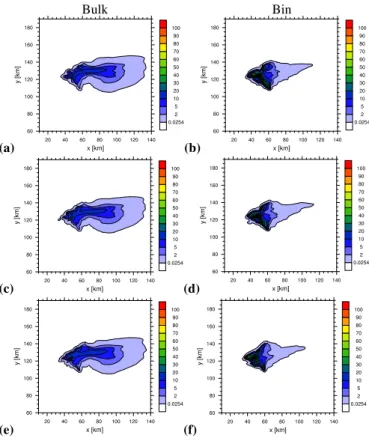
Fig. 10.As in Fig. 4 except for the low relative humidity scenario.
in the bulk lowRH simulations for all aerosol perturbations. In other words, the models still disagree on the sign of the aerosol-induced effect on precipitation from deep convective clouds. It should be noted that the change in precipitation from the “Clean” to “Semi-Polluted” case is not statistically significant forα=0.01. Table 2 shows the domain-averaged cumulative precipitation at the end of the simulations and the relative changes due to increased aerosol loading. Moreover, Figs. 10 and 11 show the cumulative precipitation at 2 and 4 h into the simulations, respectively. Comparing with Figs. 4 and 5, we see that the main result of decreasing the RH is to reduce the precipitation in the regions of intense rainfall (i.e., Figs. 10 and 11 show smaller areas in with the precipitation is greater than 70 mm for the bin model and greater than 40 for the bulk model, compared with Figs. 4 and 5).
Bulk Bin
(a) (b)
(c) (d)
(e) (f)
Fig. 11.As in Fig. 10 except after 4 h of simulation time.
Following the same line of logic as for the highRH cases, to analyze the dynamical feedback that occurs when the CCN number concentration is perturbed, we show the mean ver-tical velocity for each polluted scenario and the changes therein due to such perturbations in Fig. 13. Here it is shown thatwtends to decrease as the CCN number concentration increases for simulations performed with both the bin and bulk microphysics schemes under relatively low RH condi-tions, unlike that for the highRH cases. In fact, the bulk simulations show a decrease inwof 5 to 20 % while the bin simulations suggest a decrease up to 15 % within the cloudy part of the convective core (Fig. 13b). This elicits the ques-tion: Why is convection suppressed for all aerosol perturba-tion simulaperturba-tions while the precipitaperturba-tion response differs be-tween the bin and bulk simulations?
The key to answering this question is to note first that the mean profile of w is for that of the convective core itself. Hence, details of the changes in evaporation, sedimentation, etc., as a result of increasing the CCN number concentration may not be included in such a figure. Therefore, we show in Fig. 13c and d the domain-averaged latent heating pro-files for the lowRH simulations. For the bulk simulations under low RH conditions, there is no significant change in latent heating due to increases in CCN number concentra-tion. However, there is a slight increase inqt, thus resulting in a decrease inB and consequently, w, as well. Similar
(a)t=2 hr (b)t=2 hr
(c)t=4 hr (d)t=4 hr
(e)t=6 hr (f)t=6 hr
Fig. 12.Same as Fig. 6 except for the lowRH simulations. Simula-tion time is shown in the subcapSimula-tions.
(a) (b)
(c) (d)
Fig. 13.As in Fig. 7 except for the lowRH simulations.
evaporation/sublimation aloft (Fig. 13) that ultimately leads to a reduction in the domain averaged precipitation (Fig. 9) for the lowRH cases using bin microphysics. As mentioned above for bin simulations for the highRH scenario, there ex-ists a competition between evaporation and sedimentation that ultimately controls the sign of the aerosol-induced ef-fect on the precipitation resulting from deep convection. By reducingqvin the lowRH scenario, we essentially reduce the total condensed water mass in the cloud itself. Hence, all else being equal, particles in the “Clean” case will be smaller un-der the relatively low RH conditions in comparison to that of higher RH. The same goes for the “Semi-Polluted” and “Pol-luted” cases. As a result, the sedimentation timescale of the particles aloft is increased while the evaporation timescale is reduced for a decrease in RH. As a result, for even the smallest increase in the CCN number concentration shown (i.e., doubling from 100 to 200 cm−3), the evaporative effect outweighs the sedimentation rate and so consequently, less condensed water is converted to rain water and thus less pre-cipitation is observed at the surface. In fact, the increase in evaporation actually further decreases the sedimentation rate of cloud particles.
The fact that the overall effect of an increase in the CCN number concentration on the cumulative precipitation is in-herently tied to the intricate balance between sedimentation and evaporation/sublimation time scales is further corrobo-rated (as was the case for the highRH simulations) by look-ing at the radar reflectivity factor (Z, Fig. 14). As described above in Eq. (18), an increase inqtleads to an increase inZ if and only if the particles remain the same size (i.e., more numerous particles of the same size). On the other hand,
Bulk Bin
(a) (b)
(c) (d)
(e) (f)
Fig. 14.As in Fig. 8 except for the lowRH scenario
as mentioned above, an increase inqtwith no increase inZ signifies that the particles must be smaller, and thus sedimen-tation is reduced. This is precisely what the bin model sim-ulations suggest (Fig. 14b, d, and f). Clearly there is no sig-nificant change inZ due to increased aerosol loading while Figs. 6b, d, and f suggest thatqtis increased. The changes in particle size are harder to determine for the bulk simulations, especially between the “Clean” and “Semi-Polluted” cases. This should be expected given the smaller relative change in precipitation for increased CCN number concentration com-pared with the bin model (Table 2).
5.2 IN effects on deep convective clouds
Table 3.Domain-averaged cumulative precipitation at the completion of the simulations performed including potential IN effects,t=6 h.
Micro. RH Profile “Clean” Precip. “Semi-Polluted” Precip. “IN-Polluted” Precip. 1Precip.∗
Bin highRH 4.42 mm 3.94 mm 3.83 mm −2.82 % (−13.4 %) Bulk highRH 7.94 mm 8.16 mm 8.13 mm −0.44 % (2.38 %) Bin lowRH 2.39 mm 2.25 mm 2.17 mm −3.67 % (−9.2 %) Bulk lowRH 4.59 mm 4.69 mm 4.77 mm 1.65 % (3.91 %)
∗1Precip. is computed for the “IN-Polluted” case compared with that of the “Semi-Polluted” case, demonstrating the impact of changes in the IN number concentration.1Precip. between the “IN-Polluted” and “Clean” cases is given in parentheses.
Fig. 15.Domain-averaged cumulative precipitation for the highRH simulations using(a)bulk and(b)bin microphysics. CCN/IN ef-fects are shown for the “Clean” (solid), “Semi-Polluted” (dashed), and “IN-Polluted” (dotted) scenarios. Note the difference in they -axis scale between(a)and(b). The bulk and bin results have been separated here for clarity.
warmer temperatures, thus depleting the ambient vapor sur-plus and limiting the number of droplets that freeze via ho-mogeneous freezing at much colder temperatures.
Figure 15 illustrates the effect of an increase in the IN number concentration for both microphysics models in con-junction with an increase in the CCN number concentration for the highRH scenario (the results for a reduction in RH are qualitatively consistent with that of the highRH scenario and are thus not shown). Note that they-axes are logarithmi-cally spaced to accentuate the small differences in precipita-tion due to perturbing the IN number concentraprecipita-tion. The sign of the resulting influence on the domain-averaged cumulative precipitation from an increase in IN number concentration agrees for the two microphysics models, i.e., the both models suggest that the precipitation will decrease further when the IN number concentration is increased. Table 3 shows the rel-ative change in precipitation as a result of the aforementioned changes in the IN number concentration. We should note that the change in the domain-averaged cumulative precipitation from the “Semi-Polluted” to the “IN-Polluted” case is not
(a)
(b)
Fig. 16.Domain-averaged cloud (solid), rain (dashed), and ice (dot-ted) water contents for the bulk (left) and bin (right) simulations af-ter 2 h of simulation time. The aerosol sensitivity is shown for the “Clean” (black), “Semi-Polluted” (red), and “IN-Polluted” (green) scenarios.
statistically significant, even if we increase the significance level such thatα=0.10.
(a)
(b)
Fig. 17. (a)Average of the vertical velocity profile within the con-vective core and(b)the change in the mean vertical velocity due to changes in CCN number concentration. The convective core is de-fined to contain the columns in which the mean vertical velocity is more than 1 m s−1. Bulk (black) and bin (red) are displayed on the
same graph. The differences are performed for the “Semi-Polluted” (dashed) and “IN-Polluted” (dashed, green and blue for bin and bulk simulations, respectively) cases relative to the “Clean” (solid) case. The vertical axis is different so as to highlight the differences within the cloud itself and because the relative differences at cloud top and above are much larger than those within the cloud. Simulation time is shown in the subcaptions.
the ambient IN number concentration. However, by increas-ing the IN number concentration, we also increaseNi such that the sizes of the ice particles are now smaller on aver-age and consequently, the particles tend to fall more slowly. The result is a slight decrease in the domain-averaged cu-mulative precipitation. We see that the precipitation cannot increase beyond that of the “Semi-Polluted” case because the rain water content is always at most about equal between the two cases (Fig. 16).
Dynamically, the response to an increase in the IN num-ber concentration is shown to be quite small in comparison to the changes that arise due to increasing the CCN number concentration alone (Fig. 17).
(a)
(b)
Fig. 18. The change in mean cloud top height is depicted for the “Semi-Polluted” (dashed) and “Polluted” (dotted) scenarios relative to the “Clean” case using both the bulk (black) and bin (red) micro-physics schemes for the(a)highRH and(b)lowRH scenarios.
Fig. 19. Variance in the normalized cumulative precipitation for all simulations shown as a function ofNCCN. Both bin (red) and
5.3 Cloud top height effects
To shed light on the potential impact of cloud top height in controlling the amount of precipitation that results for a per-turbed deep convective cloud (Stevens and Feingold, 2009), we show the change in cloud top height in Fig. 18 for the “Semi-Polluted” and “Polluted” cases relative to that of the “Clean” case for both microphysical schemes. There is a rather consistent increase in cloud top height for the simula-tions performed using the bin microphysics scheme whereas the bulk scheme shows a change in cloud top height of less than 0.5 %, up or down, for most of the simulations, regard-less of the chose RH scenario. This slight increase in the cloud top height from the bin model is due to the fact that the smaller particles in the polluted cases are more likely to stay lofted and be lofted higher without a change inw. How-ever, the reason for a modest change in the cloud top height, as suggested might occur by Stevens and Feingold (2009), is because the clouds in question in this study are very deep, extending from the lifted condensation level (LCL) to the tropopause. Without a significant increase in vertical velocity near the equilibrium level, i.e., just below the tropopause, al-lowing moisture to punch higher into the lower stratosphere, it is very difficult to increase the height of such a cloud and hence increase the amount of condensed water mass due solely to adiabatic lifting of moist parcels.
5.4 Precipitation intensity
Although it was shown above that the overall result of an increase in the CCN number concentration is to reduce the domain-averaged cumulative precipitation based on bin mi-crophysics (while the bulk model suggest otherwise), this does not mean that the intensity of the rainfall also decreases. To determine the effect of increased aerosol loading on rain-fall intensity, we look at the variance of the normalized cu-mulative precipitation. In other words, the domain-average of the cumulative precipitation is normalized and the vari-ance of the resulting nondimensional precipitation values is computed and shown in Fig. 19 for all simulations. The dashed lines are shown to demonstrate any potential ten-dency. A larger normalized variance corresponds to more intense rainfall. Since these are domain-averages, there is a slight increase from the highRH to lowRH scenario as a re-sult of a larger area in which there is no precipitation in the drier case. However, comparing the suite of simulations per-formed for the highRH scenario, Fig. 19 suggests that there is little change in the intensity of the rainfall using the bulk scheme, while on the other hand, the bin results suggest an increase in intensity with increasing CCN number concen-tration. This result is corroborated in Fig. 8b, d, and f we see that the area of highestZ(Z>60 dBZ) tends to increase with increased aerosol loading, while the region of moderate Z(40 dBZ<Z<60 dBZ) tends to decrease. Moreover, Fig. 8 a, c, and e shows that there is essentially no change in the
size of the area of higherZ (i.e.,Z>30) and consequently, the trendline in Fig. 19 has a slope of nearly 0.
When the RH is reduced, Fig. 19 suggests no change in the rainfall intensity using the bulk microphysics scheme and the change in intensity using bin microphysics appears to not be monotonic. This change is also reflected in the radar reflectivity contour plots for lowRH (Fig. 14). Figure 14a, c, and e shows that there is little change (as was the case for highRH) in the width of the swath of heavier precipita-tion (or higher reflectivity,Z>30 dBZ). On the other hand, for the bin microphysics simulations, Fig. 14b, d show lit-tle change in the extent of the region of higher reflectivity for an increase inNCCNfrom 100 to 200 cm−3while a fur-ther increase in the CCN number concentration reduces the size of the area of higher reflectivity (especially near the sur-face) but a small are ofZ>60 dBZ appears, giving evidence of more intense rainfall. One possible explanation for this non-monotonic effect under low RH conditions could be that a slight increase in the CCN number concentration reduces the size of the cloud particles and thus decreases the evap-oration/sublimation time scale, prohibiting enhanced rainfall near the core. However, a further increase in the CCN num-ber concentration, although also decreasing the size of the cloud particles, may also act to enhance riming due to the in-crease in the number of cloud particles. The enhanced riming near the core could then lead to larger particles with higher reflectivity and ultimately more intense rainfall near the cen-ter.
6 Conclusions
We have presented a high-resolution detailed CRM study (via the WRF model) of the potential effect(s) of aerosol pertur-bations on the development of deep convective clouds. The study incorporates two different microphysics schemes:
1. Bin Microphysics – a mixed-phase bin microphysics scheme (see Sect. 3.1), based on Tzivion et al. (1987, 1989), Stevens et al. (1996), and Reisin et al. (1996), coupled to WRF for very detailed microphysics calcu-lations.
2. Modified Bulk Microphysics – the two-moment six-class bulk microphysics scheme of Morrison et al. (2005) and Morrison and Pinto (2005), modified to include a physically-based activation scheme based upon the explicit calculation of the activation of a bin-resolved aerosol population.