www.hydrol-earth-syst-sci.net/10/519/2006/ © Author(s) 2006. This work is licensed under a Creative Commons License.
Earth System
Sciences
A daily salt balance model for stream salinity generation processes
following partial clearing from forest to pasture
M. A. Bari1,2and K. R. J. Smettem3,4
1Department of Environment, 3 Plain Street, East Perth, W.A. 6004, Australia
2School of Earth and Geophysical Sciences, Hydroscience Discipline Group, The University of Western Australia, 35 Stirling Highway, Crawley, W.A. 6009, Australia
3School of Environmental Systems Engineering, The University of Western Australia, 35 Stirling Highway, Crawley, W.A. 6009, Australia
4Cooperative Research Centre for Plant-Based Management of Dryland Salinity, The University of Western Australia, 35 Stirling Highway, Crawley, W.A. 6009, Australia
Received: 13 June 2005 – Published in Hydrol. Earth Syst. Sci. Discuss.: 22 July 2005 Revised: 23 February 2006 – Accepted: 29 March 2006 – Published: 11 July 2006
Abstract. We developed a coupled salt and water balance model to represent the stream salinity generation process fol-lowing land use changes. The conceptual model consists of three main components with five stores: (i) Dry, Wet and Subsurface Stores, (ii) a saturated Groundwater Store and (iii) a transient Stream zone Store. The Dry and Wet Stores represent the salt and water movement in the unsaturated zone and also the near-stream dynamic saturated areas, re-sponsible for the generation of salt flux associated with sur-face runoff and interflow. The unsaturated Subsursur-face Store represents the salt bulge and the salt fluxes. The Ground-water Store comes into play when the groundGround-water level is at or above the stream invert and quantifies the salt fluxes to the Stream zone Store. In the stream zone module, we consider a “free mixing” between the salt brought about by surface runoff, interflow and groundwater flow. Salt accu-mulation on the surface due to evaporation and its flushing by initial winter flow is also incorporated in the Stream zone Store. The salt balance model was calibrated sequentially following successful application of the water balance model. Initial salt stores were estimated from measured salt pro-file data. We incorporated two lumped parameters to repre-sent the complex chemical processes like diffusion-dilution-dispersion and salt fluxes due to preferential flow. The model has performed very well in simulating stream salinity gener-ation processes observed at Ernies and Lemon experimental catchments in south west of Western Australia. The sim-ulated and observed stream salinity and salt loads compare
Correspondence to:M. A. Bari
very well throughout the study period with NSE of 0.7 and 0.4 for Ernies and Lemon catchment respectively. The model slightly over predicted annual stream salt load by 6.2% and 6.8%.
1 Introduction
Stream and land salinisation is a major environmental prob-lem occurring in many parts of the world (Abrol et al., 1988; Ghassemi et al., 1995). Stream salinity particularly affects parts of Asia, North America and Australia (Mckell et al., 1986). The salinity problem is reasonably well documented in Australia compared to other parts of the world (Hatton et al., 2002, 2003; Peck and Hatton, 2003; Halse et al., 2003). In Western Australia most of the salinity problem is associ-ated with dry land, rain fed agriculture (known as dryland salinity) rather than irrigated agriculture.
is reached (Ferdowsian et al., 1996; State Salinity Council, 2000).
Stream and land salinity in Western Australia has devel-oped following the clearing of deep rooted, native vege-tation and its replacement by shallow-rooted, annual agri-cultural crops and pastures (Schofield and Ruprecht, 1989; Ruprecht and Schofield, 1991). This land use change has led to an increase in groundwater recharge and rising water tables. This process has mobilised the salt stored in the un-saturated zone of the soil profile and eventually discharged to streams (Wood, 1924). The magnitude of stream salinity increase is dependent on annual rainfall and the extent and location of clearing (Schofield and Ruprecht, 1989; Mayer et al., 2004). The factors causing the land and stream salin-ity in Western Australia are different from other parts of the world. For example, in Queensland (Australia) salinity is caused by summer dominant rainfall, local aquifer system recharge and discharge areas are separated in space (Thorn-burn, 1991). Thornburn (1991) found similarity between the causes of salinity in Queensland and the Great Plains of northern United States of America (Miller et al., 1981). Stolte et al. (1997) noted that the factors affecting salinity in Western Australia were “very different” from those in the prairies of North America.
In the 1970s, a series of experimental catchments were es-tablished in the south-west of Western Australia to further understand the stream and land salinisation process follow-ing land use changes (Peck and Williamson, 1987). Catch-ment models were also developed to represent the hydrologi-cal processes and were successfully applied from experimen-tal to large water resources scale. The Darling Range Catch-ment Model (DRCM) and the Large Scale CatchCatch-ment Model (LASCAM) are the two recent examples (Mauger, 1986; Sivapalan et al., 1996; Viney et al., 2000; Viney and Siva-palan, 2001). An integrated modelling framework for the as-sessment of salt and water balance of a large dryland salinity affected catchment in the south-eastern part of Australia has been reported (Tuteja et al., 2003). Application of these mod-els show that there are scope for improvement in the mathe-matical representation of the physical processes, particularly for the dynamic variations of the stream zone saturated ar-eas and the mixing and distribution of salts brought about by rising groundwater to the stream zone. The limitations of the previous models were also highlighted by recent applica-tion of a fully distributed catchment model, WEC-C (Water and Environmental Consultants – Catchment) at experimen-tal catchments. Observations show that stream salt load from these catchments has increased more than 100 times follow-ing clearfollow-ing of native forest (Bari and Croton, 2000, 2002; Croton and Bari, 2001).
We developed a catchment water balance model following the “downward approach” originally suggested by Klemes (1983). The water balance model was successfully applied and tested in two experimental catchments in Western Aus-tralia (Bari and Smettem, 2006). The principal objective of
this paper is coupling and testing a salinity component with the water balance model. The coupled salt and water bal-ance model would require minimal calibration and will be used as an elementary unit in developing a regional-scale (>1000 km2)catchment model.
2 The study catchments
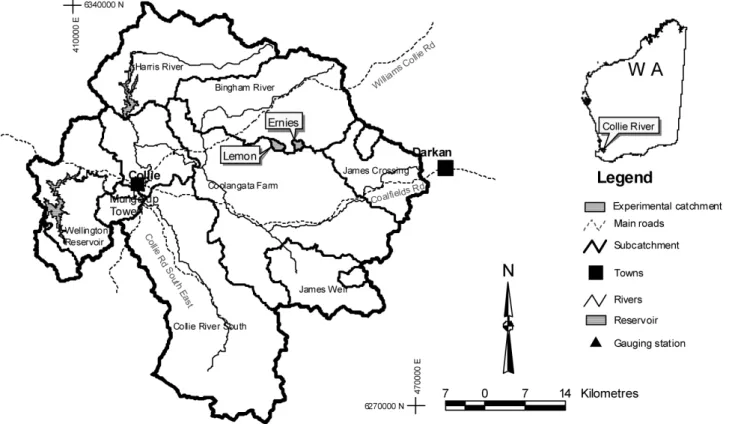
The paired catchments, Ernies and Lemon, are located in the south west of Western Australia, some 250 km south of Perth (Fig. 1). The areas of Lemon and Ernies catchments are 344 ha and 270 ha, respectively. The catchments have Mediterranean climate, with cool, wet winters and warm to hot, dry, summers. Ernies catchment was established as forested control. The annual pan evaporation and annual rainfall for both the catchments are approximately 650 mm and 1600 mm respectively. Typically more than 80% of aver-age annual rainfall falls in the six months from May to Octo-ber. Rainfall generally exceeds pan evaporation for only four months of the year (June to September). The native forest was dominated by jarrah (Eucalyptus marginata). Approx-imately 53% of the native vegetation of the Lemon catch-ment was cleared in 1977 to develop a comprehensive un-derstanding of the streamflow and salinity generation pro-cesses following land use change (Fig. 3). The cleared area of Lemon catchment was used for sheep grazing. The Lemon and Ernies catchments have broad and flat valley, with typ-ical surface slope of about 12% and 5%, respectively. Both catchments are characterised by the presence of duricrust or sandy and gravelly superficial deposits on the surface over-lying kaolinite-rich weathered material. The lateritic profile consists of two hydrologically distinct layers, the surface soil layer is typically 50–650 cm thick of high hydraulic conduc-tivity, overlying a deep kaolinitic sandy clay 10–30 m sub-soil of much lower hydraulic conductivity. The permanent groundwater system lies about 20 m below the soil surface in the forested areas.
Fig. 1.Location of the experimental catchments (after Bari and Smettem, 2006).
measure hydraulic conductivity of the pallid zone (Peck and Williamson, 1987).
3 Salinity generation process
3.1 Salt fall and distribution
Salt fall on Ernies and Lemon catchments was measured at 7.8 mg L−1 TDS. The salinity recorded in a fully exposed gauge was generally lower than that of an under canopy gauge (Williamson et al., 1987). The principal source of salt in the soil profile is the atmospheric input originating from the ocean (Hingston and Gailitis, 1976) and increases with distance from the coast due to less flushing with lower rainfall (Stokes et al., 1980). Soil salt profile data was lim-ited to five locations for both catchments. The salt content of the shallow highly conductive top soil is significantly less than that of the less conductive, very deep unsaturated pro-file, which extends to the groundwater system. Salt content of the groundwater system is generally less than that of the unsaturated zone. The soil salt storage also varies both spa-tially and vertically within both of the catchments. Johnston et al. (1987) classified the vertical soil salt distribution into two forms: (i) bulge profile and (ii) monotonically increas-ing profile. Groundwater salinity samples were collected on
a monthly interval during 1974–1980 then occasionally for the rest of the monitoring period.
3.2 Recharge and salt mobilisation
Groundwater level data from the Ernies control catchment show little variation between years and lies approximately 20 m below the stream bed. There was a systematic increase in groundwater level observed at Lemon catchment due to clearing and increase in net recharge (Bari and Smettem, 2004). The vertical recharge component mobilises salt stored in the unsaturated zone and the rising groundwater dissolves it. Therefore, the groundwater salinity increases (Croton and Bari, 2001). The rate of groundwater salinity increase de-pends on recharge rate and salt stored in the soil profile. 3.3 Stream salinity generation
Fig. 2.Detail set up of Ernies and Lemon catchments (after Bari and Smettem, 2006).
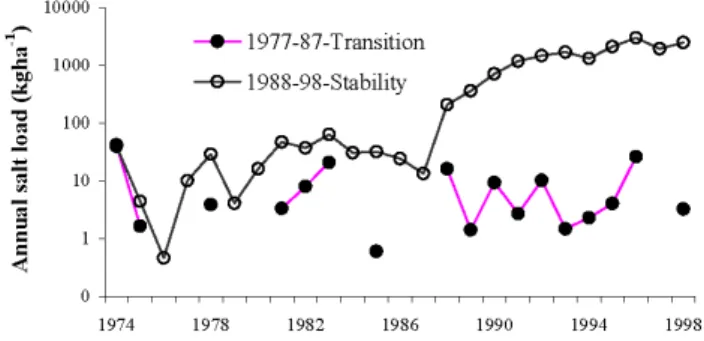
Fig. 3.Comparison of annual salt load between Ernies and Lemon catchments.
from Lemon catchment until 1987, when the groundwater system had risen to reach the stream invert. There was sig-nificant reduction in the interception and transpiration
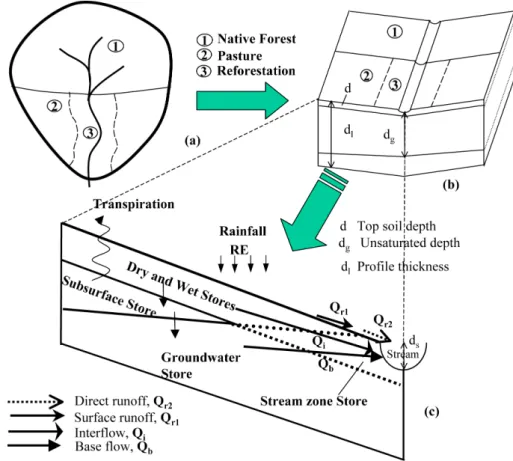
Fig. 4.Schematic diagram of five-store model,(a)a hypothetical catchment,(b)open book representation,(c)five stores.
in salinity during the early winter flow, due to evaporation and flushing of salts accumulated in the stream zone.
4 Model description
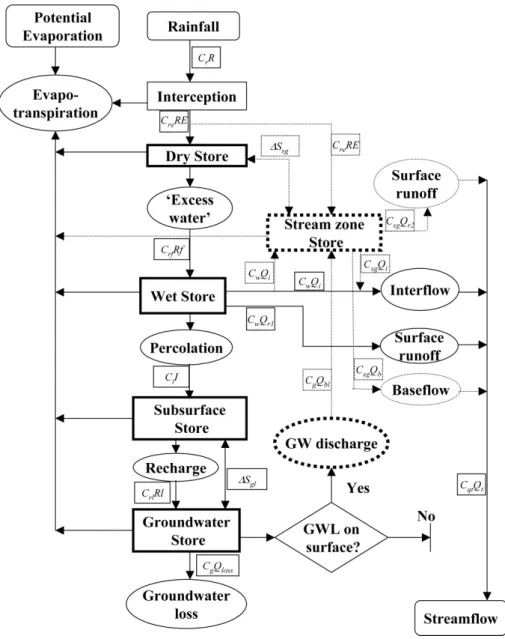
We introduced a salinity component into the daily water bal-ance model (Bari and Smettem, 2006). The structure of the coupled model remained unchanged (Fig. 4) from the water balance model in terms of stores and fluxes between them. The water balance model includes evapotranspiration, sur-face runoff and interflow, percolation and recharge to the deep groundwater. The model also includes the dynamic variation of the stream-zone saturated areas and discharge (if any) from the deep groundwater system. The water balance model has five stores: (i) Dry, Wet and Subsurface Stores, (ii) Groundwater Store and (iii) transient Stream zone Store (Fig. 5).
Evapotranspiration comprises three components: intercep-tion, plant transpiration and soil evaporation. Interception is represented by a canopy store, which is dependent on the Leaf Area Index of the vegetation. The rest of the rainfall reaches the soil surface and either infiltrates or generates runoff. Rainfall salt is intercepted on the plant leaves but then washed onto the soil surface in the subsequent events.
Fig. 5.Schematic representation of the water and salt balance model.
Table 1.Water balance components (mm) of Lemon and Ernies catchments.
Water balance Ernies catchment Lemon catchment
components Pretreatment Transitional Stability Pretreatment Transitional Stability 1974–1976 1977–1995 1996–1998 1974–1976 1977–1995 1996–1998 Rainfall 2121 13 440 2237 2121 13 440 2237 Interception 329 2241 361 329 1290 211 Transpiration 1863 10 950 1755 1727 8622 1437 Soil evaporation 46 287 46 44 837 147
Surface runoff 9 54 12 43 428 122
Interflow 49 59 34 69 669 215
Baseflow 0 0 0 0 80 60
Loss through base 1 8 1 1 23 5
Store. It is a function of the lateral hydraulic conductivity of the aquifer, hydraulic gradient and discharge area along the stream.
4.1 Salt interception
Rainfall salt intercepted by the plant canopies is washed off to the ground by the next rainfall event. Salt fall and salt storage (Sr)on the canopy depends upon rainfall (R)and its
salinity (Cr). It can be calculated as:
Sr(t+1)=Cr(t, t+1)R(t, t+1)+Sr(t ) (1)
Following evaporation of intercepted water, the concentra-tion of effective rainfall (Cre)increases. Salinity of the
effec-tive rainfall and salt fall on the ground (Sre)can be calculated
as: Cre =
Sr
RE if RE >0 (2a)
Cre =0 if RE=0 (2b)
Sre=CreRE (2c)
4.2 Unsaturated salt stores 4.2.1 Salt in the Dry Store
The Dry Store is conceived to receive rainfall salt and rep-resents most of the salt contained in the highly conductive, shallow, top soil. We assume complete mixing of salt and water within the store and represent the unsaturated or “im-mobile” state of solute. When the moisture content of part of the catchment exceeds field capacity (θf), this store releases
water and salt to the Wet Store (Bari and Smettem, 2006). Salt concentration of the Dry Store is:
Cd=
Sd
Wd
(3) After effective rainfall, part is released from the Dry Store to the Wet Store. The concentration of the released salt (Crf)
depends upon chemical processes like dilution-diffusion-advection-dispersion-convection. We introduced a lumped parameter (Cu)to represent these processes. Therefore, the
concentration (Crf)of the “excess water” (Rf )and the salt
released from Dry Store to Wet Store (Srf)can be expressed
as:
Crf =CuCd (4a)
Srf =CrfRf (4b)
When the groundwater level rises and intersects the stream bed the Stream zone Store comes into play. The Dry Store loses salt to the Stream zone Store (1Ssg)when the saturated
area expands and gains salt when that contracts. This can be calculated as:
1Ssg=Cd1Wsg if 1dg <0 (5a)
1Ssg=Csg1Wsg if 1dg>0 (5b)
The Dry Store Salt update at any time (t+1) is:
Sd(t+1)=Sd(t )+Sre(t, t+1)−Srf(t, t+1)−1Ssg(t, t+1) (6) 4.2.2 Salt in the Wet Store
The Wet Store represents salt in the water that is free to move vertically and laterally. The Wet Store represents the dynam-ically variable saturated areas, predominantly observed in the near-surface stream zone. Salt concentration (Cw)of the Wet
Store is dependent on the amount of salt (Sw)and water (Ww)
present at a particular time: Cw =
Sw
Ww
(7) The surface runoff is generated as saturation excess (Qr1) and from the “impervious” groundwater induced saturated area (Qr2). Surface runoff (Qr2)brings rainfall salt to the Stream zone Store and contributes salt to the stream (Eq. 20). If we assume free mixing, the concentrations of the surface runoff (Qr1)and interflow (Qi)are identical to the Wet Store
concentration (Cw). Therefore, salt transported to the stream
by surface runoff (Qr1)and interflow are:
Sqr1=CwQr1 (8)
Sqi=CwQi (9)
The percolation (I ) from the Wet Store to the Subsurface Store includes preferential flow. The salt concentration of the percolated water is less than that of the Wet Store and is represented by introducing a parameter (C). Therefore, the total salt transported from the top soil to the subsurface unsaturated profile (Si)and its concentration (Ci)are:
Ci =CCw (10a)
Si =CiI (10b)
Under a native forest scenario salt content of the Wet Store should remain stable for a long period of simulation. The salt balance of the Wet Store can be expressed as:
Sw(t+1)=Sw(t )+Srf(t, t+1)−Sqr1(t, t+1)
−Sqi(t, t+1)−Si(t, t+1) (11)
4.2.3 Salt in the Subsurface Store
The Subsurface Store represents the salt bulge naturally present in the unsaturated soil profile. The salt concentration of this store (Cl)can be expressed as:
Cl =
Sl
Wl
that the concentration of the recharge salt can be expressed as a function of salt concentration of the Subsurface Store and the parameter used for the Dry Store. Therefore the salinity (Crl)and salt load of recharge (Srl)can be expressed as:
Crl =CuCl (13a)
Srl =CrlRl (13b)
The Subsurface Store exchanges salt to the Groundwater Store (1Sgl)due to the fluctuation of the groundwater level
(1dg)and can be quantified as:
1Sgl=1WglCl, if 1dg≤0 (14a)
1Sgl=1WglCg, if 1dg≥0 (14b)
The salt balance of the Sub-surface Store at time (t+1) is given as:
Sl(t+1)=Sl(t )+Si(t, t+1)−Srl(t, t+1)−1Sgl(t, t+1)(15)
4.3 Salt in the Groundwater Store
The salt present in the Groundwater Store (Sg)is initially
es-timated from salinity of the observation bores or salt storage data and the concentration can be expressed as:
Cg=
Sg
Wg
(16) The Groundwater Store contributes salt (Sqbl)to the stream
when the groundwater system intersects the stream bed. This store can also lose salt (Sqlo)to the down stream groundwater
system, which is not recorded by the gauging station. There-fore, loss of salt from the Groundwater Store below the gauge and salt contribution to the stream zone can be expressed as:
Sqbl=CgQbl (17)
Sqlo=CgQloss (18)
When the groundwater level fluctuates, the Groundwater Store exchanges salt to the Subsurface Store (Eq. 14). The Groundwater Store salt balance can expressed as:
Sg(t+1)=Sg(t )+Srl(t, t+1)−Sqlo(t, t+1)
−Sqbl(t, t+1)+1Sgl(t, t+1) (19)
4.4 Salt in the Stream zone Store
The Stream zone salt Store is transient and is created by the deep groundwater system only. When the groundwater level is at or above the stream bed salt storage is controlled by the surface runoff, interflow and baseflow. Soil evaporation also takes place from this store, which eventually increases the salt concentration and in the dry months leaves salt on the surface (surface salt crusting). When the Stream zone Store contracts/expands it exchanges salt with the Dry Store. Salt
is brought to this store by rain, interflow (from the Wet Store) and baseflow (from the Groundwater Store) components. We calculate the salt balance of this store sequentially, firstly for surface runoff and then interflow and baseflow respectively. Surface runoff (Qr)consists of runoff generated from the
transient stream zone saturated areas (Qr1)and from ground-water induced saturated areas (Qr2). Both of these compo-nents mix with the salt in the stream zone to some extent and bring it to stream. For simplicity we assume thatQr1 does not mix with the salt in the stream zone whileQr2is well mixed. Salt contribution (Sqr2)byQr2, its
concentra-tion (Cqr2)and salt balance of the store can be calculated as:
Cqr2=
Ssg+CreQr2 Wsg+Qr2
(20a)
Sqr2=Cqr2Qr2 (20b)
Ssg(t+1)=Ssg(t )+Cre(t, t+1)Qr2(t, t+1)
−Sqr2(t, t+1) (20c)
Similar to the surface runoffQr2, salt storage and
concentra-tion are sequentially updated due to interflow and baseflow. There is also exchange of salt between the Stream zone Store and the Dry Store, due to contraction/expansion of the stream zone saturated area (Eq. 5). Therefore, the salt balance of the Stream zone Store after each time step can be expressed as: Ssg(t+1)=Ssg(t )+1Ssg(t, t+1) (21)
4.5 Stream salt load
Stream salt load is the sum of surface runoff interflow and baseflow salt components. The total salt flow to stream (Sqt)
and salinity (Cqt)can be expressed as:
Sqt=Sqr1+Sqr2+Sqi+Sqb (22a)
Cqt =
Sqt
Qt
(22b)
5 Model calibration and data requirements
The coupled water and salt balance model is calibrated se-quentially. At first the parameters related to water balance are calibrated (Bari and Smettem, 2006), and then the other parameters associated with the salt balance. The salt balance model has two parameters. The first one(Cu)is related to
of the percolation water and represents the vertical advec-tion, probably due to the presence of preferred pathways in the unsaturated soil profile (Johnston et al., 1987). These two parameters were calibrated through trial and error. Under a native forest scenario the calibrated values of these two pa-rameters should be such that the salt storage of the Dry and Wet Stores remains stable under long term simulations, and that the predicted salinity should reasonably match with the observed data.
In the coupled salt and water balance model Ernies catch-ment was represented as one subcatchcatch-ment. To represent clearing of forest, Lemon catchment was divided into two subcatchments with 53% and 47% of the area respectively (Fig. 2). To represent clearing, only the rooting depth and LAI of one subcatchment were changed from trees to pas-ture values in 1977 when clearing took place.
The first five-year’s stream salinity data of Ernies catch-ment and data up to 1987 of Lemon catchcatch-ment was used for the coupled model calibration. The rest of the observed data was used for model verification. We took the arith-metic average of the observed salt fall data and it remained constant over time for both catchments. The initial condi-tions of the five connecting Stores are estimated from ob-served soil salt profile data. Soil salt profiles were taken from five boreholes, located in the stream zone, mid slope and up slope at each of the catchments. Salt storage ranged from less than 1 kg m−3to 7 kg m−3. Salt content of the Sub-surface Store was estimated at 2.5 kg m−3 for both catch-ments. Salt concentration of the Groundwater Store was taken as the average salinity of the groundwater observation bores. At the Lemon catchment salinity of the permanent groundwater system was measured in 72 observation bores and was showing a large variation, ranging from 1000 to just less than 6000 mg L−1 TDS. This large variation may par-tially be due to the presence of localised preferred pathway recharge (Johnston, 1987) and different hydraulic properties of the aquifer. We assumed an initial average Groundwa-ter Store concentration of 4000 mg L−1TDS. At the Ernies catchment, groundwater salinity was monitored in 21 bores and ranged from 2500 mg L−1TDS to 8000 mg L−1TDS. An initial mean salinity of 5000 mg L−1TDS for the Groundwa-ter Store was adopted for modelling.
6 Model application and testing
6.1 Salinity variations in different stores
In the south west of Western Australia, salinity observed in shallow bores (less than 2.5 m deep) is generally fresh (<500 mg L−1 TDS) while the groundwater level remains below the stream bed. Similar results were also obtained from Lemon and Ernies catchments. At Ernies catch-ment, shallow bores located in the dynamically contribut-ing saturated area exhibit salinity variations rangcontribut-ing from
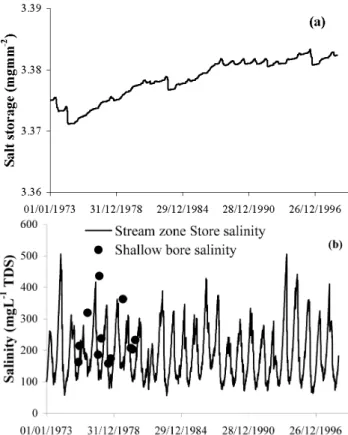
Fig. 6. Ernies catchment(a)salt in the Dry Store, and(b)salinity of the Wet Store.
150 mg L−1 TDS to 400 mg L−1 TDS. The measured salt content of the shallow top soil ranged between 2.5 mg mm−1 to 4.5 mg mm−1. The predicted salt content of both the Dry Store of Ernies catchment was within that range and re-mained stable during the study period (Fig. 6a). The salt content of the Wet Store was also stable. The predicted salin-ity of the stream zone saturated area (Stream zone Store) has similar range to the salinity observed in the shallow bores located along the stream lines (Fig. 6b).
Fig. 7.Salinity at the saturated area of Lemon catchment.
250 mg L−1 TDS. Since 1987 the salinity recorded in the same bore was in excess of 4000 mg L−1TDS, mainly due to the contribution of the groundwater system. The model also successfully predicted similar salinity of the saturated areas of Lemon catchment (Fig. 7).
6.2 Stream salinity and salt load
The salt model was applied on a daily time step for the whole 27-year simulation period. In most of the years before and after clearing, modelled streamflow, salinity and salt load matched the observed data reasonably well for both catch-ments.
6.2.1 Daily salinity
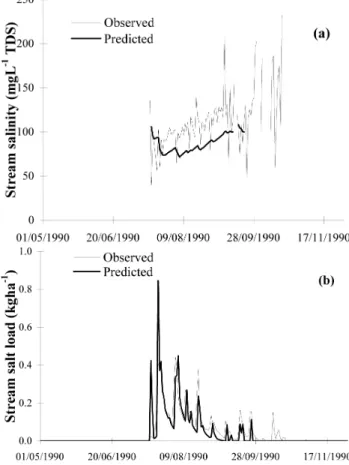
The Ernies catchment exhibited average flow in 1990. The observed and simulated daily streamflow hydrographs were very similar. As the permanent groundwater system was far below the stream, there was no contribution of groundwa-ter salt to the stream. The predicted salinity was slightly lower than observed (Fig. 8a). The observed and predicted stream salt loads were well matched, except during the re-cession periods, when the predicted load was slightly lower than recorded (Fig. 8b). In 1996, Ernies catchment received a particularly large annual rainfall of 880 mm. Streamflow started some time in July, increased during the high-rainfall winter months, and dried out by November. The model suc-cessfully represented the flow and salinity generation pro-cesses over this period. The observed daily stream salinity was reasonably stable at around 85 mg L−1 TDS (Fig. 9a). The predicted salinity was slightly smaller than the observed salinity but the overall trend was very similar. The model ac-curately estimated the stream salt load, including the peaks and recession (Fig. 9b).
The Lemon catchment produced the lowest flow on record in 1979, just two years after clearing. There was an imme-diate increase in stream salinity, in the order of 20 mg L−1 TDS, following clearing. The observed daily salinity was
Fig. 8.Actual and predicted stream(a)salinity and(b)salt load for 1990 – Ernies catchment.
Fig. 9.Actual and predicted stream(a)salinity and(b)salt load for 1996 – Ernies catchment.
predicted daily stream salinity was reasonably well matched, but slightly lower during October to December. The pre-dicted salt load was in close agreement with the observed salt load, with the exception of some peaks (Fig. 11b). In some of the years, matching between the observed and pre-dicted daily stream salinity was poor, probably due to evap-oration and salt accumulation and flushing from the stream zone. However, in terms of salt load, the difference between the observed and predicted salt load was acceptable.
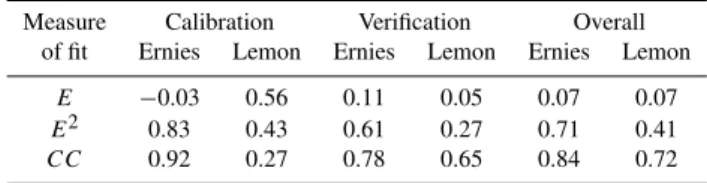
A set of statistical criteria was defined for measuring the agreement between the predicted and observed daily salinity and salt load for both the catchments. These criteria include: (a) Nash-Sutcliffe Efficiency (E2), (b) Correlation Coeffi-cient (CC), and (c) Overall salt balance (E)(Table 2). The Nash-Sutcliffe Efficiency for the Ernies catchment was 0.76 and 0.44, respectively, for the calibration and verification pe-riods. The Correlation Coefficients for both the calibration and verification period were satisfactory. The predicted an-nual salt load at the Ernies catchment was 3% lower and 11% higher than observed during the calibration and verification periods respectively (Table 2). At the Lemon catchment Cor-relation Coefficient was low during the calibration period, probably due to over-prediction of daily salt load, and im-proved siginificantly during the verification period (Table 2).
Fig. 10. Actual and predicted stream(a)salinity and(b)salt load for 1979 – Lemon catchment.
Table 2.Goodness of fit for daily stream salinity simulations.
Measure Calibration Verification Overall
of fit Ernies Lemon Ernies Lemon Ernies Lemon
E −0.03 0.56 0.11 0.05 0.07 0.07 E2 0.83 0.43 0.61 0.27 0.71 0.41 CC 0.92 0.27 0.78 0.65 0.84 0.72
Values of all the statistical criteria improved significantly for the monthly stream salt load (Bari and Smettem, 2005a). 6.2.2 Monthly salinity
Fig. 11. Actual and predicted stream(a)salinity and(b)salt load 1990 – Lemon catchment.
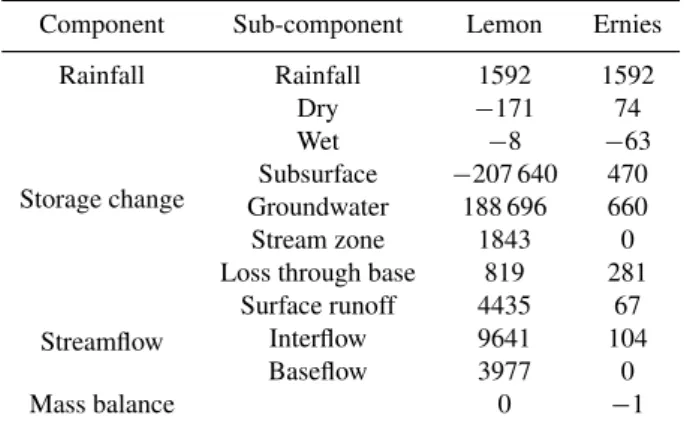
Table 3. Salt balance components (kg/ha) of Lemon and Ernies catchments.
Component Sub-component Lemon Ernies Rainfall Rainfall 1592 1592
Storage change
Dry −171 74 Wet −8 −63 Subsurface −207 640 470 Groundwater 188 696 660 Stream zone 1843 0 Loss through base 819 281
Streamflow
Surface runoff 4435 67 Interflow 9641 104 Baseflow 3977 0
Mass balance 0 −1
on a few occasions. Throughout the study period, the pre-dicted and observed monthly stream salt load generally had a good agreement (Fig. 12b).
6.2.3 Annual salinity and load
An excellent agreement between the observed and predicted annual stream salinity and salt load was observed at Ernies catchment. In 1983, the model slightly over predicted the
Fig. 12. Monthly stream salt load relationships –(a)Ernies,(b)
Lemon catchments.
stream salt load (Fig. 13a), which may be explained by the higher prediction of stream salinity (in excess of 20 mg L−1 TDS). The model also poorly predicted the annual load for 1988, when the catchment experienced two consecutive no-flow years. There is some evidence that the model slightly over predicted the salt load of some of the low flow years, although a very high correlation (R2=0.95) was obtained (Fig. 13b). The observed and predicted salt volumes were 160 kg ha−1 and 171 kg ha−1, respectively, resulting in an over prediction of 7%. The Ernies catchment was receiving more salt than it was discharging, resulting in a salt output to input ratio of 0.12. Therefore, the catchment salt storage also increased by 860 kg ha−1(Table 3). Most of the salt ac-cumulation was in the Subsurface and Groundwater Stores. However the Dry and Wet Store volumes of Lemon catch-ment was reduced due to the developcatch-ment of stream zone salt store (Table 3).
Fig. 13.Actual and predicted annual stream(a)salinity and(b)salt load – Ernies catchment.
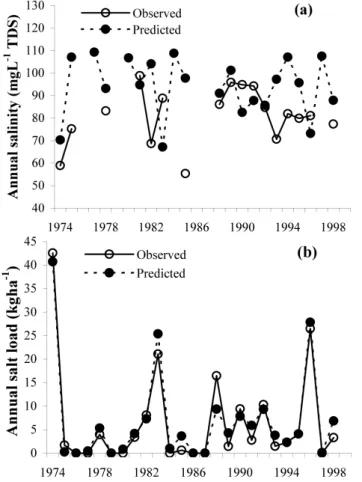
The modelled salinity was reasonable for the whole pe-riod of study (Fig. 14a). The relationship between the ob-served and predicted salt load and salinity were very strong (Fig. 14b). During the study period, total observed and pre-dicted salt discharge from the catchment was 16 982 kg ha−1 and 18 053 kg ha−1, respectively, representing a 6% over pre-diction. The salt output to input ratio changed from less than one in the 1980s to in excess of 30 in the 1990s. This is also evident in the catchment salt storage, which started diminish-ing in the 1990s.
7 General discussion
Estimates of Subsurface and Groundwater salt Stores were limited to salt profiles taken from five locations from each of the catchments. The representation of salt content in the re-golith could be improved with more data, particularly in the stream zone. The salt content of the subsurface unsaturated zone generally correlates with mean annual rainfall (Stokes et al., 1980). The initial salt content of the Subsurafce Store correlated well with the regional estimate. Initially the groundwater salinity varied across the catchments, from less
Fig. 14.Actual and predicted annual stream(a)salinity and(b)salt load – Lemon catchment.
than 1000 mg L−1 TDS to in excess of 6000 mg L−1 TDS. Most of the bores were slotted over the bottom three metres only. Therefore, it was not possible to accurately monitor the increase in groundwater salinity following mobilisation of the salt store by groundwater rise. Most of the groundwa-ter observation bores show some increase in salinity, indicat-ing mobilization and dissolution of salt from the unsaturated profile. The model predicted a systematic increase in salin-ity of the Groundwater Store of Lemon catchment following the rise in groundwater level. Once the groundwater level has been stabilized, it may contribute more salt to the stream than is received by the recharge component. Therefore the salinity of the Groundwater Store may have a gradual decline over a long period of time. A similar result was also predicted by Hatton et al. (2002).
flushed out by storm events. The salt accumulation and flush-ing from the stream zone are attributed to: (a) the magnitude and location of clearing, (b) groundwater table during the previous summer and capillary rise, and (c) summer stream-flow and magnitude of early winter stream-flows (Loh and Stokes, 1981). That means the accumulation of salts on the surface due to soil evaporation, and its dilution and flushing by the surface runoff, is not well simulated by the model. However, this has a negligible effect on the overall salt balance of the catchment.
Sensitivity analysis was performed using key parameters. It show that the relationship between the moisture content and lateral hydraulic conductivity (ia)is the most sensitive parameter. Reduction in calibrated value by 20% increases the daily streamflow, reduces the salt load and salinity. The daily peakflow and interflow components increased signifi-cantly and daily salt load during the recession periods also increased. Increasingia by 20% resulted in a reduction in streamflow volume and increase in salt load. Increasing ver-tical conductivity of the top soil (Kuv)reduces the
stream-flow, increases salt load and vice versa. The lateral conduc-tivity of the Groundwater Store (Kll)has little effect on daily
streamflow and has the greatest impact on daily salt balance. Two parameters related to salt release from Dry to Wet Stores and percolation (Cu, C)are significantly less sensitive
com-pared to the lateral conductivity of the Groundwater Store (Kll). Increasing the top soil depth (d)and the parameters
related to its spatial distribution (b, c)results in a decrease in peakflow and increase in interflow and salinity.
The salt and water balance model presented in this paper was used as “building block” for developing a basin-scale operational catchment hydrology model. A large basin is di-vided into a number of response units to take into account the spatial distribution of rainfall, pan evaporation, soil salt storage and land use and the “building block” model was ap-plied to each of the response units. Generated daily stream-flow and salt loads from each of the response unit is routed downstream based on open channel hydraulics through a de-tailed channel and stream network. The basin-scale opera-tional model has now been applied to predict the effects of logging, forest fire, clearing and reforestation on streamflow and salinity (Bari and Smettem, 2003; Bari and Berti, 2005). The spatial and temporal variations of land use were incor-porated into the model by changing the response unit area where land use change took place. This model has also been successfully used for predicting the effects of different rain-fall scenarios and climate change on catchment yield (Bari et al., 2005). Results demonstrate that the basin scale model can predict catchment processes using readily available data sets and requires minimum parameterisation and calibration.
8 Summary and conclusions
During the pretreatment period, daily streamflow was gen-erated from saturated excess over land flow and interflow processes only for both catchments. The deep groundwa-ter system did not play any role in flow generation, as it was about 15–20 m below stream surface. Average stream salin-ity was between 80 to 100 mg L−1TDS. Following clearing of the Lemon catchment, there was an immediate increase in streamflow. Stream salinity increased to between 100 to 150 mg L−1 TDS. The groundwater system started to rise, dissolved the salt stored in the unsaturated zone and reached the stream invert in 1987. When the groundwater system reached the soil surface the stream became perennial and an-nual runoff volumes increased 4 to 5 times. Anan-nual stream salinity increased to in excess of 2000 mg L−1TDS and salt load increased 80 fold.
A coupled salt and water balance model was successfully developed and applied to represent the key hydrological pro-cesses associated with land use changes. The structure of the salt balance model remained practically identical to the wa-ter balance model. The coupled model has five stores: (i) Dry, Wet and Subsurface Stores, (ii) saturated Groundwater Store, and (iii) a transient Stream zone Store. The Dry and Wet Stores simulate the salt and water movement in the un-saturated zone and near-stream dynamic un-saturated areas. The Subsurface unsaturated Store represents the salt bulge and the salt fluxes due to percolation and recharge. The Ground-water Store quantifies the salt fluxes to the Stream zone Store. In the transient Stream zone Store a ‘free mixing’ between the inflow salt of surface runoff, interflow and baseflow com-ponents is considered.
Appendix A
Symbols and variable names
C Parameter related to the salt release due to per-colation (–)
Cd Salinity of the Dry Store (mg L−1)
Cg Salinity of the Groundwater Store (mg L−1)
Ci Percolation salinity (mg L−1)
Cl Salinity of the Subsurface Store (mg L−1)
Cqr2 Salinity of surface runoffQr2(mg L−1) Cqt Streamflow salinity (mg L−1)
Cr Rainfall salinity (mg L−1)
Cre Effective rainfall salinity (mg L−1)
Crf Salinity of the released water from Dry Store
(mg L−1)
Crl Recharge salinity (mg L−1)
Csg Salinity of the Stream zone Store (mg L−1)
Cu Parameter related to the salt release from Dry
to Wet Store (–)
Cw Salinity of the Wet Store (mg L−1)
d Average depth of top soil (mm)
dg Average depth to groundwater level (mm)
dl Depth of the soil profile (mm)
ds Stream depth (mm)
1dg Changes in groundwater level (mm)
I Percolation (mm) Qi Interflow) (mm)
Qr Total surface runoff (mm), (Qr1+Qr2) Qr1 Surface runoff (mm)
Qr2 Surface runoff from “impervious area”(mm) Qb Baseflow to stream (mm)
Qbl Baseflow to Stream zone Store (mm)
Qloss Groundwater loss below gauge (mm) Qt Total streamflow (mm)
R Actual rainfall (mm) RE Effective Rainfall (mm)
Rf “Excess water” released from Dry Store to Wet Store (mm)
Rl Recharge to Groundwater Store (mm) Sd Salt in the Dry Store (mg mm−2)
Sg Salt in the Groundwater Store (mg mm−2)
1Ssg Change in salt between Stream zone and Dry
Stores (mg mm−2)
Si Salt transported by percolation (mg mm−2)
Sl Salt in the Subsurface Store (mg mm−2)
1Sgl Change in salt between Subsurface and
Groundwater Stores (mg mm−2)
Sqbl Baseflow salt to Stream zone Store
(mg mm−2)
Sqr1 Salt load of surface runoff from pervious area (mg mm−2)
Sqr2 Salt load of surface runoff from “impervious area” (mg mm−2)
Sqi Salt load of interflow (mg mm−2)
Sqb Salt load of baseflow (mg mm−2)
Sqlo Salt loss from Groundwater Store (mg mm−2)
Sr Salt storage on the plant canopy (mg mm−2)
Sre Salt fall on the ground with effective rainfall
(mg mm−2)
Srf Salt transported by “excess water” from Dry to
Wet Store (mg mm−2)
Srl Salt transported by recharge (mg mm−2)
Ssg Salt in the Stream zone Store (mg mm−2)
Sqt Total salt load to stream (mg mm−2)
Sw Salt in the Wet Store (mg mm−2)
Ww Water content of the Wet Store (mm)
Wd Water content of the Dry Store (mm)
Wg Water content of the Groundwater Store (mm)
Wl Water content of the Subsurface Store (mm)
1Wgl Changes in water between Subsurface and
Groundwater Stores (mm)
Wsg Water content of the Stream zone Store (mm)
1Wsg Changes in water content of the Stream zone
Store (mm)
θf Average soil moisture content of top soil
(mm3mm−3)
Edited by: E. Zehe
References
Abrol, I. P., Yadav, J. S. P., and Massoud, F. I.: Salt affected soils and their management, Food and Agricultural Organisation, Soils Bulletin, 39, 131 pp, 1988.
Anon, A.: Salinity: A situation statement for Western Australia – Report to the minister for primary industries and minister for the environment, Western Australia, Perth, 37 pp, 1996.
Bari, M. A., Berti, M. A., Charles, S., Hauck, E., and Pearcy, M.: Modelling of streamflow reduction due to climate change in Western Australia – A case study, MODSIM 2005, Melbourne, December 2005, Australia, 2005.
Bari, M. A. and Berti, M. A.: Predicting stream salinity manage-ment options in the Kent River catchmanage-ment using the LUCICAT model, in: Hydrology 2005, The Institution of Engineers, Can-berra, Australia, 2005.
Bari, M. A. and Smettem, K. R. J.: Modelling monthly runoff gener-ation processes following land use changes: groundwater-surface runoff interactions, Hydrol. Earth Syst. Sci., 8, 903–922, 2004, http://www.hydrol-earth-syst-sci.net/8/903/2004/.
Bari, M. A., Smettem, K. R. J., and Sivapalan, M.: Understanding changes in annual runoff following land use changes: a system-atic data-based approach, Hydrol. Processes, 19(13), 2463–2479, 2005.
Bari, M. A. and Smettem, K. R. J.: A daily water balance model for representing streamflow generation process following land use changes, Hydrol. Earth Syst. Sci., 10, 321–337, 2006,
http://www.hydrol-earth-syst-sci.net/10/321/2006/.
Journal of Water Resources, The Institution of Engineers, Aus-tralia, 7(2), 93–99, 2003.
Bari, M. A. and Croton, J. T.: Predicting the impacts of land use changes on streamflow and salinity by a fully distributed catch-ment model, in: Hydro2000, Third International Hydrology and Water resources Symposium, The Institute of Engineers, Aus-tralia, 2000.
Bari, M. A. and Croton, J. T.: Assessing the effects of valley refor-estation on streamflow and salinity using the WEC-C model, in: Hydrology 2002, 27th Hydrology and Water resources Sympo-sium, The Institute of Engineers, Australia, 176 pp, 2002. Bari, M. A., Smith, N., Ruprecht, J. K., and Boyd, D. W.: The
mechanism of streamflow generation following logging in the southern forest of Western Australia, Hydrol. Processes, 10, 447– 461, 1996.
Croton, J. T. and Bari, M. A.: Using WEC-C, a fully distributed, deterministic catchment model, to simulate hydrologic responses to agricultural clearing, Environmental Modelling and Software, 16, 601–614, 2001.
Ferdowsian, R., George, R. J., Lewis, M. F., McFarlane, D. J., Short, R., and Speed, R.: The extent of dryland salinity in Western Aus-tralia, Proceedings, Productive Use of Saline Lands Conference, Albany, Western Australia, 89–97, 1996.
Ghassemi, F., Jakeman, A. J., and Nix, H. A.: Salinisation of land and water resources – human causes, management and case stud-ies, University of New South Wales Press Ltd., Sydney, 526 pp, 1995.
Halse, S. A., Ruprecht, J. K., and Pinder, A. M.: Salinisation and prospects for biodiversity in rivers and wetlands of south-west Western Australia, Aust. J. of Botany, 51, 673–688, 2003. Hatton, T. J., Silberstein, R. P., and Salama, R. B.: Catchment salt
balances and the future of river salinisation in Australia, CSIRO Land and Water, in: International Groundwater Conference “Bal-ancing the Groundwater Budget”, Darwin, 12–17 May 2002, 2002.
Hatton, T. J., Ruprecht, J., and George, R.,J.: Predicting hydrology of Western Australia wheat belt: Target for future?, Plant and Soil, 257, 341–356, 2003.
Hingston, F. J. and Gailitis, V.: The Geographic Variation of Salt Precipitated over Western Australia, Australian J. of Soil Res., 14, 319–335, 1976.
Johnston, C. D.: Distribution of environmental chloride in relation to sub-surface hydrology, J. Hydrol., 94, 67–88, 1987.
Johnson, C. D., McArthur, W. M., and Peck, A. J.: Distribution of Soluble Salts in Soils of the Manjimup Woodchip Licence Area, Western Australia, CSIRO Land Resources Management Tech-nical Paper No. 5, 1980, 29 pp, 1987.
Klemes, V.: Conceptualisation and scale in hydrology, J. Hydrol., 65, 1–23, 1983.
Loh, I. C. and Stokes, R. A.: Predicting stream salinity in south-western Australia, Agric. Wat. Manage., 4, 227–254, 1981. Mauger, G. W.: Darling Range Catchment Model. Vol. 1 –
Concep-tual model, Water Authority of Western Australia, Rep. No. WP 9, 47 pp, 1986.
Mayer, X. M., Ruprecht, J. K., Muirden, P. M., and Bari, M. A.: Stream salinity in the south-west of Western Australia, In: Engi-neering Salinity Solutions, First EngiEngi-neering and Salinity Solu-tions Symposium, The Institute of Engineers, Australia, 2004.
Mckell, C. M., Goodin, J. R., and Jeffries, R. L.: Saline land of the United States and Canada. Reclaim. Reveg. Res., 5, 159–165, 1986.
Miller, M. L., Brown, P. L., Donovan, J. J., Bergatino, J. L., Son-dergger, J. I., and Schmidt, F. A.: Saline seep development and control in the North American Great Plains – hydrogeological aspects, Agricultural Water Management, 4, 115–141, 1981. Peck, A. J. and Williamson, D. R. (Eds.): Hydrology and salinity in
the Collie River Basin, Western Australia, J. Hydrol., 94, 1–198, 1987.
Peck, A. J. and Hatton, T.: Salinity and the discharge of salts from catchments in Australia, J. Hydrol., 272 191–202, 2003. Ruprecht, J. K. and Schofield, N. J.: Analysis of streamflow
gener-ation following deforestgener-ation in southwest Western Australia, J. Hydrol., 105, 1–17, 1989.
Ruprecht, J. K. and Schofield, N. J.: The effect of partial deforesta-tion on hydrology and salinity in high salt storage landscapes. I. Extensive block clearing, J. Hydrol., 129, 19–38, 1991. Schofield, N. J. and Ruprecht, J. K.: Regional analysis of stream
salinisation in southwest Western Australia. J. Hydrol., 112, 19– 39, 1989.
Sivapalan, M., Viney, N. R., and Ruprecht, J. K.: Water and salt balance modelling to predict the effect of land use changed in forested catchments, III. The large catchment model, Hydrol. Processes, 10, 429–446, 1996.
State Salinity Council: Natural resource management in Western Australia – the salinity strategy, Government of Western Aus-tralia, 72 pp, 2000.
Stokes, R. A., Stone, R., and Loh, I. C.: Summary of Soil Salt Stor-age Characteristics in the Northern Darling Range, Water Re-sources Section, Public Works Department of W.A., Report No. 4, 20 pp, 1980.
Stolte, W. J., McFarlane, D. J., and George, R. J.: Flow systems, tree plantations, and salinisation in a Western Australian catchment, Australian J. Soil Res., 35, 1213–1229, 1997.
Thornburn, P. J.: Occurrence and management of dryland salinity on the Darling Downs, Queensland, Australian J. Soil and Water Conservation, 4, 26–32, 1991.
Tuteja, N. K., Beale, G., Dawes, W., Vaze, J., Murphy, B., Barnett, P., Rancic, A., Evans, R., Geeves, G., Rassam, D., and Miller, M.: Predicting the effects of landuse change on water and salt balance – a case study of a catchment affected by dryland salinity in NSW, Australia, J. Hydrol., 283, 67–90, 2003.
Viney, N. R. and Sivapalan, M.: Modelling catchment processes in the Swan-Avon River basin, Hydrol. Processes, 15(13), 2671– 2685, 2001.
Viney, N. R., Sivapalan, M., and Deeley, D.: A conceptual model of the nutrient mobilisation and transport applicable at large catch-ment scale, J. Hydrol., 240, 23–44, 2000.
Williamson, D. R., Stokes, R. A., and Ruprecht, J. K.: Response of input and output of water and chloride to clearing for Agriculture, J. Hydrol., 94, 1–28, 1987.