http://dx.doi.org/10.1590/2318-0331.011616055
Revista Brasileira de Recursos Hídricos
Brazilian Journal of Water Resources
Versão On-line ISSN 2318-0331
RBRH, Porto Alegre, v. 21, n. 4, p. 653-665, out./dez. 2016
Artigo Cientíico/Técnico
This is an Open Access article distributed under the terms of the Creative Commons Attribution License, which permits unrestricted use, distribution, and reproduction in any medium, provided the original work is properly cited.
Evolution of physicochemical species concentration in streams based on heavy
rainfall event data obtained for high-frequency monitoring
Evolução da concentração de espécies físico-químicas no curso da água após eventos de precipitação intensa obtida por monitoramento de alta-frequência
Rubia Girardi1, Adilson Pinheiro1, Edson Torres1, Vander Kaufmann1 and Luis Hamilton Pospissil Garbossa2
1Fundação Universidade Regional de Blumenau, Blumenau, SC, Brazil
2Empresa de Pesquisa Agropecuária e de Extensão Rural de Santa Catarina, Florianópolis, SC, Brazil
E-mails: [email protected] (RG), [email protected] (AP), [email protected] (ET), [email protected] (VK), [email protected] (LHPG)
Received: May 10, 2016 - Revised: June 02, 2016 - Accepted: June 02, 2016
ABSTRACT
Studies carried out over short time intervals assist in understanding the biogeochemical processes occurring relatively fast in natural waters. High frequency monitoring shows a greater variability in the water quality during and immediately after heavy rainfall events. This paper presents an assessment of the surface water quality parameters in the Atlantic Forest biome, caused by heavy rainfall
events. The work was developed in two luviometric sections of the Concordia River watershed, located in the state of Santa Catarina, southern Brazil. The spatial distribution of land use shows the predominance of Atlantic Forest in luviometric section 1 (FS1) and pasture, forestry, agriculture, and Atlantic Forest in luviometric section 2 (FS2). In each selected heavy rainfall event, the evolution rainfall height, the water level, and physicochemical parameters of water were analyzed. In all events, the water quality changed due to the heavy rainfall. After the events, an increase in water level and turbidity in both luviometric sections were detected. In addition, the
ammonium ion concentration increased in the river, and the pH value and nitrate concentration decreased. The electrical conductivity presented different behavior in each section. The dissolved oxygen concentration increased in 19 of 27 events. The principal component (PC1) correlated with the turbidity in FS1, and it correlated with level, turbidity, and pH in FS2.
Keywords: Atlantic Forest; Ombrophilous Dense Forest; Water quality; In situ monitoring.
RESUMO
Estudos realizados em intervalos curtos de tempo auxiliam no entendimento dos processos biogeoquímicos, que ocorrem relativamente rápido em águas naturais. Os dados de alta frequência revelam maior variabilidade na qualidade da água durante e imediatamente
após os eventos de precipitação intensa. Este artigo busca avaliar as alterações dos parâmetros de qualidade de águas supericiais, em bioma de Mata Atlântica, provocadas por eventos de precipitação intensa. O trabalho foi realizado em duas seções luviométricas da
bacia do Ribeirão Concórdia, localizado no estado de Santa Catarina, sul do Brasil. A distribuição espacial do uso do solo demonstra a
predominância de Mata Atlântica na seção 1 e pastagem, relorestamento, Mata Atlântica e agricultura na seção 2. Em cada evento de precipitação intensa selecionado, foi analisada a evolução temporal da altura da precipitação, da cota luviométrica e de cada parâmetro
físico-químico da água. Em todos os eventos a qualidade da água sofreu alterações em virtude da precipitação intensa. Após os eventos,
houve aumento da cota e da turbidez em ambas as seções luviométricas, já o íon amônio teve acréscimo de concentração no rio e o pH diminuiu. A condutividade elétrica apresentou comportamento diferente em cada seção. O nitrato diminuiu sua concentração logo
após a precipitação. O oxigênio dissolvido aumentou sua concentração em 19 dos 27 eventos. A componente principal CP1 apresentou correlação com a cota, nitrato e a turbidez, na seção 1 e com cota, turbidez e pH na seção 2.
INTRODUCTION
Water composition is inluenced by several physical, chemical, and biological factors. These factors are inluenced by
natural events and human actions. A natural phenomenon that often occurs is the runoff generated by intense or prolonged rainfall events, even in forested areas (KLIMASZYK et al., 2015). The changes that can occur in water composition depend on the intrinsic characteristics of the environment.
The heavy rainfall events inluence the surface and
subsurface runoff and carry physical, chemical, and biological elements into the stream, changing their characteristics quickly. Although there are numerous studies showing that weekly samples
can be used to elucidate the seasonal response and nutrient low,
high frequency data show a greater variability in the water quality
under the inluence of heavy rainfall events. The temporal sample
collection distribution is critical in determining the chemical status of the stream (WADE et al., 2012) and can be used as a basis for climate assessment and land use changes within a watershed area (MORAETIS et al., 2010).
High frequency measurements are improving and becoming commonplace with the help of automatic monitoring instruments. These technological developments provide rainfall measurements,
stream low, and physicochemical parameters in short time
intervals (KIRCHNER et al., 2004), such as seven-hour intervals (HALLIDAY et al., 2012; NEAL et al., 2013; NEAL et al., 2012), two-hour intervals (DONN; BARRON; BARR, 2012), hourly intervals (BOWES et al., 2015; HALLIDAY et al., 2014; JORDAN et al., 2007; RÜCKER; SCHRAUTZER, 2010; WADE et al., 2012), or in minutes (CASSIDY; JORDAN, 2011; DOWNING et al., 2009; MORAETIS et al., 2010; TERCIER-WAEBER et al., 2009). High frequency monitoring helps our understanding of the biogeochemical processes that occur in natural waters in short time intervals (MORAETIS et al., 2010; SANDFORD;
EXENBERGER; WORSFOLD, 2007; WADE et al., 2012). These processes play an important role in water balance systems. Studies done in the last 20 years helped to demonstrate the importance of interconnections between the biogeochemical processes in water bodies (NIMICK; GAMMONS; PARKER, 2011).
KIRCHNER et al. (2004) reported that quantitative and qualitative high frequency hydrological monitoring allows the
identiication of the time evolution of variables in short time
intervals. Weekly monitoring may miss important rainfall events and thus not reveal the coupling between hydrological and chemical dynamics. Even in daily measurements, observations of these processes can be compromised. PRIEN (2007) stated that in situ sensors are needed to acquire new knowledge of the dynamics of natural systems, such as preserved watersheds.
Cassidy and Jordan (2011) stated that neither random sampling nor increasing the sampling frequency from weekly to daily intervals enabled the proper assessment of the descriptors for water quality parameters. These samples are adequate to
characterize the phosphorus transfer through subsurface low,
for example. However, the accuracy in the evolution of total phosphorus concentration was obtained only in samples with hourly intervals or higher frequencies.
Halliday et al. (2014) showed the complexity of the dynamics of nutrients, such as the diurnal cycle two values of
maximum concentration, indicating inluence of wastewater. The identiication of this behavior was only possible due to the
high frequency monitoring for a period of two years. The sampling frequency adopted in conventional monitoring programs for water is not representative.
Studies with high frequency sampling of streams managed to correlate changes in the electrical conductivity to the water runoff (ROBSON et al., 1992), demonstrate the diurnal and seasonal dynamics of nutrients (BOWES; SMITH; NEAL, 2009; CASSIDY; JORDAN, 2011; DONN; BARRON; BARR, 2012; HALLIDAY et al., 2014, 2012; MORAETIS et al., 2010;
NEAL et al., 2012; SANDFORD; EXENBERGER; WORSFOLD, 2007; SCHOLEFIELD et al., 2005; WADE et al., 2012) and metal species (TERCIER-WAEBER et al., 2009), enable mass balances in watersheds (JORDAN et al., 2007; RÜCKER; SCHRAUTZER, 2010), and analyze the spatial and temporal variations of dissolved oxygen (MALCOLM; SOULSBY; YOUNGSON, 2006).
High-frequency sampling research occurs mainly in Europe, especially in the UK. Thus, this article seeks to assess changes in surface water quality parameters of the Atlantic Forest biome, in Brazil, that are due to heavy rainfall events.
MATERIALS AND METHODS
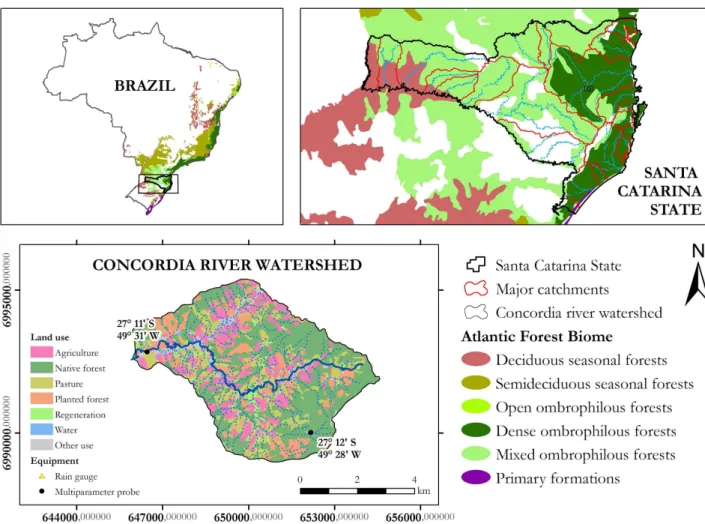
The study was conducted with high-frequency monitoring data from the Concordia River watershed, located in the state of Santa Catarina (SC), southern Brazil. The watershed has a 30.74 km2 drainage area. The location of the study area and the
sampling points are shown in Figure 1. Figure 1 shows a map of Brazil with the remaining area of Atlantic Forest coverage, which extends all along the Brazilian coast.
The predominant soil is Cambisoil, Argisoil, and Gleisoil.
The climate, according to the Köppen classiication, is deined as
CFA (humid temperate climate with hot summer). This region has a subtropical climate, which is constantly moist, without a dry season, and with hot summers (average temperature of the
warmest month > 22.0 °C). It has an average annual rainfall of
1,514 mm. The original vegetation coverage is Ombrophilous Dense Forest, one of three phytoecological regions of Atlantic forest found in Santa Catarina State. The watershed comprises mainly agricultural activities in small and medium-sized farms (EPAGRI, 2005; SANTA CATARINA, 2006).
Two luviometric stations were deployed with a data logger
recording rainfall, water level, and representative parameters of water quality. The rainfall height was measured at two points in the watershed, with the rain gauge Water Log, the tipping bucket type, with compensation depending on rain intensity. The equipment was set to store the data at 15 minute intervals. Water levels were measured with a Thalimedes sensor OTT, buoy, and counterweight inside a PVC pipe installed along the channel margin. The stream water quality parameters were measured in both locations with the use of a multiparameter probe, the Hydrolab DS5X model. The devices employed in this study use ion-selective electrodes to
measure nitrate (NO3–) and ammonium (NH 4
+), optical sensors to
RBRH, Porto Alegre, v. 21, n. 4, p. 653-665, out./dez. 2016 655 Girardi et al.
The measurement and calibration of the probes were performed with standard solutions with an average time interval of 90 days.
The criteria analyzed by these multi-parameter probes are representative of water quality. Of the 125 parameters analyzed by Christensen (2001), only 10 are signiicant for which water quality criteria were not met. The turbidity is a variable related to total phosphorus and suspended sediments in the water sample.
Nitrate and ammonium are important nutrients to monitor for
water quality because they originate with plants and agricultural activity (CHAPRA, 1997). The parameters electrical conductivity and pH are related to the water quality of ecosystems; they are the main parameter for this analysis. The pH is adopted as a general indicator of the resilience of a watershed and river against soil
acidiication. The electrical conductivity is an indicator of total
dissolved solids and is generally used to estimate ionic contribution
of rainfall and sub-supericial water (MAKINECI; DEMIR;
KARTALOGLU, 2015).
Fluviometric section 1 (FS1) is located 726 m above sea level at a latitude 27° 12’ S and longitude 49° 28’ W and has 0.42 km2
drainage area. Fluviometric FS2 (FS2) is located 330 m above sea level at latitude 27° 11’ S and 49° 31’ W longitude and has a 29.89 km2 drainage area. The land use upstream of FS1 and FS2
of the Concordia river watershed is shown in Table 1. The spatial distribution of land use is shown in Figure 1. The watershed has
a high fragmentation of the land use, mainly due the existence of small - and medium - sized farms.
The native forest area, presented in the FS1, is a remaining region of high-montane Ombrophilous Dense Forest in an advanced stage of succession. The interior of this forest consists of dense and shrubby vegetation, composed of ferns, arborescent bromeliads and palms. The soil of this area is well drained and there is a thick organic layer, due to low degradation of the leaf litter. This is due to the moderate local temperatures. The average temperatures are 5 to 10 °C in the winter and 18 to 25 °C in the summer (LINGNER et al., 2013).
The FS2 area receives contributions from the entire studied watershed. This section is located near the mouth the
Figure 1. Atlantic forest cover in Brazil, Santa Catarina State and land use in Concordia River watershed.
Table 1. Land use upstream of luviometric sections of the
concordia river watershed.
Class FS1 (%) FS2 (%)
Pasture 17.54
Planted forest 14.40 Atlantic forest 100 45.10
Water body 1.11
Agriculture 15.65
Regeneration 2.30
Concordia River. Whereas FS1 includes only native forest, the FS2 area represents fragmented land use with agricultural, forest
and pasture inluences (Table 1).
According to Robson et al. (1993) events that produce low runoff do not produce immediate chemical changes in streams;
however, events that produce rising stream low produce quick
responses. Thus, heavy rainfall events were selected based on
the results from the rain gauges data. In this study, heavy rainfall
events are those where intensity is equal or greater than 56 mm.h-1,
evaluated at 15 min time intervals. The monitoring period was from 12/16/2011 until 11/30/2013.
In each selected heavy rainfall event, the temporal evolution
of height rainfall, water level, and physicochemical parameters of water were analyzed. Water quality time series was from 6 h before the start of rainfall until 18 h after the end of rainfall in order to establish the river situation before and after the event.
In FS1, 24 rainfall events were selected, while in FS2, there were
20 events. However, only 12 and 15 events could be used in the study. Problems with the power supply for multiparameter probes prevented the analysis of all the events.
To evaluate any statistical differences before and after rainfall,
each parameter was irst checked for normal data distribution
by using the Shapiro-Wilk test in the percentual difference of
each parameter. The paired t-test for the data group, in which a normal distribution and the Wilcoxon test for data that does not
have normal distribution, was applied. In all the tests, 0.05 was established as the signiicance level. The mathematical and statistical
calculations were made using Excel 2010 software (Microsoft
Ofice) and the Action package.
The evolution of physicochemical parameters in both gauged sections was compared. The original set of observed variables was transformed into a set of core components with the Past software. The percentual differences between the beginning and end of the rainfall events were used in the calculations.
RESULTS AND DISCUSSION
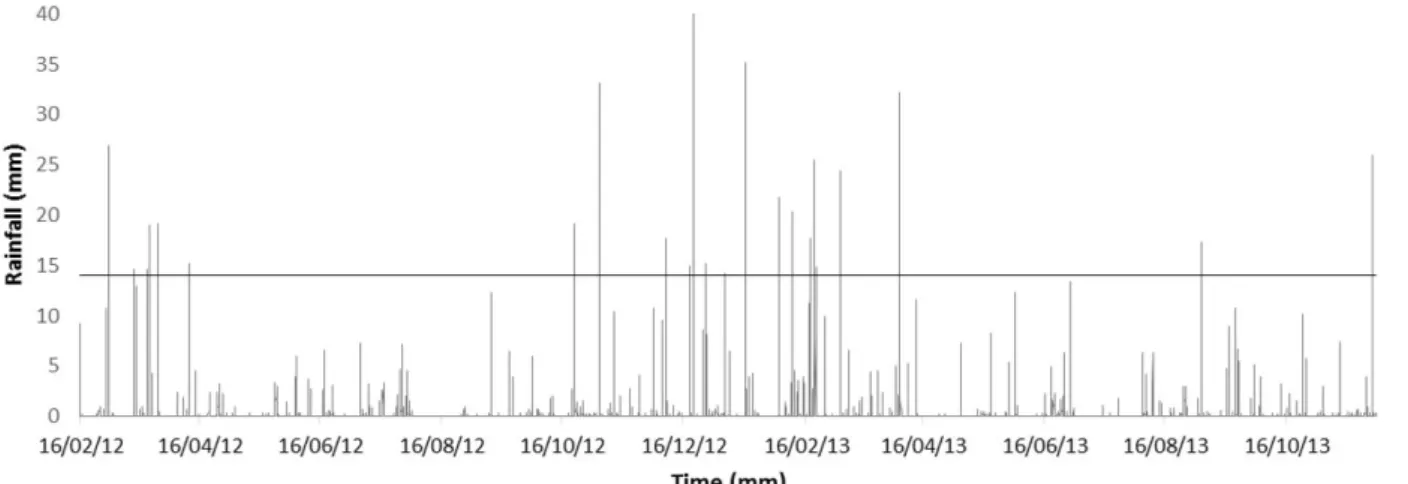
In the period of approximately two years, several heavy rainfall events were recorded. Some of the events produced loods
in contributing watersheds in FS1 and FS2. The selected events presented rainfall heights ranging from 14.6 - 35.1 mm, which generated maximum water levels ranging from 35 - 67 cm in FS1 and from 203 - 497 cm in FS2 (Table 2). The temporal evolution of rainfall in FS1 and FS2 is shown in Figures 2 and 3, respectively. Above the horizontal line as intense rainfall considered in this study.
Figure 2. Temporal evolution of rainfall height in FS1.
RB
RH
, P
o
rto
A
le
gr
e, v
. 2
1, n
. 4
, p
. 6
53
-6
65
, o
u
t./de
z. 2
01
6
65
7
Gir
ar
di e
t a
l.
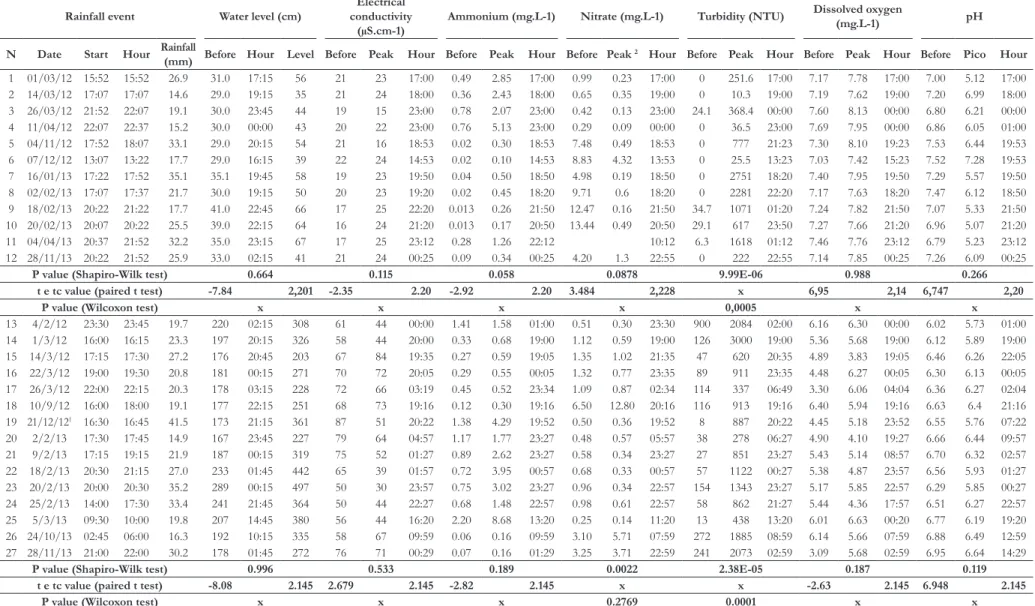
Table 2. Rainfall height, luviometric level, and physicochemical parameters prior to the event and at peak maximum variation.
Rainfall event Water level (cm)
Electrical conductivity
(µS.cm-1)
Ammonium (mg.L-1) Nitrate (mg.L-1) Turbidity (NTU) Dissolved oxygen
(mg.L-1) pH
N Date Start Hour Rainfall
(mm) Before Hour Level Before Peak Hour Before Peak Hour Before Peak
2 Hour Before Peak Hour Before Peak Hour Before Pico Hour
1 01/03/12 15:52 15:52 26.9 31.0 17:15 56 21 23 17:00 0.49 2.85 17:00 0.99 0.23 17:00 0 251.6 17:00 7.17 7.78 17:00 7.00 5.12 17:00
2 14/03/12 17:07 17:07 14.6 29.0 19:15 35 21 24 18:00 0.36 2.43 18:00 0.65 0.35 19:00 0 10.3 19:00 7.19 7.62 19:00 7.20 6.99 18:00
3 26/03/12 21:52 22:07 19.1 30.0 23:45 44 19 15 23:00 0.78 2.07 23:00 0.42 0.13 23:00 24.1 368.4 00:00 7.60 8.13 00:00 6.80 6.21 00:00
4 11/04/12 22:07 22:37 15.2 30.0 00:00 43 20 22 23:00 0.76 5.13 23:00 0.29 0.09 00:00 0 36.5 23:00 7.69 7.95 00:00 6.86 6.05 01:00
5 04/11/12 17:52 18:07 33.1 29.0 20:15 54 21 16 18:53 0.02 0.30 18:53 7.48 0.49 18:53 0 777 21:23 7.30 8.10 19:23 7.53 6.44 19:53
6 07/12/12 13:07 13:22 17.7 29.0 16:15 39 22 24 14:53 0.02 0.10 14:53 8.83 4.32 13:53 0 25.5 13:23 7.03 7.42 15:23 7.52 7.28 19:53
7 16/01/13 17:22 17:52 35.1 35.1 19:45 58 19 23 19:50 0.04 0.50 18:50 4.98 0.19 18:50 0 2751 18:20 7.40 7.95 19:50 7.29 5.57 19:50
8 02/02/13 17:07 17:37 21.7 30.0 19:15 50 20 23 19:20 0.02 0.45 18:20 9.71 0.6 18:20 0 2281 22:20 7.17 7.63 18:20 7.47 6.12 18:50
9 18/02/13 20:22 21:22 17.7 41.0 22:45 66 17 25 22:20 0.013 0.26 21:50 12.47 0.16 21:50 34.7 1071 01:20 7.24 7.82 21:50 7.07 5.33 21:50
10 20/02/13 20:07 20:22 25.5 39.0 22:15 64 16 24 21:20 0.013 0.17 20:50 13.44 0.49 20:50 29.1 617 23:50 7.27 7.66 21:20 6.96 5.07 21:20
11 04/04/13 20:37 21:52 32.2 35.0 23:15 67 17 25 23:12 0.28 1.26 22:12 10:12 6.3 1618 01:12 7.46 7.76 23:12 6.79 5.23 23:12
12 28/11/13 20:22 21:52 25.9 33.0 02:15 41 21 24 00:25 0.09 0.34 00:25 4.20 1.3 22:55 0 222 22:55 7.14 7.85 00:25 7.26 6.09 00:25
P value (Shapiro-Wilk test) 0.664 0.115 0.058 0.0878 9.99E-06 0.988 0.266
t e tc value (paired t test) -7.84 2,201 -2.35 2.20 -2.92 2.20 3.484 2,228 x 6,95 2,14 6,747 2,20
P value (Wilcoxon test) x x x x 0,0005 x x
13 4/2/12 23:30 23:45 19.7 220 02:15 308 61 44 00:00 1.41 1.58 01:00 0.51 0.30 23:30 900 2084 02:00 6.16 6.30 00:00 6.02 5.73 01:00
14 1/3/12 16:00 16:15 23.3 197 20:15 326 58 44 20:00 0.33 0.68 19:00 1.12 0.59 19:00 126 3000 19:00 5.36 5.68 19:00 6.12 5.89 19:00
15 14/3/12 17:15 17:30 27.2 176 20:45 203 67 84 19:35 0.27 0.59 19:05 1.35 1.02 21:35 47 620 20:35 4.89 3.83 19:05 6.46 6.26 22:05
16 22/3/12 19:00 19:30 20.8 181 00:15 271 70 72 20:05 0.29 0.55 00:05 1.32 0.77 23:35 89 911 23:35 4.48 6.27 00:05 6.30 6.13 00:05
17 26/3/12 22:00 22:15 20.3 178 03:15 228 72 66 03:19 0.45 0.52 23:34 1.09 0.87 02:34 114 337 06:49 3.30 6.06 04:04 6.36 6.27 02:04
18 10/9/12 16:00 18:00 19.1 177 22:15 251 68 73 19:16 0.12 0.30 19:16 6.50 12.80 20:16 116 913 19:16 6.40 5.94 19:16 6.63 6.4 21:16
19 21/12/121 16:30 16:45 41.5 173 21:15 361 87 51 20:22 1.38 4.29 19:52 0.50 0.36 19:52 8 887 20:22 4.45 5.18 23:52 6.55 5.76 07:22
20 2/2/13 17:30 17:45 14.9 167 23:45 227 79 64 04:57 1.17 1.77 23:27 0.48 0.57 05:57 38 278 06:27 4.90 4.10 19:27 6.66 6.44 09:57
21 9/2/13 17:15 19:15 21.9 187 00:15 319 75 52 01:27 0.89 2.62 23:27 0.58 0.34 23:27 27 851 23:27 5.43 5.14 08:57 6.70 6.32 02:57
22 18/2/13 20:30 21:15 27.0 233 01:45 442 65 39 01:57 0.72 3.95 00:57 0.68 0.33 00:57 57 1122 00:27 5.38 4.87 23:57 6.56 5.93 01:27
23 20/2/13 20:00 20:30 35.2 289 00:15 497 50 30 23:57 0.75 3.02 23:27 0.96 0.34 22:57 154 1343 23:27 5.17 5.85 22:57 6.29 5.85 00:27
24 25/2/13 14:00 17:30 33.4 241 21:45 364 50 44 22:27 0.68 1.48 22:57 0.98 0.61 22:57 58 862 21:27 5.44 4.36 17:57 6.51 6.27 22:57
25 5/3/13 09:30 10:00 19.8 207 14:45 380 56 44 16:20 2.20 8.68 13:20 0.25 0.14 11:20 13 438 13:20 6.01 6.63 00:20 6.77 6.19 19:20
26 24/10/13 02:45 06:00 16.3 192 10:15 335 58 67 09:59 0.06 0.16 09:59 3.10 5.71 07:59 272 1885 08:59 6.14 5.66 07:59 6.88 6.49 12:59
27 28/11/13 21:00 22:00 30.2 178 01:45 272 76 71 00:29 0.07 0.16 01:29 3.25 3.71 22:59 241 2073 02:59 3.09 5.68 02:59 6.95 6.64 14:29
P value (Shapiro-Wilk test) 0.996 0.533 0.189 0.0022 2.38E-05 0.187 0.119
t e tc value (paired t test) -8.08 2.145 2.679 2.145 -2.82 2.145 x x -2.63 2.145 6.948 2.145
P value (Wilcoxon test) x x x 0.2769 0.0001 x x
The maximum increase in the dimension of FS1 occurred on average 02 h 13 min after the onset of a heavy rainfall event, while in FS 2, the response time was 5 h 20 min.
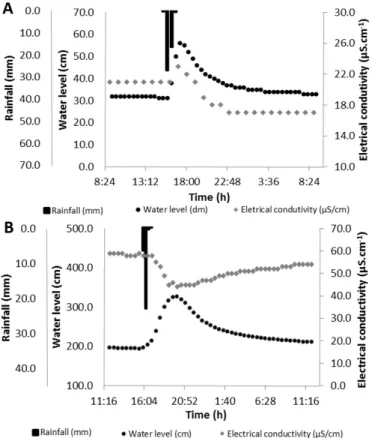
Electrical conductivity increased in value in 10 events in FS1 and four events in FS2. That variation occurs probably due to the runoff transporting substances present in the leaf litter, which is abundant in FS1 and rich in ions and polar molecules. Eisalou et al. (2013) compared the electrical conductivity of rainwater to the
water lowing through the leaf litter and found a value 3.5 higher in the leaf litter, an increase from 40 - 140 μS.cm–1. Monteiro et al.
(2014) found a strong positive relationship between electrical conductivity and dissolved organic carbon in both wet periods
and drought in the Amazon jungle. They also reported that the
dissolved carbon concentration and electrical conductivity had a
good correlation to the streamlow discharge.
There was a reduction of electrical conductivity in two events in FS1 and eleven in FS2, demonstrating that the water that arrived at the scene had a low concentration of polar particles, probably
caused by a dilution effect due to increased low. Additionally, it can
be seen that at nine events, the maximum change in conductivity in FS2 occurred after 4 h of rainfall. Penna et al. (2015) found that the electrical conductivity of groundwater and soil was higher in summer, average on 535 µS.cm–1, decreasing in autumn, and
presenting the lowest values in spring, average on 238 µS.cm–1, relecting the effect of dilution as a result of high rainfall in those
two seasons; a similar situation was found in most events in FS2. Additionally, Salimon et al. (2013) reported that speciic electrical conductivity is inversely related to water discharge and rainfall in Rio Purus, southwestern Amazonia. This is similar to the results
here, in that the increase in the low reduced electrical conductivity. The FS1 electrical conductivity has greater inluence of the runoff than that of FS2. In FS2, the inluence of dilution is
present (see Figure 4). It should be noted that there is a statistical difference in electrical conductivity after rainfall in FS1 and FS2.
The ammonium ion concentration showed an increase
with the passage of the lood. Shortly thereafter, a decrease was
observed, and its value was already near the concentration before
the passage of the lood. This behavior could be observed in both luviometric stations in all the events. However, statistical
differences were observed (Figure 5). The ammonium concentration increased in FS1 and FS2 from 50 - 2500% and from 12 - 448%,
respectively. The great inluence generated by the runoff in FS1 is
probably due to the forest leaf litter, which is rich in ammonium compounds derived from the decomposition of proteins and nucleic acids. The maximum change occurred on average 1 h 19 min after
the start of the event. In FS2, the time to register the maximum
concentration of ammonium ion in the river was, on average, 3 h 32 min. The average concentration of ammonium ion in this station had higher values than in FS1, possibly due to the use of fertilizers from agriculture and leaching by surface and subsurface runoff. This result is corroborated by Chen et al. (2014), who
conirmed that the agricultural areas were the main sources of
nutrients, such as ammonia and sediment in the studied watershed.
Ammonium behavior, increasing at irst discharge and
reducing over time is similar to that found in a study by Bertol et al. (2011) worked in a burned native camp, subjected to simulated rain. The ammonium concentration in that study diminished
Figure 5. Water ammonium concentration in seven and 25 events in FS1 (A) and FS2 (B).
RBRH, Porto Alegre, v. 21, n. 4, p. 653-665, out./dez. 2016 659 Girardi et al.
exponentially from 2 mg.L–1, in the beginning, to the end of the
runoff, when it was in 0.5 mg.L–1. According to the author, the
ammonium concentration in the soil at the beginning of runoff is high, so it is transported in large quantities by the surface runoff, as this ion is very soluble in water. Over time, a dilution effect occurs.
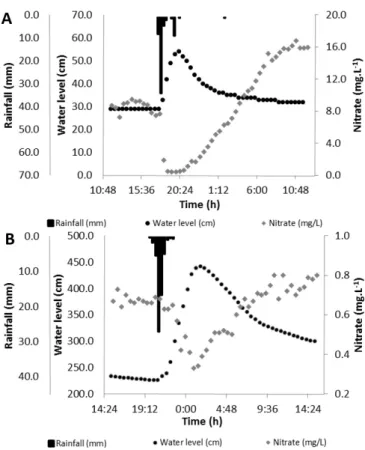
The nitrate ion had similar behavior in 23 of the 27 events
described. Initially, there is a reduction in concentration and
after a few hours, a peak occurred, in most cases, that was higher than the initial concentration (Figure 6). The reduction of the concentration can be attributed to the effect of dilution, as the runoff water that feeds the river may have had low nitrate anion concentration. The subsequent increase in the concentration may
have occurred because of an ammonium nitriication reaction,
which is thermodynamically favorable in a dissolved oxygen rich environment. Additionally, nitrogen in an aquatic environment is usually found in the form of nitrate. The nitrate increase over time was observed by Tu et al. (2013). They demonstrated that ammonium concentration fell over a two month period, from 6 to 4 mg.L–1. The nitrate increased in the same period, from
3 to 9 mg.L–1, as the water moved through the leaf litter, showing a high nitriication rate.
Additionally, the subsurface low probably lixiviated more nitrates, which previously leached into the soil proile. The nitrate
in FS2 also has its origin with agricultural activities. However, the initial values of nitrate in FS1 are bigger than in FS2. However, in FS2 there is not a statistical difference in the amount of nitrate ion after heavy rainfall; all the other parameters, on both sections, presented statistical differences after the event. Zhang et al. (2013)
showed that gross autotrophic nitriication rates in forest soils
(average of 0.19 mg kg–1 d N–1) in humid subtropical climates were signiicantly lower than the values determined in agricultural
soils (mean 1.81 mg kg–1 d N–1); the opposite situation was found in the luviometric sections studied.
Turbidity was usually null or very low in FS1 before intense rainfall. After the event, there was an important increase in turbidity, which rapidly returned to a value close to the original
after the lood (Figure 7). The turbidity increased in all events,
with statistically signiicant differences in both stations. In the small Teshio river in northern Japan, which has loodplain and
forest characteristics, Aramaki et al. (2010) found an increase of
turbidity during a heavy rain event, from 2,4 - 78,2 NTU. The river low causes the increase in turbulence that
facilitated the release of particles that were on the bottom and side, leaving them in suspension. Additionally, the runoff carried the particles from eroded hillsides of the watershed, increasing the radiation dispersion indices measured by turbidity. Blavet et al. (2009) found only positive trends between runoff and turbidity parameters. Kuhlmann et al. (2014) found that the Ipiranga River, although fully inserted in a protected area, shows a strong correlation between rainfall and runoff, similar to the Concordia river, which also includes forest areas.
The FS2 station presents higher initial values of turbidity than FS1, possibly because of the location, as FS2 receives drainage from the entire watershed that has different land uses, and FS1 has only forested area. Supporting this assumption, Kuhlmann et al. (2014) worked at the head area of the Paraibuna River, located
in the Atlantic Forest, and reported that the turbidity was one of the variables affected by land use.
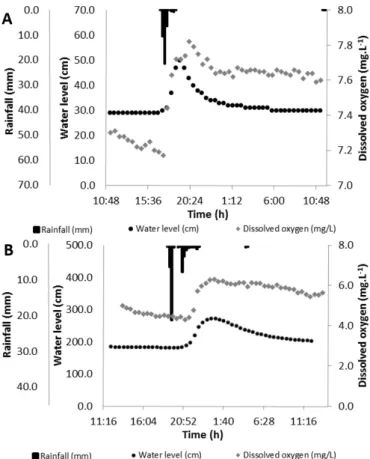
An increase in dissolved oxygen occurred in all events in FS1, with an average of 6.6%, and 7 of 14 events in FS2, with an average increase of 35.0%. This is possibly because of the
turbulence caused by increased river low (Figure 8). Moraetis et al. (2010) detected increased dissolved oxygen during heavy rainfall events in a high-frequency monitoring of a Mediterranean river.
FS2 is located at a lower altitude and receives all of the watershed water. A correlation between the dissolved oxygen and
land use was not identiied. Lee, Choi and An (2012) analyzed the annual and seasonal trends of long-term water chemistry on the
Figure 7. Variation of turbidity in 10 events in FS1.
Figure 6. Nitrate ion concentration in ive and 22 events in FS1
land use patterns and rainfall seasonal Namhan River in Korea
and found that dissolved oxygen values had a poor relationship with the land use patterns of forest and farmland.
The oxygen decrease observed in seven events in FS2 may
be caused by the oxidation of organic matter. In addition to these
phenomena, there is a greater amount of decaying organic matter in FS1, which may have undergone oxidation in water and reduced
the concentration of dissolved oxygen along the streamlow. Chiba de Castro, Cunha-Santino and Bianchini Junior (2013) report that changes in the ecosystem, with the increased availability of nutrients, would reduce the availability of dissolved oxygen. This may explain the low increase in dissolved oxygen in FS2 compared to FS1. However, in both sections, there is a statistical difference in oxygen concentration due to heavy rainfall events.
The pH showed uniform behavior, reducing its value in all heavy rainfall events (Figure 9). In tropical forests, soil acidiication is a pedogenic process driven by proton sources, such as acid
deposition, nitriication, decoupling of carbonaceous, organic acids,
and excessive uptake of cations by vegetation in forest ecosystems (FUJII et al., 2011). Thus, when there is runoff from those soils to the rivers, there may be a reduction in the pH of the water.
The reduction of the pH value followed the rainfall event,
was concurrent with the low, and continued for a longer period.
This behavior may be partially attributed to rainwater, which, due to the presence of CO2 in the air, causes it to have a slightly acidic characteristic. Diniz et al. (2013) analyzed the internal rainfall of a secondary forest in an advanced stage of the Atlantic Forest biome and found a pH of 6.5.
A more pronounced and statistically signiicant variation in
pH was observed in FS1 than FS2. The FS1 is completely covered by Atlantic Forest and the runoff through the leaf litter and soil leaching probably contributed to low pH values (PIAZZA et al., 2014). Miranda, Canellas, and Nascimento (2007) worked with Atlantic Forest fragments and detected pH values of 4.4 in the
0 - 10 cm soil samples proile. Fu et al. (2015) analyzed the changes in the acidity of the soil 27 years after reforestation in a subtropical
area of China. The pH signiicantly decreased (average of 0.95)
after reforestation. Thus, one can explain why FS1, which is a totally forested area, had the most pronounced changes in pH.
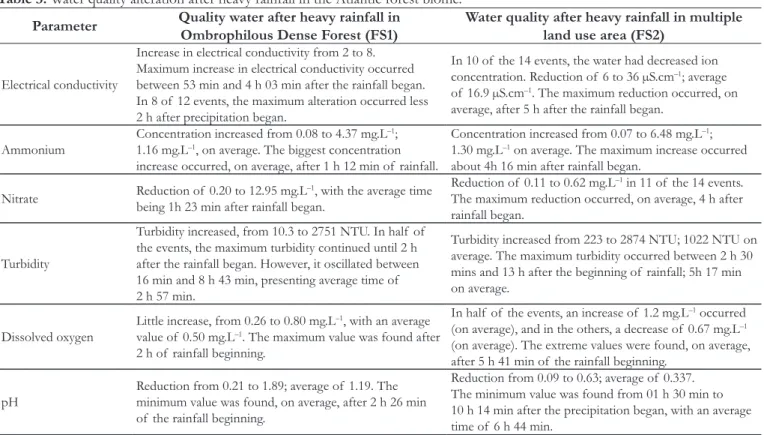
From the responses seen in FS1 and FS2, it is possible to establish the response of other places within the Atlantic forest biome. The expected behaviors for streams, with similar land use, and after heavy rainfall, are the same as described in Table 3.
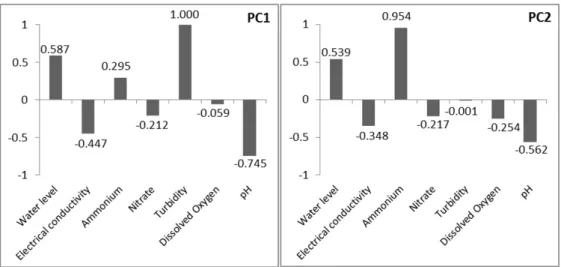
Principal component analysis (PCA) was applied to evaluate the percentage difference that occurred in each parameter for each
event after intense rainfall. In FS1 (Table 4), the irst PCA (PC1)
explains 98.83% of the variability in the data. In FS2 (Table 4),
the irst PCA (PC1) explains 99.77% of data variability.
According to Sousa and Naval (2015), the monitoring variables may be reduced, especially those that are uncorrelated with the main components. The correlation between the principal components, PC1 and PC2 for FS1 and FS2, are shown in Figures 10 and 11, respectively.
As shown in Figure 10, the parameters that inluenced
PC1 in FS1 were turbidity. In FS2 (Figure 11), the parameters that
inluenced PC1 are water level, turbidity, and pH. The parameter
that has a greater relationship with PC2, for both FS1 and FS2,
Figure 8. Oxygen dissolved in eight and 16 events in FS1 (A) and FS2 (B).
RBRH, Porto Alegre, v. 21, n. 4, p. 653-665, out./dez. 2016 661 Girardi et al.
is ammonium. One can relate these parameters to heavy rainfall, since shortly after it occurs, runoff brings decaying organic matter to the river, which over the biogeochemical nitrogen cycle, will release nitrate and ammonium. As reported by Klimaszyk et al. (2015) who investigated the physicochemical properties of the runoff in forests, which occurred within the catchment area of a lake in Poland, found the highest concentrations of ammonium and nitrate in water during heavy rainfall and melting snow. Additionally, Sun et al. (2014) concluded that the degradation of leaf litter in a forest located in the subtropical region of China is probably the main reason for the increase in the concentration of ions on the surface of water.
Figure 10. Correlation between PC1 and PC2 components in FS1.
Table 3. Water quality alteration after heavy rainfall in the Atlantic forest biome.
Parameter Quality water after heavy rainfall in
Ombrophilous Dense Forest (FS1)
Water quality after heavy rainfall in multiple land use area (FS2)
Electrical conductivity
Increase in electrical conductivity from 2 to 8.
Maximum increase in electrical conductivity occurred between 53 min and 4 h 03 min after the rainfall began.
In 8 of 12 events, the maximum alteration occurred less
2 h after precipitation began.
In 10 of the 14 events, the water had decreased ion
concentration. Reduction of 6 to 36 µS.cm–1; average
of 16.9 µS.cm–1. The maximum reduction occurred, on
average, after 5 h after the rainfall began.
Ammonium
Concentration increased from 0.08 to 4.37 mg.L–1;
1.16 mg.L–1, on average. The biggest concentration
increase occurred, on average, after 1 h 12 min of rainfall.
Concentration increased from 0.07 to 6.48 mg.L–1;
1.30 mg.L–1 on average. The maximum increase occurred
about 4h 16 min after rainfall began.
Nitrate Reduction of 0.20 to 12.95 mg.L–1, with the average time
being 1h 23 min after rainfall began.
Reduction of 0.11 to 0.62 mg.L–1 in 11 of the 14 events.
The maximum reduction occurred, on average, 4 h after rainfall began.
Turbidity
Turbidity increased, from 10.3 to 2751 NTU. In half of
the events, the maximum turbidity continued until 2 h after the rainfall began. However, it oscillated between 16 min and 8 h 43 min, presenting average time of 2 h 57 min.
Turbidity increased from 223 to 2874 NTU; 1022 NTU on
average. The maximum turbidity occurred between 2 h 30 mins and 13 h after the beginning of rainfall; 5h 17 min on average.
Dissolved oxygen
Little increase, from 0.26 to 0.80 mg.L–1, with an average
value of 0.50 mg.L–1. The maximum value was found after
2 h of rainfall beginning.
In half of the events, an increase of 1.2 mg.L–1 occurred
(on average), and in the others, a decrease of 0.67 mg.L–1
(on average). The extreme values were found, on average, after 5 h 41 min of the rainfall beginning.
pH
Reduction from 0.21 to 1.89; average of 1.19. The minimum value was found, on average, after 2 h 26 min of the rainfall beginning.
Reduction from 0.09 to 0.63; average of 0.337. The minimum value was found from 01 h 30 min to 10 h 14 min after the precipitation began, with an average time of 6 h 44 min.
Table 4. Principal component analysis of the variables studied in FS1 and FS2.
FS1 FS2
PC %
variance % CMT PC
%
variance % CMT
Analyses of the main components PC1 of FS1 and FS2 show the turbidity parameter. Heavy rainfall is a common cause for increased turbidity and raising the water level, such as FS2. Göransson, Larson and Bendz (2013) found a positive correlation between turbidity and rainfall in periods with heavy rainfall.
The FS2 receives water throughout the watershed, bringing with it litter components resulting from soil erosion into the river. The soil of the region has an acidic pH, reaching 3.96 in the Atlantic Forest area and 4.22 in pasture areas (PIAZZA et al., 2014). The leaf litter material in the low may change the water
pH; explaining PC1in FS2 is related to the pH. In this context,
Guigue et al. (2015) found pH 5.0 in leaf litter in a French forest.
It is also possible that the rainfall that falls in the region may have
slightly acidic pH, contributing in changing the pH of the water. Sun et al. (2014) found that pH from 4.89 - 5.14 in the rainfall of forests in subtropical regions of China.
CONCLUSION
In all studied events, water quality changed due to the occurrence of intense rainfall. Important changes were observed
both in FS1, where the use and occupation of the land is only
Atlantic Forest without an antropic inluence, and in FS2, where
there are different land uses, such as pasture, forestry, Atlantic Forest, and agriculture.
After heavy rainfall, an increase in water level and turbidity
were observed in both luviometric stations. The ammonium and
pH showed similar behavior in the 27 events analyzed. When the ammonium concentration increased, the pH decreased.
The electrical conductivity presented different behavior in each station, demonstrating the relevance of the different
land uses. In 23 of the 27 events, the nitrate concentration was
reduced, and ion concentration later increased. The dissolved oxygen concentration increased in 20 of 27 events.
In FS1, the PC1 explained 98.831% of the variability of
the data, and PC1 of FS2 explained 99.774% of this variability. PC1 correlated with the turbidity in FS1, and water level, turbidity, and pH in FS2.
ACKNOWLEDGEMENTS
The authors thank FAPESC (Terms Grant 17419/2011-0)
and CNPq (process 403739/2013-6 and 303472/2014/6) for inancial support, and CAPES for a grant for a Master’s student.
REFERENCES
ARAMAKI, T.; NAGAO, S.; NAKAMURA, Y.; UCHIDA, M.;
SHIBATA, Y. The effects of rainfall on carbon isotopes of POC in the Teshio River, Northern Japan. Radiocarbon, v. 52, n. 2, p. 808-814, 2010. http://dx.doi.org/10.1017/S0033822200045823.
BERTOL, I.; GOBBI, E.; BARBOSA, F. T.; PAZ-FERREIRO, J.; GEBLER, L.; RAMOS, J. C.; WERNER, R. S. Erosão hídrica
em campo nativo sob diversos manejos: perdas de água e solo e de fósforo, potássio e amônio na água de enxurrada. Revista Brasileira de Ciencia do Solo, v. 35, n. 1, p. 1421-1430, 2011. http:// dx.doi.org/10.1590/S0100-06832011000400036.
BLAVET, D.; NONI, G.; LE BISSONNAIS, Y.; LEONARD, M.;
MAILLO, L.; LAURENT, J. Y.; ASSELINE, J.; LEPRUN, J. C.; ARSHAD, M. A.; ROOSE, E. Effect of land use and management on the early stages of soil water erosion in French Mediterranean vineyards. Soil & Tillage Research, v. 106, n. 1, p. 124-136, 2009.
http://dx.doi.org/10.1016/j.still.2009.04.010.
BOWES, M. J.; JARVIE, H. P.; HALLIDAY, S. J.; SKEFFINGTON, R. A.; WADE, A. J.; LOEWENTHAL, M.; GOZZARD, E.;
NEWMAN, J. R.; PALMER-FELGATE, E. J. Characterizing phosphorus and nitrate inputs to a rural river using high-frequency concentration–flow relationships. The Science of the Total Environment, v. 511, p. 608-620, 2015. http://dx.doi.org/10.1016/j. scitotenv.2014.12.086. PMid:25596349.
BOWES, M. J.; SMITH, J. T.; NEAL, C. The value of high-resolution nutrient monitoring: a case study of the River Frome, Dorset, UK. Journal of Hydrology (Amsterdam), v. 378, n. 1-2, p. 82-96, 2009. http://dx.doi.org/10.1016/j.jhydrol.2009.09.015.
RBRH, Porto Alegre, v. 21, n. 4, p. 653-665, out./dez. 2016 663 Girardi et al.
CASSIDY, R.; JORDAN, P. Limitations of instantaneous water quality sampling in surface-water catchments: comparison with near-continuous phosphorus time-series data. Journal of Hydrology (Amsterdam), v. 405, n. 1-2, p. 182-193, 2011. http://dx.doi.
org/10.1016/j.jhydrol.2011.05.020.
CHAPRA, S. C. Surface water-quality modeling. New York: McGraw-Hill, 1997.
CHEN, Y.; SHUAI, J.; ZHANG, Z.; SHIA, P.; TAO, F. Simulating the impact of watershed management for surface water quality protection: a case study on reducing inorganic nitrogen load at a watershed scale. Ecological Engineering, v. 62, n. 2014, p. 61-70, 2014.
CHIBA DE CASTRO, W.; CUNHA-SANTINO, M. B.; BIANCHINI
JUNIOR, I. Anaerobic decomposition of a native and an exotic
submersed macrophyte in two tropical reservoirs. Brazilian Journal of Biology = Revista Brasileira de Biologia, v. 73, n. 2, p. 299-307, 2013. http://dx.doi.org/10.1590/S1519-69842013000200010.
CHRISTENSEN, V. G. Characterization of surface-water quality based on real-time monitoring and regression analysis, Quivira National Wildlife Refuge, South-Central Kansas, December 1998 through June 2001. Lawrence: U.S. Fish and Wildlife Service, 2001. 28 p.
(Water-Resources Investigations Report 01-4248).
DINIZ, A. R.; PEREIRA, M. G.; BALIEIRO, F. C.; MACHADO, D. L.; MENEZES, C. E. G. Precipitação e aporte de nutrientes em diferentes estádios sucessionais de floresta Atlântica, Pinheiral - RJ. Ciência Florestal, v. 23, n. 3, p. 389-399, 2013. http://dx.doi. org/10.5902/1980509810550.
DONN, M. J.; BARRON, O. V.; BARR, A. D. Identification of phosphorus export from low-runoff yielding areas using combined application of high frequency water quality data and MODHMS modelling. Science of the Total Environment, v. 426, p. 264-271, 2012.
DOWNING, B. D.; BOSS, E.; BERGAMASCHI, B. A.; FLECK, J. A.; LIONBERGER, M. A.; GANJU, N. K.; SCHOELLHAMER, D. H.; FUJII, R. Quantifying fluxes and characterizing compositional changes of dissolved organic matter in aquatic systems in situ using combined acoustic and optical measurements. Limnology and Oceanography, Methods, v. 7, n. 1, p. 119-131, 2009. http://dx.doi. org/10.4319/lom.2009.7.119.
EISALOU, H. K.; SENGÖNÜL, K.; GÖKBULAK, F.;
SERENGIL, Y.; UYGUR, B. Effects of forest canopy cover and floor on chemical quality of water in broad leaved and coniferous
forests of Istanbul, Turkey. Forest Ecology and Management, v. 289, p. 371-377, 2013. http://dx.doi.org/10.1016/j.foreco.2012.10.031.
EPAGRI - EMPRESA DE PESQUISA AGROPECUÁRIA E DE EXTENSÃO RURAL DE SANTA CATARINA. Projeto microbacias 2: relatório síntese: monitoramento socioeconômico. 2005. Disponível em: <http://www.microbacias.sc.gov.br>. Acesso em: 14 ago. 2014.
FU, X.; YANG, F.; WANG, J.; DI, Y.; DAI, X.; ZHANG, X.;
QIANYANZHOU, H. W. Understory vegetation leads to changes in soil acidity and in microbial communities 27years after reforestation. The Science of the Total Environment, v. 502, p. 280-286, 2015. http://
dx.doi.org/10.1016/j.scitotenv.2014.09.018. PMid:25261818.
FUJII, K.; HARTONO, A.; FUNAKAWA, S.; UEMURA, M.;
SUKARTININGSIH; KOSAKI, T. Acidification of tropical forest soils derived from serpentine and sedimentary rocks in East
Kalimantan, Indonesia. Geoderma, v. 160, n. 3-4, p. 311-323, 2011.
http://dx.doi.org/10.1016/j.geoderma.2010.09.027.
GÖRANSSON, G.; LARSON, M.; BENDZ, D. Variation in turbidity with precipitation and flow in a regulated river system-river Göta Älv, SW Sweden. Hydrology and Earth System Sciences, v. 17, n. 7, p. 2529-2542, 2013. http://dx.doi.org/10.5194/hess-17-2529-2013.
GUIGUE, J.; LÉVÊQUE, J.; MATHIEU, O.; SCHMITT-KOPPLIN, P.; LUCIO, M.; ARROUAYS, D.; JOLIVETC; DEQUIEDT, S.; PRÉVOST-BOURÉ, N. C.; RANJARD, L. Water-extractable organic matter linked to soil physico-chemistry and microbiology at the regional scale. Soil Biology and Biochemistry, v. 84, p. 158-167, 2015.
HALLIDAY, S. J.; SKEFFINGTON, R. A.; BOWES, M. J.;
GOZZARD, E.; NEWMAN, J. R.; LOEWENTHAL, M.; PALMER-FELGATE, E. J.; JARVIE, H. P.; WADE, A. J. The water quality of the River Enborne, UK: observations from high-frequency monitoring in a rural, Lowland River System. Water (Basel), v. 6, n. 1, p. 150-180, 2014. http://dx.doi.org/10.3390/w6010150.
HALLIDAY, S. J.; WADE, A. J.; SKEFFINGTON, R. A.; NEAL, C.; REYNOLDS, B.; ROWLAND, P.; NEAL, M.; NORRIS, D. An analysis of long-term trends, seasonality and short-term dynamics in water quality data from Plynlimon, Wales. The Science of the Total Environment, v. 434, p. 186-200, 2012. http://dx.doi.
org/10.1016/j.scitotenv.2011.10.052. PMid:22119034.
JORDAN, P.; ARNSCHEIDT, A.; GROGAN, H.; MCCORMICK, S. Characterising phosporus transfers in rural catchments using a continuous bank-side analyser. Hydrology and Earth System Sciences, v. 11, n. 1, p. 372-381, 2007. http://dx.doi.org/10.5194/hess-11-372-2007.
KIRCHNER, J. W.; FENG, X. H.; NEAL, C.; ROBSON, A. J. The fine structure of water-quality dynamics: the (high-frequency) wave of the future. Hydrological Processes, v. 18, n. 7, p. 1353-1359, 2004. http://dx.doi.org/10.1002/hyp.5537.
KLIMASZYK, P.; RZYMSKI, P.; PIOTROWICZ, R.; JONIAK, T. Contribution of surface runoff from forested areas to the chemistry of a through-flow lake. Environmental Earth Sciences, v. 73, n. 8, p. 3963-3973, 2015. http://dx.doi.org/10.1007/s12665-014-3682-y.
LEE, J.; CHOI, J.; AN, K.-G. Influence of landuse pattern and seasonal precipitation on the long-term physico-chemical water
quality in Namhan River Watershed. Journal of Environmental Sciences (China), v. 21, n. 9, p. 1115-1130, 2012. http://dx.doi.org/10.5322/ JES.2012.21.9.1115.
LINGNER, D. V.; SEVEGNANI, L.; GASPER, A. L.; UHLMANN, A.; VIBRANS, A. C. Grupos florísticos estruturais da Floresta
Ombrófila Densa em Santa Catarina. In: VIBRANS, A. C.; SEVEGANI, L.; GASPER, A. L.; LINGNER, D. V. Inventário florístico florestal de Santa Catarina: floresta ombrófila densa. Blumenau: Edifurb, 2013. vol. 4, p. 141-155.
MAKINECI, E.; DEMIR, M.; KARTALOGLU, M. Acidity (pH) and electrical conductivity changes in runoff water from ditches of paved and unpaved forest roads. Baltic forestry, v. 21, n. 1 (40), p. 170-175, 2015.
MALCOLM, I. A.; SOULSBY, C.; YOUNGSON, A. F. High-frequency logging technologies reveal statedependent hyporheic process dynamics: implications for hydroecological studies. Hydrological Processes, v. 20, n. 3, p. 615-622, 2006. http://dx.doi. org/10.1002/hyp.6107.
MIRANDA, C. C.; CANELLAS, L. P.; NASCIMENTO, M. T.
Caracterização da matéria orgânica do solo em fragmentos de
mata atlântica e em plantios abandonados de eucalipto. Revista Brasileira de Ciencia do Solo, v. 31, n. 1, p. 905-916, 2007. http:// dx.doi.org/10.1590/S0100-06832007000500008.
MONTEIRO, M. T. F.; OLIVEIRA, S. M.; LUIZÃO, F. J.;
CÂNDIDO, L. A.; ISHIDA, F. Y.; TOMASELLA, J. Dissolved organic carbon concentration and its relationship to electrical conductivity in the waters of a stream in a forested Amazonian blackwater catchment. Plant Ecology & Diversity. Special Issue: Ecosystem Dynamics of Amazonian and Andean Forests, v. 7, n. 1-2, p. 205-213, 2014.
MORAETIS, D.; EFSTATHIOU, D.; STAMATI, F.; TZORAKI, O.; NIKOLAIDIS, N. O.; SCHNOOR, J. L.; VOZINAKIS, K. High-frequency monitoring for the identification of hydrological and bio-geochemical processes in a Mediterranean river basin. Journal of Hydrology, v. 389, n. 1-2, p. 127-136, 2010.
NEAL, C.; REYNOLDS, B.; KIRCHNER, J. W.; ROWLAND, P.;
NORRIS, D.; SLEEP, D.; LAWLOR, A.; WOODS, C.; THACKER, S.; GUYATT, H.; VINCENT, C.; LEHTO, K.; GRANT, S.;
WILLIAMS, J.; NEAL, M.; WICKHAM, H.; HARMAN, S.;
ARMSTRONG, L. High-frequency precipitation and stream water quality time series from Plynlimon, Wales: an openly accessible data resource spanning the periodic table. Hydrological Processes, v. 27, n. 17, p. 2531-2539, 2013. http://dx.doi.org/10.1002/hyp.9814.
NEAL, C.; REYNOLDS, B.; ROWLAND, P.; NORRIS, D.;
KIRCHNER, J. W.; NEAL, M.; SLEEP, D.; LAWLOR, A.; WOODS, C.; THACKER, S.; GUYATT, H.; VINCENT, C.; HOCKENHULL, K.; WICKHAM, H.; HARMAN, S.; ARMSTRONG, L. High-frequency water quality time series in precipitation and streamflow:
from fragmentary signals to scientific challenge. The Science of the Total Environment, v. 434, p. 3-12, 2012. http://dx.doi.org/10.1016/j. scitotenv.2011.10.072. PMid:22245159.
NIMICK, D. A.; GAMMONS, C. H.; PARKER, S. R. Diel biogeochemical processes and their effect on the aqueous chemistry of streams: a review. Chemical Geology, v. 283, n. 1-2, p. 3-17, 2011.
http://dx.doi.org/10.1016/j.chemgeo.2010.08.017.
PENNA, D.; VAN MEERVELD, H. J.; OLIVIERO, O.; ZUECCO, G.; ASSENDELFT, R. S.; DALLA FONTANA, G.; BORGA, M. Seasonal changes in runoff generation in a small forested mountain catchment. Hydrological Processes, v. 29, n. 8, p. 2027-2042, 2015. http://dx.doi.org/10.1002/hyp.10347.
PIAZZA, G. A.; DEPINÉ, H.; KAUFMANN, V.; PINHEIRO, A.; GONÇALVES JUNIOR, A. C.; OLIVEIRA, M. H. C. Spatial distribution of soil attributes in the Concórdia River watershed in Southern Brazil. Environmental Quality Management, v. 24, n. 2, p. 1-12, 2014. http://dx.doi.org/10.1002/tqem.21385.
PRIEN, R. D. The future of chemical in situ sensors. Marine Chemistry, v. 107, n. 3, p. 422-432, 2007. http://dx.doi.org/10.1016/j. marchem.2007.01.014.
ROBSON, A. J.; NEAL, C.; HILL, S.; SMITH, C. J. Linking variations in short- and medium-term stream chemistry to rainfall inputs: some observations at Plynlimon, Mid-Wales. Journal of Hydrology (Amsterdam), v. 144, n. 1-4, p. 291-310, 1993. http:// dx.doi.org/10.1016/0022-1694(93)90177-B.
ROBSON, A. J.; NEAL, C.; SMITH, C. J.; HILL, S. Short-term variations in rain and stream water conductivity at a forested site in mid-Wales implications for water movement. Science of the Total Environment, v. 119, p. 1-18, 1992.
RÜCKER, K.; SCHRAUTZER, J. Nutrient retention function of a stream wetland complex: a high-frequency monitoring approach. Ecological Engineering, v. 36, n. 5, p. 612-622, 2010. http://dx.doi.
org/10.1016/j.ecoleng.2008.12.035.
SALIMON, C.; SOUSA, E. S.; ALIN, S. R.; KRUSCHE, A. V.; BALLESTER, M. V. Seasonal variation in dissolved carbon concentrations and fluxes in the upper Purus River, southwestern Amazon. Biogeochemistry, v. 114, n. 1-3, p. 245-254, 2013. http:// dx.doi.org/10.1007/s10533-012-9806-0.
SANDFORD, R. C.; EXENBERGER, A.; WORSFOLD, P. J.
Nitrogen cycling in natural waters using in situ, reagentless UV
spectrophotometry with simultaneous determination of nitrate and nitrite. Environmental Science & Technology, v. 41, n. 21, p. 8420-8425, 2007. http://dx.doi.org/10.1021/es071447b. PMid:18200873.
RBRH, Porto Alegre, v. 21, n. 4, p. 653-665, out./dez. 2016 665 Girardi et al.
SCHOLEFIELD, D.; LE GOFF, T.; BRAVEN, J.; EBDON, L.;
LONG, T.; BUTLER, M. Concerted diurnal patterns in riverine nutrient concentrations and physical conditions. Science of the Total Environment, v. 344, p. 201-210, 2005.
SOUSA, J. S.; NAVAL, L. P. Auxílio ao estabelecimento de parâmetros de referência para o monitoramento da qualidade de sistemas aquáticos contribuintes da bacia Tocantins-Araguaia. Revista Brasileira de Recursos Hídricos, v. 20, n. 1, p. 60-72, 2015. http://dx.doi.org/10.21168/rbrh.v20n1.p60-72.
SUN, T.; MA, M.; WANG, D. Y.; HUANG, L. X. Dynamics of nitrogen and sulfur wet deposition in typical forest stand at different spatial levels in Simian Mountain, mid-subtropical region. Chinese Journal of Environmental Science, v. 35, n. 12, p. 4475-4481, 2014. PMid:25826915.
TERCIER-WAEBER, M.; HEZARD, T.; MASSON, M.; SCHÄFER,
J. In situ monitoring of the diurnal cycling of dynamic metal species
in a stream under contrasting photobenthic biofilm activity and hydrological conditions. Environmental Science & Technology, v. 43, n. 19, p. 7237-7244, 2009. http://dx.doi.org/10.1021/es900247y. PMid:19848128.
TU, L.; HU, T. X.; ZHANG, J.; HUANG, L.; XIAO, Y.; CHEN, G.; HU, H.; LIU, L.; ZHENG, J.; XU, Z.; CHEN, L. Nitrogen Distribution and cycling through water flows in a subtropical bamboo forest under high level of atmospheric deposition. PLoS One, v. 8, n. 10, p. 2-12, 2013. http://dx.doi.org/10.1371/journal. pone.0075862. PMid:24146784.
WADE, A. J.; PALMER-FELGATE, E. J.; HALLIDAY, S. J.;
SKEFFINGTON, R. A.; LOEWENTHAL, M.; JARVIE, H. P.;
BOWES, M. J.; GREENWAY, G. M.; HASWELL, S. J.; BELL,
I. M.; JOLY, E.; FALLATAH, A.; NEAL, C.; WILLIAMS, R. J.;
GOZZARD, E.; NEWMAN, J. R. Hydrochemical processes in lowland rivers: insights from in situ, high-resolution monitoring. Hydrology and Earth System Sciences, v. 16, n. 11, p. 4323-4342, 2012. http://dx.doi.org/10.5194/hess-16-4323-2012.
ZHANG, J.; ZHU, T.; MENG, T.; ZHANG, Y.; YANG, J.; YANG, W.; MÜLLER, C.; CAI, Z. Agricultural land use affects nitrate production and conservation in humid subtropical soils in China. Soil Biology & Biochemistry, v. 62, p. 107-114, 2013. http://dx.doi.
org/10.1016/j.soilbio.2013.03.006.
Authors contributions
Rubia Girardi: Responsible for development of theoretical work, methodological, data processing, analysis and results discussion.
Adilson Pinheiro: Advisor professor who supervised the research and suggested improvements in the paper structure, writing and results.
Edson Torres: Collaborations in collecting ield data and data
processing.
Vander Kaufmann: Implantation and support of multiparameter
probe and rain gauge.