ISSN 1546-9239
© 2012 Science Publications
Corresponding Author:Alamelumangai, N., Department of MCA, Karpagam College of Engineering, Coimbatore, India 779
Novel Fuzzy Technique for Cancer
Detection in Noisy Breast Ultrasound Images
1
Alamelumangai, N. and
2J. DeviShree
1Department of MCA, Karpagam College of Engineering, Coimbatore, India
2Department of EEE, Coimbatore Institute of Technology, Coimbatore, India
Abstract: Problem statement: Detecting tumor areas in breast Ultrasound (US) images is a
challenging task. The occurrence of benign areas in breast may result in false identification of malignant areas which may have serious outcome. Approach: The CAD system could act as a major function in the early detection of breast cancer and could decrease the death rate among women with breast cancer. This challenge was especially daunting in non homogenous noisy US Images where benign and malignant images were difficult to identify. The US images possess speckle noise which was its inherent property. This study was an attempt to reduce false alarm in Breast cancer detection using computationally efficient fuzzy based image clustering. Results: The proposed system was tested using images which was obtained from the famous American Cancer database for conducting experiments. We had compared the Noise Induced images with that of the De-speckled images and found that the de-speckled images yeild a better image for diagnosis based. Later the image was clustered based on Fuzzy C-Means based clustering technique to identify the cancerous cells. Conclusion: An efficient method is suggested in this study which assist in diagnosing the cancer cells. The Fuzzy C-Means clustering system identifies various important artifacts, such as cyst, tumor and micro calcifications. The challenge in this system is the speckle noise. It can be extended to FCM class 2 non-homogeneous images.
Key words: Cancer detection, speckle noise, fuzzy logic, ultrasound images, imaging techniques,
image quality, pattern recognition
INTRODUCTION
Fuzzy logic is one of the powerful soft computing tools to overcome ambiguity in the ultrasound image data (Sree et al., 2011). These imperfections could possibly relate with image during image capture or while transmission phase. Presence of speckle noise is one of the major imperfections linked with the US image and it may hamper the performance of CAD diagnostic tools. Fuzzy based image segmentation could be used to identify important pattern in noisy breast US images. It can be categorized into following classes: fuzzy clustering, fuzzy rule, fuzzy geometry, fuzzy thresholding and fuzzy integral based clustering techniques.
In this study we have performed image clustering using Repulsive Fuzzy C-means (FCM) algorithm (Li and Liu, 2007) in Ultrasound images which have the property of speckle noise. The motivation of this study is to devise a better diagnostic imaging for breast cancer detection.
The study outline is as follows a brief discussion of breast imaging techniques and their limitations is presented. Later, classification of region of interest in breast imaging is presented. Image quality matrices are explained next. Following which, Fuzzy C-Means based clustering technique is presented. The methodology used for US image clustering is discussed later. Finally, the experiments and results following which the study is concluded with future implementations.
Imaging techniques and their limitations: In recent
780 • Magnetic Resonance (MR) Imaging-Magnetic
Resonance Imaging (MRI) is non-invasive imaging method. It is widely used for medical imaging including breast screening. It is depends both on Radio Frequency (RF) and Magnetic Fields (MF). The RF pulses influence the arrangement of the resonant nuclei and thereby produce a detectable signal (Murugavalli and Rajamani, 2007)
• Mammogram-A mammogram is a special type of non-invasive X-ray to examine human breast. This technique involved exposing breast to a small dose of ionizing radiation to produce details of the image. Mammograms can help detect possible tumors long before they could become serious problem
• Ultrasound (US) imaging-Ultrasound is also a non-invasive imaging technique based on sound waves. It is used to provide details of breast that doctor still has questions after mammograms. The ultrasound image may be useful if a lump contain solid or fluid. When compared with mammograms this method produce sharp and high contrast patterns of possible micro calcifications. An inherent property of US is speckle noise which could be of possible hindrance for diagnosis
Classification of Region Of Interest (ROI):
• Classification Of Cyst or Solid Mass-A cyst is a sac which is filled with fluid. When it is as fluid it is considered harmless but if it is a solid mass it becomes cancer. The features of the solid mass could provide essential clues about tumor
• Classification of Calcifications-Basically there are two types of calcifications. Macro-calcifications are large calcium deposits present in the breast tissues. They are considered harmless and often caused be aging process. Micro-calcifications are the tiny calcium specks in the breast tissues. It is very difficult to detect micro-calcification and often is undetected. The form of calcification is an important factor differentiation between benign and malignant • Classification of Tumors-A tumor is an abnormal
growth of body tissue. Tumors can be cancerous (malignant) or noncancerous (benign). They could grow in an uncontrolled manner and may invade surrounding tissues. In ultrasound it appears as solid mass with irregular and unclear edges
Image quality metrices: Image quality is a
characteristic of an image that measures the perceived image degradation (typically, compared to an ideal or perfect image) (Gonzalez and Woods, 2002). US imaging systems may introduce some amounts of
speckle noise or artifacts in the signal, so the quality assessment is an important factor. Therefore, matrix based image quality assessments method MSE and PSNR are used to assess the image quality.
Mean Square Error (MSE)-Mean Square Error is a metric to measure the distortion brought by the de-noising process in the images. It assesses the quality of a signal in terms of its variation and its un-baseness. Since MSE is an expectation, it is not a random variable. It is defined by the mean square distance between the pixels of the original image Aij and the pixels in the reconstructed image Bij. It is given as Eq. 1:
(
)
2y
x ij ij
i 1 j 1
A B
MSE
x y
= =
− =
×
∑∑
(1)Peak Signal to Noise Ratio (PSNR)-Peak Signal to Noise Ratio is the ratio between the maximum possible power of the signal and the power of the corrupting noise that affects the fidelity of the representation. PSNR is used to analyze the quality of the two images-original and reconstructed images after the de-noising process. The smaller the value of MSE the larger the PSNR which means the reconstructed image is the proximity to the original image. Mathematically PSNR is represented as Eq. 2:
2 255 PSNR 10log
MSE
= ×
(2)
Fuzzy C-Means (FCM) based clustering technique:
The Fuzzy Filters are non-liner filters used to preserve the details in an image. Fuzzy Filters was proposed (Li and Liu, 2007) and refined (Rashid et al., 2011; Cannon et al., 1986) and others. They use fuzzy logic model, which characterize the image as a fuzzy set of the fuzzy theory which is related to the rules of fuzzy inference model. The fuzzy inference model is composed of a group of logic connectors and IF-THEN fuzzy conditional statements. The outputs of the filters depend on the defuzzifying process, which i s a combination of the effects of the established rules (Zhang et al., 2006).
781 the mean of all points, weighted by their degree of belonging to the cluster Eq. 3:
( )
( )
k x k
k x w x x C
w x
=
∑
∑
(3)The degree of belonging, wk (x), is related inversely to the distance from x to the cluster center as calculated on the previous pass. It also depends on a parameter m that controls how much weight is given to the closest centre.
MATERIALS AND METHODS
The proposed methodology describes fuzzy clustering of breast malignant areas in noisy US images with the following steps:
• First we synthesis breast image by inducing speckle noise across the breast image (Shi et al., 2010) • To maintain the consistency among different
images Mean Square Error (MSE) and Peak Signal to Noise Ratio (PSNR) is used as metrics.
• Repulsive C-Means Fuzzy clustering (Cannon et al., 1986; Shanmugam et al., 2011) is performed on the images obtained in step i of this algorithm • Memetic based ANFIS techniques used to de-noise
the images (Alamelumangai and DeviShree, 2011). Repulsive C-Means Fuzzy clustering is again performed on these images obtain after step iv. • Compare with original image (Shanmugam et al.,
2011) the results are as in Figure 4 which show a significant improvement in clustering process Compare with the original image the noise induced image as in Fig. 3, 4 to indentify the tumor cells.
RESULTS AND DISCUSSION
The experiment is simulated using Matlab7.5 (The Mathworks Inc) and the performance of the proposed method is evaluated using 255×255 grayscale images (Image Source) with prominent malignant areas. T h e R e g i o n O f Interest (ROI) is the tumor. The effect of increasing noise level on the quality of the image is shown in Table 1. MSE is the mean square error between the original and noisy image and original and de-noised image. The improvement in PSNR in the experiments is shown in Table 2. It is inversely related with the MSE. PSNR is the peak signal to noise ratio between the original and noisy image and the original and de- noised image.
Figure 1b demonstrates suppression of homogenous noise at σ = 0.015. Figure 1c shows the
Affect of Noise Reduction using Evolutionary ANFIS technique as the presence of speckle noise can hinder the detection of malignant areas.
Figure 2b shows the image clustering using Standard Fuzzy C-Means Clustering applied on Original image. In Fig. 2c shows how standard FCM can be used for finding the Region Of Interest (ROI).
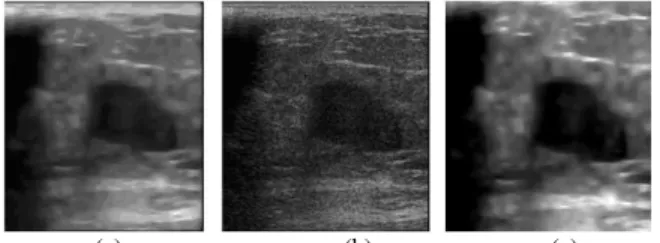
Figure 3 shows the image clustering using Repulsive Fuzzy C-Means Clustering (Li and Liu, 2007; Cannon et al., 1986) applied on image corrupted with homogenous noise at σ = 0.015. Results show that the presence of noise affects the clustering process in terms of image quality and the efficiency.
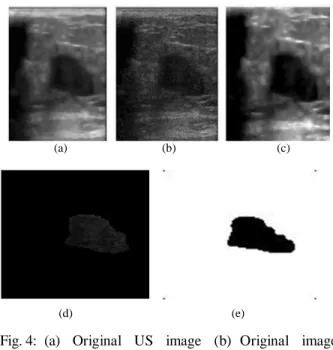
The effects of non-homogenous noise are shown in Fig. 4. Original image corrupted with speckle noise at σ = 0.015, 0.020 and 0.025. The presence of speckle adversely affects the detection of artifacts. The proposed method is applied on the image corrupted with noise as shown in Fig. 4.
FCM analysis on various images is shown in Table 3. This analysis broadly divides into three categories: FCM applied on original image, FCM applied on noise induced image and Repulsive FCM applied on de-noised image. FCM analysis is performed by calculation of cluster centers and t h e n t h e assignment of members to these centers using the Euclidian distance.
(a) (b) (c)
Fig. 1: (a) Original US Image (b) Original image corrupted with (c) De-noised image using Proposed
(a) (b) (c)
782
(a) (b) (c)
Fig. 3: (a) Original US image (b) Original image corrupted with noise at σ = 0.015 (c) Standard FCM with for classification (d) ROI detection
(a) (b) (c)
(d) (e)
Fig. 4: (a) Original US image (b) Original image corrupted with noise at σ = 0.015 (c) De-noised image using Proposed Method (d) Repulsive FCM with for classification (e) ROI detection Table 1: Standard Deviations (STD) in terms of Mean Square Error (MSE)
MSE MSE
σ (Standard (Original and (Original and
Deviation) Noisy Image) De-Noised Image)
0.010 0.5100 0.4854
0.015 0.4819 0.4623
0.020 0.4726 0.4452
0.025 0.4999 0.4926
0.030 0.4996 0.5014
Table 2: Standard Deviations (STD) in terms of Peak Signal to Noise Ratio (PNSR)
PSNR PSNR
σ (Standard (Original and (Original and
Deviation) Noisy Image) De-Noised Image)
0.010 51.0551 51.2698
0.015 51.3012 51.4816
0.020 51.3859 51.6453
0.025 51.1420 51.2059
0.030 51.1446 51.1290
Table 3: Clustering results
Repulsive FCM Repulsive
US Repulsive for speckle FCM for
Image data FCM noise induced image de-noised image
Image 1 905.6 1417.2 1241.8
Image 2 704.7 1217.7 1190.6
Image 3 961.4 1474.6 1267.4
Image 4 504.8 1017.2 1186.2
Image 5 891.1 1402.2 1207.0
It is an iterative process and stabilized after certain computations. In the above experiment the iterations stabilize at 15. The execution time is proportionate with the number of clusters. Since we have only one cluster the time taken is 1.005 sec.
In Table 3 the clustering results using Repulsive FCM, the impact of speckle noise on the performance of FCM algorithm is shown and the proposed de-noising technique incorporated into the Repulsive FCM algorithm shows a significant improvement in the clustering of the image.
CONCLUSION
Fuzzy image processing has widely been used in the context of image segmentation and noise reduction. In this study Repulsive FCM ( Li and Liu, 2007; Cannon et al., 1986) Algorithm has been tested on noisy breast US image. Results showed that our technique effectively clusters the breast malignant areas, which could take more computations by conventional clustering methods. The clustering system identifies various important artifacts, such as cyst, tumor and micro calcifications. Patient clinical history together with better detection mechanisms could be beneficial for early diagnosis. Based on our study we have found number of areas for future research including detecting of tiny micro calcification. In future, we can extend FCM class 2 for non- homogenous noisy image to increase the computational complexity and when applied to de-noised image complexity is expected to decrease. Other potential area could be the classification of tumor based on the sharpness of the contours of artifacts.
REFERENCES
Alamelumangai, N. and J. DeviShree, 2011. An ultrasound image preprocessing system using memetic ANFIS method. Proceedings of the 2010 International Conference on Biology, Environment and Chemistry, (ICBEC’ 11), IACSIT Press, Singapore, pp: 214-217.
Cannon, R.L., J.V. Dave and J.C. Bezdek, 1986. Efficient implementation of the fuzzy c-means clustering algorithms. IEEE Trans. Patt. Anal. Mach.
Intell. 8: 248-255. DOI:
783 Gonzalez, R.C. and R.E. Woods, 2002. Digital Image
Processing, 2nd Edn., Prentice Hall, ISBN-10: 0201180758, pp: 793.
Li, X and D.C. Liu, 2007. Ultrasound image enhancement using dynamic filtering. Proceedings of the 4th International Conference on Image and Graphics, Aug. 22-24, IEEE Xplore Press, Sichuan, pp: 106-109. DOI: 10.1109/ICIG.2007.43
Murugavalli, S and V. Rajamani, 2007. An improved implementation of brain tumor detection using segmentation based on neuro fuzzy technique. J. Comput. Sci., 3: 841-846. DOI: 10.3844/jcssp.2007.841.846
Rashid, H., A. Sikander and A.R. Memon, 2011. Fuzzy clustering based malignant areas detection in noisy breast Magnetic Resonant (MR) Images. J. Acad. Res.
Shanmugam, N.,A.B. Suryanarayana, S. TSB, D. Chandr ashekar and C. N. Manjunath, 2011. A novel approach to medical image segmentation. J. Comput. Sci., 7: 657-663. DOI: 10.3844/jcssp.2011.657.663
Shi, X., H.D. Cheng, L. Hu, W. Ju and J. Tian, 2010. Detection and classification of masses in breast ultrasound images. Digital Signal Process., 20: 824-836. DOI: 10.1016/j.dsp.2009.10.010
Sree, N.V.S., R. Lakshmi and C. Manoharan, 2011. Wavelet analysis and orthogonal moments based classification of microcalcification in digital mammograms. J. Comput. Sci., 7: 1541-1544. DOI: 10.3844/jcssp.2011.1541.1544