Optimized Fuzzy Logic Based Segmentation for
Abnormal MRI Brain Images Analysis
Indah Soesanti1, Adhi Susanto2, Thomas Sri Widodo2 and Maesadji Tjokronagoro3
1
Department of Electrical Engineering and Information Technology, Gadjah Mada University, Yogyakarta, Indonesia
2
Department of Electrical Engineering and Information Technology, Gadjah Mada University, Yogyakarta, Indonesia
3
Faculty of Medicine, Gadjah Mada University, Yogyakarta, Indonesia
Abstract
In this paper an optimized fuzzy logic based segmentation for abnormal MRI brain images analysis is presented. A conventional fuzzy c-means (FCM) technique does not use the spatial information in the image. In this research, we use a FCM algorithm that incorporates spatial information into the membership function for clustering. The FCM algorithm that incorporates spatial information into the membership function is used for clustering, while a conventional FCM algorithm does not fully utilize the spatial information in the image.The advantage of the technique is less sensitive to noise than the others. Originality of this research is focused in application of the technique on a normal and a glioma MRI brain images, and analysis of the area of abnormal mass from segmented images. The results show that the method effectively segmented MRI brain images, and the segmented normal and glioma MRI brain images can be analyzed for diagnosis purpose. The area of abnormal mass is identified from 7.15 to 19.41 cm2.
Keywords: Adaptive image segmentation, FCM clustering, abnormal MRI brain image, fuzzy membership function.
1. Introduction
Image segmentation is one of the most important step to extract information in image processing. Segmentation has wide application in medicine area. The main objective of segmentation of medical image is to partition the image into mutually exclusive and exhausted regions such that each region of interest is spatially contiguous and the pixels within the region are homogeneous with respect to a predefined criterion. Magnetic Resonance Imaging (MRI) is the state-of-the-art medical imaging technology which allows cross sectional view of the body with unprecedented tissue contrast. MRI provides a digital representation of tissue characteristic that can be obtained in any tissue plane. The images produced by an MRI scanner are best described as slices through the brain. MRI has the added advantage of being able to produce images
which slice through the brain in both horizontal and vertical planes. The objective of segmenting different types of soft-tissue in MRI brain images is to label complex structures with complicated shapes, as white matter, grey matter, CSF and other types of tissues in neurological conditions.
A variety of segmentation methods have been developed to satisfy increasing requirement of image segmentation over past several years. FCM (Fuzzy c-means) is unsupervised technique that has been successfully applied to future analysis, clustering, and classifier designs in the fields such as astronomy, geology, medical imaging, target recognition, and image segmentation. An image can be represented in various feature spaces, and the FCM method classifies the image by grouping similar data points in the feature space into clusters.
artifact that occurs in nearly all MRI [7]-[8]. Originality of this research is the method applied on a normal MRI brain image and a glioma MRI brain images, and analyze the area of abnormal mass from segmented images.
2. Fundamental Theory
2.1 Magnetic Resonance Imaging
Magnetic Resonance Imaging (MRI) is an imaging used primarily in medical settings to produce high quality medical images of the soft tissues. MRI is an imaging technique used primarily in medical settings to produce high quality images of the inside of the human body. In this section we give a brief description of the principles of MRI which are refered to [9]. In MRI, the image is a map of the local transverse magnetization of the hydrogen nuclei. This transverse magnetization in turn depends on several intrinsic properties of the tissue. MRI is based on the principles of nuclear magnetic resonance (NMR). The NMR phenomenon relies on the fundamental property that protons and neutrons that make up a nucleus possess an intrinsic angular momentum called spin. When protons and neutrons combine to form nucleus, they combine with oppositely oriented spins. Thus, nuclei with an even number of protons and neutrons have no net spin, whereas nuclei with an odd number of protons or neutrons possess a net spin. Hydrogen nuclei have an NMR signal since its nucleus is made up of only a single proton and possess a net spin. The human body is primarily fat and water, which have many hydrogen atoms. Medical MRI primarily images the NMR signal from the hydrogen nuclei in the body tissues.
The net spin of the nucleus around its axis gives it an angular moment. Since the proton is a positive charge, a current loop perpendicular to the rotation axis is also created, and as a result the proton generates a magnetic field. The joint effect of the angular moment and the self generated magnetic field gives the proton a magnetic dipole moment parallel to the rotation axis. Under normal condition, one will not experience any net magnetic field from the volume since the magnetic dipole moments are oriented randomly and on average equalize one another.
When placed in a magnetic field, a proton with its magnetic dipole moment processes around the field axis. The frequency of this precession, v0, is the resonant frequency of NMR and is called the Larmor frequency. The precession frequency is directly proportional to the strength of the magnetic field, i.e.
v0 = gB0 (1)
where B0 is the main magnetic field strength, and g is a constant called gyromagnetic ratio which is different for each nucleus (42.56 MHz/Tesla for protons).
Given a specimen, the application of a magnetic field B0 would create a net equilibrium magnetization M0 per cubic centimeter, which is aligned to the B0 field. The M0 is the net result of summing up the magnetic fields due to each of the H nuclei and is directly proportional to the local proton density (or spin density). However, M0 is many orders of magnitude weaker than B0 and is not directly observable. By tipping M0 away from the B0 field axis with an appropriate RF pulse having a frequency equals to the Larmor frequency, a longitudinal magnetization component ML and a transverse magnetization component
MT is produced. When the RF pulse is turned off, the longitudinal magnetization component ML recovers to M0 with a relaxation time T1, and the transverse magnetization component MT dephases and decays to zero with a relaxation time T2 1. During relaxation, the protons lose energy by emitting their own RF signal with the amplitude proportional to MT. which is referred to as the
free-induction decay (FID) response signal. T2 indicates the time constant required from a given tissue type to decay for the FID response signal. The FID response signal is measured by an RF coil placed around the object being imaged.
In MR imaging, the RF pulse is repeated at a predetermined rate. The repetition time, TR, is the period of the RF pulse sequence is. The FID response signals can be observed at various times within the TR interval. echo delay time, TE is the time between which the RF pulse is applied and the response signal is measured. The TE is the time when the spin echo occurs due to the refocusing effects of the 180 degree refocusing pulse applied after a delay of TE/2 from the RF pulse. The TR and TE control how strongly the local tissue relaxation times, T1 and T2, affect the signal. By adjusting TR and TE the acquired MR image can be made to contrast different tissue types.
2.2 Image Segmentation
network classifier which showed the superiority of the neural network.
Some new methods of image segmentation that could be classified as statistical methods have been introduced in the past few years. Hansen [16] used a probabilistic supervised relaxation technique for segmenting 3D medical images. The method introduced the use of cues to guide the medical image segmentation. Those cues marked by the user have the mean and standard deviation as description parameters. (3) The neural networks methods one example of which is the work of Ahmed et al. [14] who used a two stages neural network system for CT/MRI image segmentation. The first stage is a self-organized principal component analysis (SOPCA) network and the second stage consists of a self-organizing feature map (SOFM). The results obtained compare favorably with the classical and statistical methods. (4) The Fuzzy Clustering methods. In [18] a comparison between the fuzzy logic and artificial neural network techniques in segmenting magnetic resonance images debated for the need of unsupervised technique in segmentation which was provided using the unsupervised fuzzy c-mean algorithm.
3. Fuzzy C-Means Clustering
The FCM method assigns pixels to each cluster by using fuzzy membership functions. Let X=(x1, x2,.,xN) denotes an image with N pixels to be partitioned into c clusters, where xi represents multispectral (features) data. The algorithm is an iterative optimization that minimizes the cost function defined as follows [16]:
2 1 1
||
||
j iN
j c
i m
ij
x
v
u
J
(2)
where uij represents the membership function of pixel xj in the ith cluster, vi is the ith cluster center, and m is a constant. The parameter m controls the fuzziness of the resulting partition, and m = 2 is used in this study.
The cost function is minimized when pixel close to the centroid of their clusters are assigned high membership values, and low membership values are assigned to pixels with data far from the centroid. The fuzzy membership function represents the probability that a pixel belongs to a specific class. In the FCM algorithm, the probability is dependent solely on the distance between the pixel and each individual cluster center in the feature domain. The membership functions and cluster centers are updated by the following:
c k m k j i j ijv
x
v
x
u
1 ) 1 /( 2||
||
||
||
1
(3) and
N j m ij N j j m ij iu
x
u
v
1 1 (4)where uij [0, 1].
Starting with an initial guess for each cluster center, the FCM converges to a solution for vi representing the local minimum or a saddle point of the cost function. Convergence can be detected by comparing the changes in the membership function or the cluster center at two successive iteration steps.
One of the important characteristics of an image is that neighboring pixels possess similar feature values, and the probability that they belong to the same cluster is great. This spatial relationship is important, but it is not utilized in a konvensional FCM algorithm. To exploit the spatial information, a spatial function is defined as.
) (xj
NB k
ik
ij
u
h
(5)In this formula, NB(xj) represents a square window centered on pixel xj in the spatial domain. A 3 x 3 window was used throughout this work. Just like the membership function, the spatial function hij represents the probability that pixel xj belongs to ith cluster. The spatial function of a pixel for a cluster is large if the majority of its neighborhood belongs to the same cluster. The spatial function in incorporated into membership function as follows:
c k q kj p kj q ij p ij ijh
u
h
u
u
1 ' (6)neighboring pixels. As a result, misclassified pixels from noisy regions or spurious blobs can easily be corrected. The spatial FCM with parameter p and q is denoted sFCMp,q. Note that sFCM1,0 is identical to the conventional FCM.
The clustering is a two-pass process at each iteration. The first pass is the same as that in standard FCM to calculate the membership function in the spectral domain. In the second pass, the membership information of each pixel is mapped to the spatial domain, and the spatial function is computed from that. The FCM iteration proceeds with the new membership that is incorporated with the spatial function. The iteration is stopped when the maximum difference between two cluster centers at two successive iterations is less than a threshold (=0,02). After the convergence, defuzzification is applied to assign each pixel to a specific cluster for which the membership is maximal
4. Experimental Results
4.1 Normal MRI Brain Image
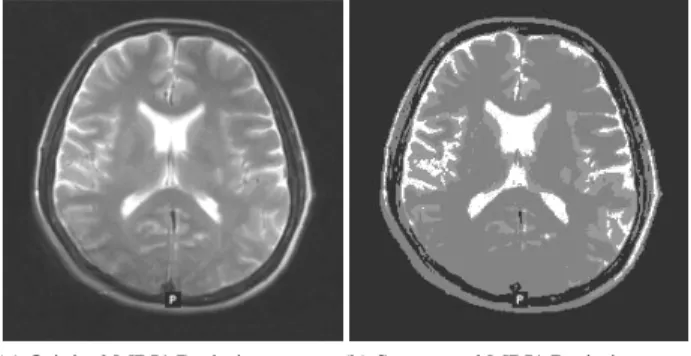
In this research, MRI image is segmented using FCM method incorporated into the spatial information. Figure 1(a) shows the 256x256 grayscale original T2-weighted MRI1 brain image. Fig. 1(b) shows the result of the FCM incorporated into the spatial information with parameters p=1 and q=2.
(a) Original MRI1 Brain image (b) Segmented MRI1 Brain image Figure 1. MRI1 Brain image
As can be seen in the segmented images in Fig. 2, lesion or abnormal mass is not identified, and the ventricular system is not extensive and it is a median. So, the image is normal brain MRI image.
4.2 Glioma MRI Brain Images
Figure 2(a) shows the 256x256 original MRI2 image [17]. As can be seen in the segmented image in Fig. 2(b), there
is extensive edema extending anteriorly and posteriorly and involving the basal ganglia.
The shift and mass effect on the ventricle have resulted in compromise of the foramen of Monro, and there is evidence of active hydrocephalus, as shown by both the ventricular enlargement and a homogeneous increase through the periventricular region. An additional area of increased signal, separated from the right hemisphere in the left side, suggest that there may even be a metastatic focus or evidence of distant extension of tumor into the left hemisphere. All these features suggest a very high Grade IV glioma or glioblastoma.
(a) Original MRI2 Brain image (b) Segmented MRI2 Brain image Figure 2. MRI2 Brain image
4.3 Analysis of the Area of Abnormal Mass
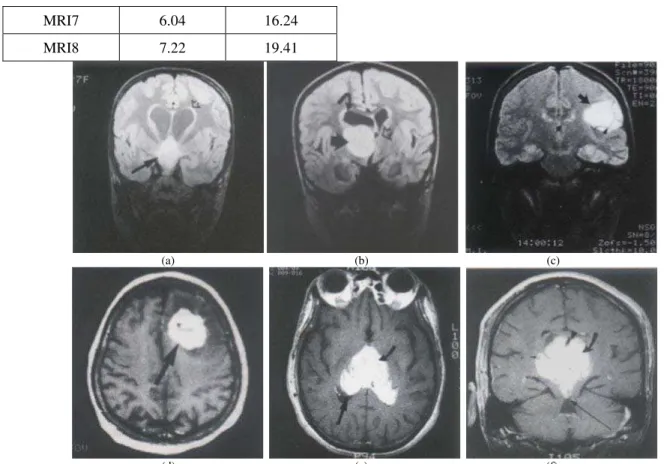
In this study, we also apply the FCM method to segment four 256x256 MRI brain images with abnormal mass (i.e. MRI3, MRI4, MRI5, MRI6, MRI7, and MRI8), as shown in Figure 3 [17].
Application of the FCM method in segmentation of the images is in order to analysis of the area of abnormal mass Figure 4 shows the 256x256 segmented MRI3-MRI8 images.
Table 1 shows area of abnormal mass of segmented MRI images. The results are MRI images identified tumors of 2.66% to 7.22% or 7.15 to 19.41 cm2. In the brain tumor, glioma, the bigger area of tumor the higher grade of glioma.
Table 1. Area of abnormal mass
Images Areas in % Areas in cm2
MRI3 2.66 7.15
MRI4 3.05 8.20
MRI5 3.57 9.60
MRI7 6.04 16.24
MRI8 7.22 19.41
(a) (b) (c)
(d) (e) (f)
Figure 3. Original abnormal mass MRI brain images: (a) MRI3, (b) MRI4, (c) MRI5, (d) MRI6, (e) MRI7, (f) MRI8.
(a) (b) (c)
(d) (e) (f)
5. Conclusions
In this paper we apply an extended FCM method that incorporates the spatial information into the membership function to improve the results of MRI brain image segmentation. The membership functions of the neighbors centered on a pixel of MRI brain image in the spatial domain are enumerated to obtain the cluster distribution statistics. These statistics are transformed into a weighting function and incorporated into the membership function. This neighboring effect reduces the number of spurious blobs and biases the solution toward piecewise homogeneous labeling. The technique was used to analyze a normal MRI brain image and glioma MRI brain images. We applied the technique on a normal MRI brain image and on a glioma MRI brain image. The results show that the method effectively segmented Magnetic Resonance Imaging (MRI) brain images with spatial information, and the segmented normal and glioma MRI brain images can be analyzed for diagnosis purpose. The results are MRI images identified tumors of 7.15 to 19.41 cm2.
References
[1] J. Bezdek. L. Hall. and L. Clarke. “Review of MR image segmentation using pattern recognition”. Medical Physics. vol. 20. 1993. pp. 1033–48.
[2] J. K. Udupa. L. Wei. S. Samarasekera. Y. Miki. M. A. van Buchem. and R. I. Grossman. "Multiple sclerosis lesion quantification using fuzzy-connectedness principles." IEEE Transactions on Medical Imaging. vol. 16. 1997. pp. 598-609.
[3] D.L. Pham. “Unsupervised Tissue Classification in Medical Images using Edge-Adaptive Clustering”. Proceedings of the 25th Annual International Conference of the IEEE EMBS. Cancun. Mexico. Sep. 17-21. 2003.
[4] L. Jiang and W. Yang. “A Modified Fuzzy C-Means Algorithm for Segmentation of Magnetic Resonance Images”. Proc. VIIth Digital Image Computing: Techniques and Applications. Sydney 10-12 Dec. 2003.
[5] D.L. Pham and J.l. Prince. “Adaptive fuzzy segmentation of magnetic resonance images”. IEEE Trans. in Medical Imaging. 1999. Vol. 18. pp. 737–752.
[6] C. Xu. D.L Pham. and J.L. Prince. “Finding the brain cortex using fuzzy segmentation. isosurfaces. and deformable surfaces”. In Proc. XVth Int. Conf. on Inform. Processing in Medical Imaging. (IPMI 1997). pp. 399-404.
[7] S.R. Kannan. “Segmentation of MRI Using New Unsupervised Fuzzy C Mean Algorithm. ICGST-GVIP Journal. Vol. 5. No.2. Jan. 2005.
[8] S. Alizadeh. M. Ghazanfari. and M. Fathian. “Using Data Mining for Learning and Clustering FCM”. International Journal of Computational Intelligence. Vol. 4. No. 2. Spring 2008.
[9] A. Wee, C. Liew, and H. Yan. “Current Methods in the Automatic Tissue Segmentation of 3D Magnetic Resonance Brain Images”. Current Medical Imaging Reviews, Vol. 2, No. 1, 2006, pp. 1-13.
[10]J.C. Rajapakse. J.N. Giedd. and J.L. Rapoport. “Statistical Approach to Segmentation of Single Channel Cerebral MR Images”. IEEE Trans. on Medical Imaging. Vol.16. No.2. April 1997.
[11]M.W. Vannier. C.M. Speidel. and D.L. Rickman. “Magnetic resonance imaging multi spectral tissue classication”. Journal of NIPS. vol.3. Aug. 1991.
[12]M. Ozkan. B.M. Dawant. and R.J. Maciunas. “Neural Network_Based Segmentation of Multi_Modal Medical Images. A Comparative and Prospective Study”. IEEE Transactions on Medical Imaging. Vol. 12. No.3. Sep. 1993. pp. 534-544.
[13]M.W. Hansen and W.E. Higgins. “Relaxation Methods for Supervised Image Segmentation”. IEEE Trans. on Pattern Analysis and Machine Intelligence. Vol. 19. No. 9. Sep. 1997.
[14]M.N. Ahmed and A.A. Farag. “Two stages Neural Network for Medical Volume Segmentation”. Accepted for Publication in the Journal of Pattern Recognition Letters. 1998.
[15]L.O. Hall. A.M. Bensaid. L.P. Clarke. R.P. Velthuizen. M.S. Silbger. and J.C. Bezdek. “A Comparison of Neural Network and Fuzzy Clustering Techniques in Segmenting Magnetic Resonance Images of the Brain”. IEEE Transactions on Neural Networks. Vol. 3. No. 5. Sep. 1992. pp. 672-681.
[16]K.S. Chuang. H.L. Tzeng. S. Chen. J. Wu. and T.J. Chen. “Fuzzy C-Means Clustering with Spatial Information for Image Segmentation”. Computerized Medical Imaging and Graphics. Vol. 30 (2006). Elsevier. pp. 9–15.
[17]J.H. Besese. Cranial MRI. A Teaching File Approach. McGraw-Hill. International Edition. Medical Series. 1991.
Indah Soesanti is with the Department of Electrical Engineering and Information Technology. Gadjah Mada University. Yogyakarta. Indonesia. She received B.S. and M.Eng. from Gadjah Mada University. Yogyakarta. Indonesia in 1998 and 2001. respectively. He is currently a Ph.D. student at the Electrical Engineering. Gadjah Mada University. She has more than 7 years of experience in teaching. Her research interests include image processing. signal processing. fuzzy logiz and its application. optimization. and information system. She has published more than five papers in national journals. She has also presented more than ten research articles in national and international conferences.
Thomas Sri Widodo is a Professor in the Department of Electrical Engineering and Information Technology. Gadjah Mada University. Yogyakarta. Indonesia. He received DEA. and Ph.D. from Universite des Sciences et Techniques du Languedoc. Montpellier 2. France in 1986 and 1988. respectively. He has more than 30 years of experience in teaching and research. His current area of research includes electronics. telecommunication. image processing. signal processing. neural networks. wavelets. fuzzy logiz and its application. instrumentation and control. biomedical engineering. and hypertermia. He has published more than ten papers in referred international journals. He has also presented more than fourty research articles in national and international conferences. He has written few books related to his research work. He is currently dealing with few projects sponsored by government of Indonesia (the Ministry of Education and the State Ministry of Research and Technology).