DOI: http://dx.doi.org/10.1590/2446-4740.00315
*e-mail: [email protected]
Received: 24 July 2015 / Accepted: 19 June 2016
Reticular pattern detection in dermoscopy: an approach using
Curvelet Transform
Marlene Machado, Jorge Pereira, Rui Fonseca-Pinto*
Abstract Introduction: Dermoscopy is a non-invasive in vivo imaging technique, used in dermatology in feature identiication, among pigmented melanocytic neoplasms, from suspicious skin lesions. Often, in the skin exam is possible to ascertain markers, whose identiication and proper characterization is dificult, even when it is used a magnifying lens and a source of light. Dermoscopic images are thus a challenging source of a wide range of digital features, frequently with clinical correlation. Among these markers, one of particular interest to diagnosis in skin evaluation is the reticular pattern. Methods: This paper presents a novel approach (avoiding pre-processing, e.g. segmentation and iltering) for reticular pattern detection in dermoscopic images, using texture spectral analysis. The proposed methodology involves a Curvelet Transform procedure to identify features. Results: Feature extraction is applied to identify a set of discriminant characteristics in the reticular pattern, and it is also employed in the automatic classiication task. The results obtained are encouraging, presenting Sensitivity and Speciicity of 82.35% and 76.79%, respectively. Conclusions: These results highlight the use of automatic classiication, in the context of artiicial intelligence, within a computer-aided diagnosis strategy, as a strong tool to help the human decision making task in clinical practice. Moreover, the results were obtained using images from three different sources, without previous lesion segmentation, achieving to a rapid, robust and low complexity methodology. These properties boost the presented approach to be easily used in clinical practice as an aid to the diagnostic process.
Keywords: Curvelet Transform, Dermoscopy, Reticular pattern, Melanoma, Pattern recognition.
Introduction
Malignant melanoma is the most aggressive and
the deadliest form of skin cancer among the Caucasian
population (Longo et al., 2012). The United States
epidemiology of cancer, laid skin cancer as the most
common form of malignancy over the past three decades (Rogers et al., 2010; Stern, 2010). In particular, melanoma is the most common form of cancer in
young adults (25-29 years old), and the second most
common form of cancer affecting young people
(15-29 years old) (Bleyer et al., 2006). In Europe, several studies have documented increase of melanoma
incidence in the last few decades (Baumert et al., 2009; Downing et al., 2006; Sant et al., 2009). In the
particular case of Portugal, where the sun exposure is high, the estimated incidence for 2012 was 7.5 per
100 000, mortality 1.6 per 100 000 and prevalence at
one, three and ive years 12.08%, 33.99% and 53.93%
respectively (Ferlay et al., 2013). Due to the increase in incidence (Downing et al., 2006; Ferlay et al., 2013) and the consequent increase in mortality, malignant
melanoma represents a signiicant and growing public
health problem (Longo et al., 2012). Therefore, the
earlier detection of melanoma is essential, and is still one of the most challenging problems in dermatology.
Dermoscopy is a non-invasive imaging technique used to obtain digital images on the surface of the
skin, and it has been successfully applied since
early 90 of the last century (Benelli et al., 1999; Fonseca-Pinto et al., 2010; Menzies et al., 1996; Soyer et al., 1995).
Clinical diagnosis of cutaneous melanoma is commonly based on the ABCD rule (Friedman et al.,
1985), Menzies method (Menzies, 2001) and seven-point checklist (Liu et al., 2005). According to the above-cited methods, melanomas usually have
differential structures, such pigmented networks, streaks or dots, giving clues about their melanocytic origin. The pigmented network is an important diagnostic clue, representing a dermoscopic hallmark of melanocytic lesions, which presence is, in general,
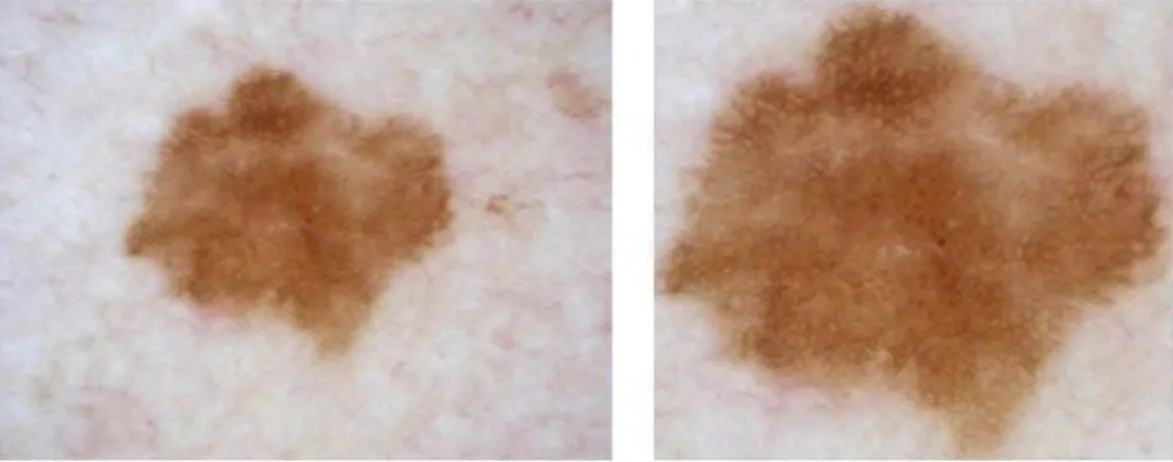
independent of the presence or absence of a carcinogenic process. The reticular pattern appears as a grid of thin
brown lines, over a diffuse light brown background. This is a honeycomb-like structure, consisting of
round-pigmented lines and lighter hypo-pigmented
holes, forming a subtle pattern that appears in many melanocytic lesions. This pigment distribution is
arranged in keratinocytes or along the dermoepidermal
junction along the rete-ridge, forming the observed
pattern at the outer layer of the skin.
The importance of early detection in skin cancer, and the complexity of the clinical decision regarding
the nature of the lesion, led in the last decade the
appearance of several works on the automatic detection of pigmented network, whose contribution is very useful to enhance medical classiication by dermatologists. In these works, most of the algorithms
carry out an automatic segmentation of the lesion,
followed by the calculation of features such as color, texture and shape characteristics. In the following, an
automatic learning algorithm is applied to select the most discriminant features, enabling the automatic
classiication (Anantha et al., 2004; Arroyo and Zapirain, 2014; Barata et al., 2012; Betta et al., 2006;
Fleming et al., 1998; Grana et al., 2006; Leo et al., 2010; Sadeghi et al., 2011).
The automated detection of the reticular pattern
or pigment network is often a challenging problem, since in these reticular structures there is a low contrast between the network and the background, the size of net holes may comprise different sizes in
different images, and also, in the same image often
exists irregularities in their shape and size.
The main objective within this work is to present a robust, rapid, and low complexity system, to identify
the presence of reticular pattern in dermoscopic images, avoiding the standard previous preprocessing steps
(lesion segmentation, iltering, artifact removal, …), suitable for usage with different dermoscopic acquisition
systems.
Methods
Color and texture features are the two main groups
of image characteristics, used by dermatologists,
to differentiate skin melanocytic patterns. Local
dermoscopic structures, such as reticular pattern,
can be described by texture features, whereas these markers denote spatial intensities in an image, enabling the identiication of different shapes.
Texture is a commonly used tool in the analysis and interpretation of images. There are two main approaches in texture feature extraction, accordingly
to the division among spatial or spectral domain methodologies (Sumana, 2008). Spectral approaches,
as in Wavelet and Curvelet Transforms, are more
robust to noise than the spatial approaches such as
Co-Occurrence matrices, Laws ilters, edge histogram, etc. Therefore, spectral approaches are widely used for
texture feature extraction, from image compression to image de-noising and classiication (Calderbank et al., 1997; Eltoukhy et al., 2010; Starck et al., 2002).
The Wavelet theory has been broadly used for
texture classiication. The success of Wavelets is owing to the driven performance in one-dimensional pricewise smooth functions, detecting singularities (points) (Do and Vetterli, 2003). However, images
generally include 1D singularity structures (edges and
corners), thus its use in images are of restricted use. To overcome the weakness of the Wavelets on
traditional multi-scale representations, and to capture
other directional features, the Curvelet transform has emerged as a new multi-resolution analysis tool. Curvelet analysis was irst proposed by Candès et al. (2006), and it is known as the irst generation Curvelet transform. Some studies have been developed with Curvelets in biomedical imaging such mammogram
images (Eltoukhy et al., 2010; Gardezi et al., 2014), endoscopy images (Li and Meng, 2009) or ingerprint images (Nikam and Agarwal, 2008).
In this study, skin lesions are classiied based on image texture features using the Curvelet transform. The classiication approach consists of two main processing steps. First, the Curvelet transform is
applied on a set of dermoscopy images, and a set of statistical features (mean, standard deviation, energy,
entropy and homogeneity) are extracted from each of the Curvelets sub-bands. Next, a classiier/feature
selector is built using the AdaBoost learning algorithm, adapted from Viola and Jones (2004). This approach
will select the best features to discriminate between lesions with reticular pattern and lesions without
reticular pattern, and to assign probabilities of being
lesion with reticular pattern.
Image preprocessing
In contrast to other methodologies in the context
of dermoscopic machine learning algorithms, the process of detecting and removing artifacts, and the
previous segmentation were not followed within the
proposed methodology. As a preprocessing step, the
conversion from RGB into a gray-level image was
performed by selecting the highest entropy channel.
this procedure is implemented, and it is running in our
current studies. An example of the cropping process output is shown in Figure 1.
Curvelet Transform
The Wavelet transform appears as a mathematical strategy to decompose an image into a scale-frequency
domain representation, which can further be divided into
sub-band images of different frequency components.
Each component is analyzed with a resolution matching
its scale. Wavelet transform has advantages over
traditional Fourier methods in analyzing physical situations where the signal contains discontinuities and sharp spikes. However, despite the Wavelet transform ability for horizontal, vertical and diagonal detail extraction, these three directions, in general, do not
provide enough information among other directions. This limitation can be of particular importance in
feature extraction in dermoscopy, since the growing
path of melanocytic lesions does not obey to strict geometric rules.
To improve the performance of image details
extraction, Candès (1998) proposed the use of the
Ridgelet Transform. Ridgelets are based on tracking
a line into a point singularity, by using the Radon
Transform. In fact, point singularity in the Radon domain
can be handled by using the Wavelet transform. Thus,
Ridgelet Transform is more eficient in representing
edges and other singularities along lines than Wavelets, as noted in Do and Vetterli (2003).
Images contain edges, which are typically more
curved than straight. Therefore, Ridgelets alone cannot
represent such curves eficiently. However, one curved edge can be viewed as a straight line at a suficient ine scale. Thus, to compute curved edges, Ridgelets can be applied based on a local approach. Hence, Candès et al. (2006) emerged with the idea behind
the Curvelet Transform by segmenting curves into
a set of fragments, and then use Ridgelet Transform to represent each ridge piece.
The discrete Curvelet transform of a continuum
function f(x1, x2) uses a dyadic sequence of scales, and
a ilter bank (P0f, Δ1f, Δ2f,…), where the passband ilter
Δs is concentrated in the proximity of the frequencies
[22s, 22s+2]. In wavelet theory, the decomposition
is performed into dyadic sub-bands [22s, 22s+1], in contrast, the sub-bands used in the discrete Curvelet
Transform have the nonstandard form [22s, 22s+2]. Implementation of the Curvelet Transform is settled by the next deinitions and steps:
▪ Sub-band Decomposition: The image f is decomposed into sub-bands, according to
Equation 1,
0 1 2
( , , ,...)
f P f ∆ ∆f f (1)
where P0 represents a low pass ilter.
▪ Smooth Partitioning: A grid of a dyadic squares
is deine as 1 2
1 1 2 2
( , , )
1 1
, ,
2 2 2 2
s k k s s s s
k k k k
Q + × +
and thus, each sub-band is smoothly windowed into
“squares” of an appropriate scale (of side length ~ 2-s) deined in Equation 2,
( )
s
sf wQ sf Q Q∈
∆ ∆ (2)
where WQ is a smooth windowing function in the vicinity of Q, with main support size 2-s × 2-s.
▪ Renormalization: The resulting squares are
renormalized to unit scale as presented in Equation 3,
1
( ) ( ),
Q Q Q s s
g = T − w ∆ f Q∈Q (3)
where TQ is deined, for each Q as TQf(x,y) = 2sf(2s x –k
1, 2 sy – k
2).
▪ Ridgelet Analysis: Ridgelet transform (Candès,
1998) is performed on each renormalized square. The block diagram for the implementation of digital Ridgelet Transform is shown in
Figure 2.
In this deinition, the two dyadic sub-bands
[22s, 22s+1] and [22s+1, 22s+2] are merged, and then the
Ridgelet Transform is applied.
Feature extraction, feature selection and
classiication
Regarding feature selection task, the CuvLab toolbox (Candès et al., 2006) was used, and two commonly used
Curvelet Transforms were tested (the Unequally-Spaced Fast Fourier Transform (USFFT) and wrapping based fast Curvelet Transform (WFCT)). Contrary to Fadili
and Starck (2007), this work put forward improved results when using USFFT (concerning Speciicity, Sensitivity and Accuracy). For the image decomposition step, several scales of decomposition were tested to obtain the Curvelet coeficients. The best result was obtained with nine scales.
Statistical features such as mean (μ), standard deviation (σ), energy (е), entropy (Е) and homogeneity
(H) were calculated from each Curvelet sub-band, and
they were used to construct four global feature vectors
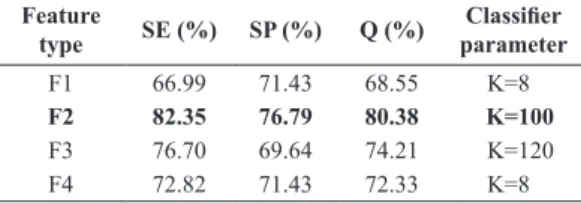
as F1 = [Fμ, Fσ, Fе, FЕ], F2 = [Fσ, Fе, FЕ], F3 = [Fσ, FЕ] and F4 = [Fσ, Fе, FЕ, FH], where Fμ = [μ1, μ2, …, μs], Fσ = [σ1, σ2, …, σs], Fе = [е1, е2, …, еs], FЕ = [Е1, Е2, …, Еs] and FH = [H1, H2, …, Hs]. In the construction of the
four global feature composition, all combinations were tested and the coniguration was elicited by selecting
the high score combinations (Table 1).
For the construction of the training model,
70 images obtained from the Derm101 [derm01] and PCDS databases [pcds], were used. The AdaBoost algorithm as adapted form Viola and Jones (2004)
was chosen for the automatic classiication, as it
simultaneously selects the best features and trains
the classiier. Generally, the AdaBoost classiier selects a small subset from the initial set, called weak classiiers, and combines the selected algorithms into a strong, well-performing classiier. For more
details, regarding the boosting technique, please
see the reference where the methodology where
originality presented in (Paradiso and Carney, 1988). The variant of the AdaBoost algorithm used in this
paper identiies weak classiiers with texture features.
Results
In this section, a summary of the conducted experiments and obtained results is presented.
Dataset
To evaluate the discrimination power of the proposed spectral textural feature characterization, a set of extensive experiments it was conducted, by using images from three different certiied databases:
Derm101 [derm01], Hosei Dataset [zhou] and PCDS Database [pcds]. These images were obtained by
dermatologists during clinical exams. All images were
stored in JPEG formats. From these databases, three
different datasets containing 90, 53, and 15 RGB images where used, respectively. Regarding image resolution, the 90 images from [derm01] have 600×650. For the other two sets, image resolution was not constant, ranging from 600×550 till 900×900. Each image was cropped and resized for 512×512 to avoid unnecessary background information, increasing by this way the signal to noise ratio.
For training and validation purposes, each image
was labeled as with or without reticular pattern
(ground truth label).
Figure 2. Ridgelet transform diagram.
Table 1. Classiication results.
Feature
type SE (%) SP (%) Q (%)
Classiier
parameter
F1 66.99 71.43 68.55 K=8
F2 82.35 76.79 80.38 K=100
F3 76.70 69.64 74.21 K=120
Evaluation metrics and results
To test the performance of the proposed methodology,
common evaluation metrics were used, i.e, Sensitivity
(SE), Speciicity (SP) and Accuracy (Q).
The four features set (F1, F2, F3 and F4),
were tested independently and evaluated on all the sub-bands, totalizing 936, 720, 468 and 936 features, respectively. In Table 1 it is possible to observe the
feature combination for the lesion classiication.
The F2 feature set reached superior performance achieving SE = 82.35% and SP = 76.79%.
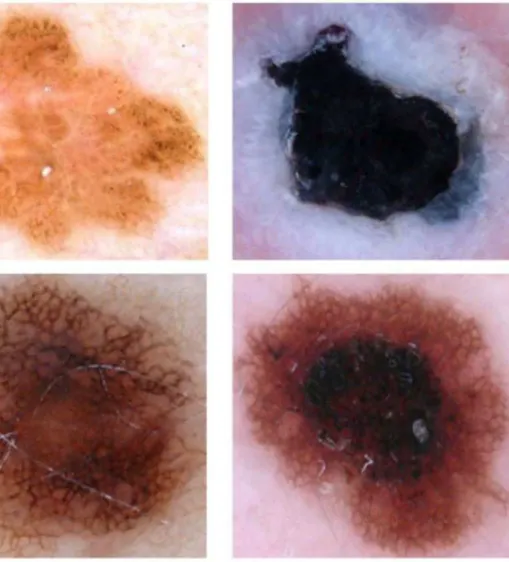
Although the obtained results were encouraging, there are some demanding images where the detector lops. In Figure 3 it is possible to observe (top left and
top right) several dots and dark circular structures, functioning as a confounding factor, and this texture
pattern is falsely detected by the algorithm, although
it is not a reticular pattern. Likewise, in bottom-left
and bottom-right, there are lesions with reticular pattern, but they were wrongly labeled as not having
it. To overcome this problem, additional information
is needed to increase the classiication accuracy. This additional information, in terms of extracted
features must joint other pattern analysis obtained
from the image (e.g. fissures and comedo-like
openings, cobblestone pattern, peripheral and eccentric
globules, etc…).
Discussion
The use of automatic classiication in dermoscopy
is a strong tool to access dermatologists in clinical diagnosis, in the major challenge of the early detection
of skin cancer. Skin lesion classiication is based on the identiication of structures, whose features allow the quantiication using of well-known classiication rules (ABCD, Menzies method, 7 point check-list, …).
The reticular pattern is one of these features, and
the contribution for the accurate identiication with
automatic methodologies by using digital imaging
methods, rationalizes this work. Moreover, the proposed
method avoids usual preprocessing steps, being
suited for its use with different acquisition systems after a simple cropping image operation. In fact, the approach presented in this work does not use lesion
segmentation or artifact removal as a preprocessing
step. Instead, as the main goal is the detection of
reticular pattern, the cropped image encompassed
lesion and also surrounding skin. In the particular
case of reticular pattern detection, there are several
cases where this structure emerges outside the formal segmentation of the lesion (whose border is artiicial imposed by segmentation rules). The reticular pattern (particularly in the lesion border) is often neglected
by the segmentation procedures, as it vanishes outside
the pigmented structure in a subtle way. Therefore,
a novel approach (rapid, robust and presenting
low complexity) is introduced for reticular pattern identiication using a Curvelet Transform.
Experimental results from a set of lesions obtained from three different databases (as presented before) shows that the algorithm achieves good detection scores with a simple group of features (standard deviation, entropy and energy), extracted from the image sub-band decomposition. Hence, the method
can be regarded as a valuable tool in a dermoscopy analysis system.
The evaluation metrics are the standard for assess
the classiier performance. In the present work, as is
possible to observe in Table 1, evaluation metrics
(SE, SP and Q) are 82.35, 76.79 and 80.38 respectively.
As referred in the introduction section, there are other
works addressing this issue of reticular pattern, however
the majority use lesion segmentation as a preprocessing step, and some fail to indicate all evaluation metrics.
Thus, compare the proposed methodology with works with similar goals (but different methods and metrics) is a demanding task. Even so, being the reticular pattern (detection, identiication or characterization) the main goal of all works, it is worth to look for ways to comparison, among the offered information. Concerning accuracy, Anantha et al. (2004) obtained
80% and Sadeghi et al. (2011) 93%. In contrast, in Leo et al. (2010), regarding atypical network, the accuracy values were not shown, but Sensitivity and Speciicity are 80% and 82% respectively. Also, in view of the dificulty in comparing results, and adding
clinical concerns, the number of true positives can be regarded as the strongest indicator. Therefore,
sensitivity values can be considered as the irst value for
comparison (when is lacking complete information for others), whose values averaged 82.35% in this work.
Despite the results of the SE present themselves as promising, it is possible to ind some “dificult” images as is shown in Figure 3, thus tricking the classiier. These images are challenging, as they possess other textured base dermoscopic structures, whose presence confounds the classiier.
To overcame this problem and hence improve these results, the reticular pattern criteria detection should include other predictable properties (behind
texture based features) in these structures, such as dots, pigment color, background color and spatial organization of holes. Afterwards, an automatic classiier
can be trained using this additional information, to
reine the inal decision criteria. This approach is now being tested and results will be presented in the near future. Future work should also focus on a detailed
evaluation of the proposed algorithm in a larger
database, and in the characterization of the detected
reticular pattern in order to discriminate typical from
atypical patterns, which is an important inkling to
perceive malignant lesions.
Acknowledgements
This work was co-funded by DERMCALSS, CENTRO-07-ST24-FEDER-002022, and PEst-OE/ EEI/LA0008/2013.
References
Anantha M, Moss R, Stoecker W. Detection of pigment network in dermatoscopy images using texture analysis. Computerized Medical Imaging and Graphics. 2004; 28(5):225-34. http://dx.doi.org/10.1016/j.compmedimag.2004.04.002. PMid:15249068.
Arroyo JG, Zapirain BG. Detection of pigment network in dermoscopy images using supervised machine learning and structural analysis. Computers in Biology and Medicine. 2014; 44:144-57. http://dx.doi.org/10.1016/j. compbiomed.2013.11.002. PMid:24314859.
Barata C, Marques J, Rozeira J. A system for the detection of pigment network in dermoscopy images using directional filters. IEEE Transactions on Biomedical Engineering. 2012; 59(10):2744-54. http://dx.doi.org/10.1109/TBME.2012.2209423. PMid:22829364.
Baumert J, Schmidt M, Giehl KA, Volkenandt M, Plewig G, Wendtner C, Schmid-Wendtner MH. Time trends in tumour thickness vary in subgroups: analysis of 6475 patients by age, tumour site and melanoma subtype. Melanoma Research. 2009; 19(1):24-30. http://dx.doi.org/10.1097/ CMR.0b013e32831c6fe7. PMid:19430403.
European Journal of Dermatology. 1999; 9(6):470-6. PMid:10491506.
Betta G, Di Leo G, Fabbrocini G, Paolillo A, Sommella P. Dermoscopic image-analysis system: Estimation of atypical pigment network and atypical vascular pattern. In: Proceedings of the IEEE International Workshop on Medical Measurement and Applications (MeMea 2006); 2006 Apr 20-21; Benevento, Italy. Washington: IEEE; 2006. p. 63-7. http://dx.doi.org/10.1109/MEMEA.2006.1644462. Bleyer A, Viny A, Barr R. Cancer in 15- to 29-year-olds by primary site. The Oncologist. 2006; 11(6):590-601. http:// dx.doi.org/10.1634/theoncologist.11-6-590. PMid:16794238. Calderbank A, Daubechies I, Sweldens W, Yeo BL. Lossless image compression using integer to integer Wavelet Transforms. In: Proceedings of the International Conference on Image Processing; 1997 Oct 26-29; Santa Barbara, CA, USA. Washington: IEEE; 1997. p. 596-9. http://dx.doi. org/10.1109/ICIP.1997.647983.
Candès E, Demanet L, Donoho DL, Ying L. Fast discrete curvelet transforms. Multiscale Modeling & Simulation. 2006; 5(3):861-99. http://dx.doi.org/10.1137/05064182X. Candès J. Ridgelets: theory and applications [thesis]. Stanford: Department of Statistics, Stanford University; 1998. Do MN, Vetterli M. The Finite Ridgelet Transform for image representation. IEEE Transactions on Image Processing. 2003; 12(1):16-28. http://dx.doi.org/10.1109/TIP.2002.806252. PMid:18237876.
Downing A, Newton-Bishop J, Forman D. Recent trends in cutaneous malignant melanoma in the Yorkshire region of England; incidence, mortality and survival in relation to stage of disease, 1993-2003. British Journal of Cancer. 2006; 95(1):91-5. http://dx.doi.org/10.1038/sj.bjc.6603216. PMid:16755289.
Eltoukhy MM, Faye I, Samir BB. Breast cancer diagnosis in digital mammogram using multiscale curvelet transform. Computerized Medical Imaging and Graphics. 2010; 34(4):269-76. http://dx.doi.org/10.1016/j.compmedimag.2009.11.002. PMid:20004076.
Fadili MJ, Starck JL. Curvelets and Ridgelets. In: Meyers R, editor. Encyclopedia of complexity and system science. New York: Springer; 2007.
Ferlay F, Steliarova-Foucher E, Lortet-Tieulent J, Rosso S, Coebergh JW, Comber H, Forman D, Bray F. Cancer incidence and mortality patterns in Europe: estimates for 40 countries in 2012. European Journal of Cancer. 2013; 49(6):1374-403. http://dx.doi.org/10.1016/j.ejca.2012.12.027. PMid:23485231.
Fleming M, Steger C, Zhang J, Gao J, Cognetta A, Pollak I, Dyer C. Techniques for a structural analysis of dermatoscopic imagery. Computerized Medical Imaging and Graphics. 1998; 22(5):375-89. http://dx.doi.org/10.1016/S0895-6111(98)00048-2. PMid:9890182.
Fonseca-Pinto R, Caseiro P, Andrade A. Image Empirical Mode Decomposition (IEMD) in dermoscopic images: Artefact removal and lesion border detection. In: Proceedings of the Signal Processing Patterns Recognition and Applications
(SPPRA 2010); 2010 Feb 17-19; Innsbruck, Austria. Canada: IASTED; 2010. p. 341-5.
Friedman RJ, Rigel DS, Kopf AW. Early detection of malignant melanoma: the role of the physician examination and self examination of the skin. CA: A Cancer Journal for Clinicians. 1985; 35(3):130-51. http://dx.doi.org/10.3322/ canjclin.35.3.130. PMid:3921200.
Gardezi JS, Faye I, Eltoukhy MM. Analysis of mammogram images based on texture features of curvelet Sub-bands. In: Proceedings of the ICGIP 2013: Fifth International Conference on Graphic and Image Processing; 2013 Oct 26; Hong Kong, China. Washington: IEEE; 2014. v. 906924. http://dx.doi.org/10.1117/12.2054183.
Grana C, Cucchiara R, Pellacani G, Seidenari S. Line detection and texture characterization of network patterns. In: Proceedings of the ICPR’06: 18th International Conference on Pattern Recognition; 2006; Hong Kong, China. Washington: IEEE; 2006. p. 275-8. v. 2.
Leo GD, Paolillo A, Sommella P, Fabbrocini G. Automatic diagnosis of melanoma: a software system based on the 7-point checklist. In: Proceedings of the HICSS 2010: 43rd Hawaii International Conference on System Sciences; 2010 Jan 5-8; Honolulu, HI, USA. Washington: IEEE; 2010. p. 1-10. http://dx.doi.org/10.1109/HICSS.2010.76.
Li B, Meng MQH. Texture analysis for ulcer detection in capsule endoscopy images. Image and Vision Computing. 2009; 27(9):1336-42. http://dx.doi.org/10.1016/j. imavis.2008.12.003.
Liu W, Hill D, Gibbs A, Tempany M, Howe C, Borland R, Morand M, Kelly J. What features do patients notice that help to distinguish between benign pigmented lesions and melanomas? The ABCD(E) rule versus the seven-point checklist. Melanoma Research. 2005; 15(6):549-54. http://dx.doi.org/10.1097/00008390-200512000-00011. PMid:16314742.
Longo DL, Fauci AS, Kasper DL, Hauser SL, Jameson JL, Loscalzo J. Harrison’s principles of internal medicine. 18th ed. New York: McGraw-Hill; 2012.
Menzies SW, Ingvar C, McCarthy WH. A sensitivity and specificity analysis of the surface microscopy features of invasive melanoma. Melanoma Research. 1996; 6(1):55-62. http://dx.doi.org/10.1097/00008390-199602000-00008. PMid:8640071.
Menzies SW. A method for the diagnosis of primary cutaneous melanoma using surface microscopy. Dermatologic Clinics. 2001; 19(2):299-305, viii. http://dx.doi.org/10.1016/S0733-8635(05)70267-9. PMid:11556238.
Nikam SB, Agarwal S. Fingerprint liveness detection using curvet energy and cooccurrence signatures. In: Proceedings of the CGIV ’08: Fifth International Conference on Computer Graphics, Imaging and Visualization; 2008 Aug 26-28; Penang, Malaysia. Washington: IEEE; 2008. p. 217-22. http://dx.doi.org/10.1109/CGIV.2008.9.
Rogers HW, Weinstock MA, Harris AR, Hinckley MR, Feldman SR, Fleischer AB, Coldiron BM. Incidence estimate of nonmelanoma skin cancer in the United States, 2006. Archives of Dermatology. 2010; 146(3):283-7. http:// dx.doi.org/10.1001/archdermatol.2010.19. PMid:20231499. Sadeghi M, Razmara M, Lee TK, Atkins MS. A novel method for detection of pigment network in dermoscopic images using graphs. Computerized Medical Imaging and Graphics. 2011; 35(2):137-43. http://dx.doi.org/10.1016/j. compmedimag.2010.07.002. PMid:20724109.
Sant M, Allemani C, Santaquilani M, Knijn A, Marchesi F, Capocaccia R. EUROCARE-4. Survival of cancer patients diagnosed in 1995-1999. Results and commentary. European Journal of Cancer. 2009; 45(6):931-91. http:// dx.doi.org/10.1016/j.ejca.2008.11.018. PMid:19171476. Soyer HP, Smolle J, Leitinger G, Rieger E, Kerl H. Diagnostic reliability of dermoscopic criteria for detecting malignant
melanoma. Dermatology. 1995; 190(1):25-30. http://dx.doi. org/10.1159/000246629. PMid:7894091.
Starck JL, Candès E, Donoho DL. The curvelet transform for image denoising. IEEE Transactions on Image Processing. 2002; 11(6):670-84. http://dx.doi.org/10.1109/ TIP.2002.1014998. PMid:18244665.
Stern RS. Prevalence of a history of skin cancer in 2007: results of an incidence-based model. Archives of Dermatology. 2010; 146(3):279-82. http://dx.doi.org/10.1001/ archdermatol.2010.4. PMid:20231498.
Sumana IJ. Image retrieval using discrete curvelet [dissertation]. Melbourne: Gippsland School of Information Technology, Monash University; 2008.
Viola P, Jones MJ. Robust real-time face detection. International Journal of Computer Vision. 2004; 57(2):137-54. http:// dx.doi.org/10.1023/B:VISI.0000013087.49260.fb.
Authors
Marlene Machado1, Jorge Pereira1, Rui Fonseca-Pinto1,2*
1 Multimedia Signal Processing Group, Instituto de Telecomunicações, Campus 2, IPLeiria, 2411-901, Leiria, Portugal.