Wage inequality and trade liberalization:
Evidence from Argentina
*
Sebastián Galiani and Pablo Sanguinetti
Universidad Torcuato Di TeUa
November 2000
Very preliminaryAbstract
Wage inequality has increased substantially in Argentina during the nineties. At the same time during this decade Argentina has gone through a rapid and deep process of trade liberalization. In this paper we try to associate both phenomena. In particular, we attempt to answer the following question: Did trade liberalization play any role in
shaping the argentine wage structure during the period studied? Specifically, we test whether those sectors where import penetration deepened are also the sectors where,
ceteris paribus, a higher increase in wage inequality has taken place. We fmd evidence that supports this hypothesis.
Keywords: Wage inequality, trade liberalization and Argentina.
1. Introduction
In this paper we investigate the relationship between trade and the rewards to skill for Argentine workers during the period 1992-1999. Galiani (1999) shows that in Argentina, contrary to what has occurred in the OECD countries, it carmot be asserted that the returns to college graduates have increased during the eighties. It is only since the beginning of the nineties that there is c1ear evidence that the college wage premium have increased in Argentina. This evidence suggest that trade openness could have played a role in shaping relative wages in Argentina because this country has taken swiping reforms at liberalizing trade between 1998 and 1993. What is more, it was only afier the successful stabilization program launched in 1991 that these reforms become effective and, indeed, sharp. It is this suggestive "timing" that motivates the study of the relationship between trade liberalization and relative wages in Argentina.
Thus, in this paper we study the impact of trade liberalization on wage inequality in Argentina during the nineties. We attempt to answer the following question: did trade liberalization play any role in shaping the argentine wage structure during the period studied? Specifically, we test whether those sectors where import penetration deepened are, ceteris paribus, the sectors where a higher increase in wage inequality has taken place. We find evidence that supports this hypothesis.
Several OECD countries have experienced an increasing dispersion of wages during the last two decades with the biggest rise in wage dispersion taking place by considerable distance in UK and US (cf. e.g. Nickell and Layard, 2000). In particular, in these countries it is observed a large increase in the wage differentials by education and experience (see, e.g. Bound and Johnson, 1992, Katz and Murphy, 1992, Machin, 1996 and Schmitt, 1995).1 Thus, the argentine case is particularly interesting because the
increase in the wage differentials by skill occurred only during the nineties coinciding with a deep process oftrade liberalization.
There is widespread agreement on the fact that in developed countries there has been a shift in demand away from unskilled labor in favor of skilled labor during the last two decades. Two competing explanations have been proposed to explain this shift in the relative demand for skilled labor: the impact of trade with low wage (developing) countries and skill-biased technological change (cf. e.g. Berman et aI., 1994, Berman et aI., 1998, Machin, 1995 and Wood, 1995). A large amount of research has sought to evaluate both explanations with the result that the latter is often thought to be more important in explaining the relative shift in labor demand (cf. e.g. Feenstra, 1998) although most of the current research arrives to this conc1usion indirect1y: skill-biased technological change must be present because both the relative wages and the employment of the skilled workers moved in the same direction (cf. Krugman, 2000). Nevertheless, see Leamer (1998) for a defense of the trade explanation. He argues in favor ofthe growing imports ofunskilled labor-intensive manufactures as the main cause ofthe increase in wage inequality in developed countries during the last two decades.
Recently, there has been new research trying to recast the impact oftrade on wage
inequality (cf. the volume by Feenstra, 2000). This paper contributes to this current line
ofresearch. Specifically, our paper is related to some recent contributions in the literature
(cf e.g., Lovely and Richardson, 2000).
Although most of the empirical research in this area has been conducted by using
data aggregated at the industry leveI, an approach we also follow here, we base our main
analysis in the use of micro data obtained from the ongoing household survey. Our
approach allows us to define skilled labor in terms of precise skill groups and to control
for a number ofindividual characteristics (sex, age, work experience, etc.) that also affect
wages and which cannot be taken into account when working with data aggregated at the
industry leveI.
We find that trade liberalization in Argentina has had significant effects on trade
flows, employment and relative prices. In particular the manufacturing sector has faced
strong competition from foreign markets as reflected by the significant increase in the
import penetration ratios. Additionally, we observe a positive correlation between the
relative prices of the manufacturing goods and the leveI of import penetration of the
respective manufacturing sector.
Given that the manufacturing sector in Argentina employs intensively unskilled
labor, there is strong theoretical support in favor ofthe hypothesis that a deep increase in
foreign competition like the one observed in Argentina during the nineties would affect
the wages of the unskilled workers more than the wages of the skilled workers. This
assertion is confirmed by our statistical analysis. In particular, we find statistical evidence
that shows that import penetration is positively and significantly associated with the rise
in the college wage premium, a phenomena that characterizes the evolution of wages in
Argentina during the nineties. However, similar1y to what have been found for some
deve10ped economies, trade deepening can only explain a relative small proportion of the
The rest of the paper is organized as follows. Next seetion doeuments the trends in wage inequality in Argentina sinee the eighties. Seetion 3 deseribes the main features of Argentina's trade liberalization proeess using aggregate data at the industry leveI. In seetion 4 we examine the theoretieal relationships between trade liberalization and wage inequality. In seetion 5, we test whether or not trade openness has had any impaet on wage inequality in Argentina during the nineties. Finally, seetion 6 eonc1udes.
2. Trends in wage inequality in Argentina
In this seetion we study the evolution of the wage strueture in Argentina. In faet, the empirieal evidenee available is from Greater Buenos Aires, the main urban agglomerate.2 We emphasize the wage differentials by edueational attainment leveIs and for that, we define the ensuing three skill groups: unskilled (those individuaIs who at most have attended high sehool but have not finished it), semi-skilled (those that have finished high sehool) and skilled workers (those that have finished a tertiary degree). Our study exc1udes self-employees, owner-managers and unpaid workers beeause we are only interested in the study of the ehanges in the wage strueture. The results of the estimation ofthe wage premia are shown in the figure 1.
250
,
200 ' l.. ...
150
100 "" 50 ...
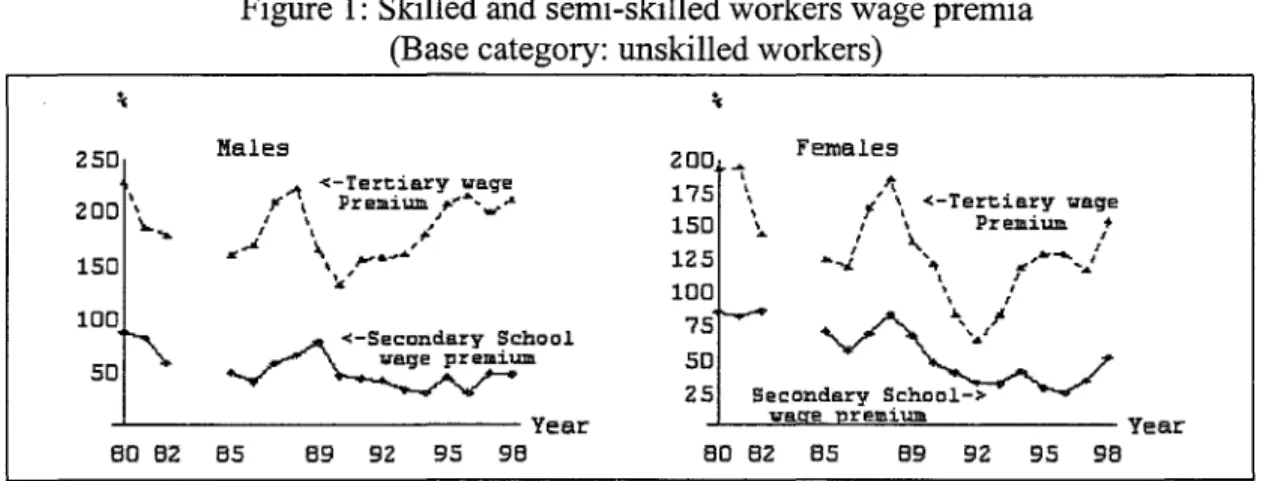
Figure 1: Skilled and semi-skilled workers wage premia (Base eategory: unskilled workers)
Males
, . / ' \ \MUAセセセ、[セAQャiセセィooャ@
セ@ セuャャi@
200 Females
"t
l
'.
<-Tertiery ;rege I ' Prelllium. f.,,\. .... , ... /.1
,
175 " ,
'...
150
125 ... 1. ... , ...
100 " I
751--
セ@
' \ . /50
セセセ@
••cセセセ@
25 s・セッョ、・イケ@ UセィッッャM^@セMMMMMMMMMMMMy・。イ@ -,---,;r"",e==-IDe....t=. p:r""em'""i""UllI=-_ _ _ _ _ Year
60 62 65 69 92 95 98 80 62 65 69 92 95 98
Notes: The figures report the evolution ofthe educational wage premia by gender. These statistics are derived from the coefficients of a wage equation where the dependent variable is the logarithm of the hourly wages and among the covariates there is a set of educational dummies and a quadratic function in potential experience. The equations are estimated separately by gender. The dependent variable is the logarithm of the hourly eamings of the sampled individuaIs in their main occupation. For employees, this variable is equivalent to the hourly wages. The schooling
group g wage premium in year t is the expected percentage increase in the wage of a worker whose levei of education is
g with respect to the expected wage of an unskilled worker. The yearly data is taken from the October wave of the
Household survey for Greater Buenos Aires (GBA). There are not data tapes available for the years 1983 and 1984. Source: Galiani (1999).
For the whole period, the main changes in the wage structure are the following: the semi-skilled group has become more like the unskilled group as time has passed, that is, they have seen their wages deteriorate relative to the unskilled group wages. Additionally, the unskilled group has not seen its wages deteriorate rei ative to the skilled workers wages. For example, the male skilled wage premium was 228 percent in 1980, 156 percent in 1991 and 211 percent in 1998 while the male semi-skilled wage premium was respectively, 87,44 and 48 percent.
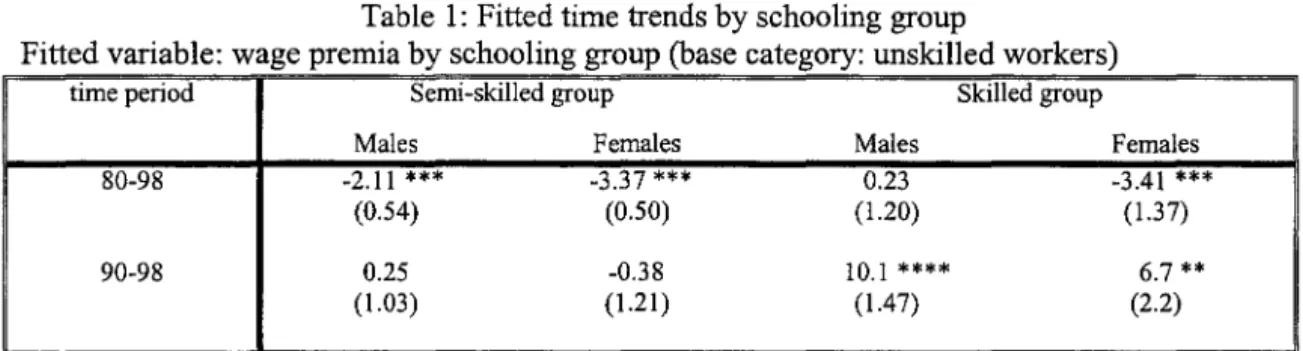
Nevertheless, if the analysis is restricted to the evolution of wages during the nineties, the period when trade liberalization was deepened, we see a somewhat different picture. The wages of the semi-skilled group did not deteriorate relative to the unskilled group wages while both the unskilled and semi-skilled wages deteriorated relative to the skilled group wages. lndeed, the skilled-unskilled wage premium increased substantially during the 90s. In order to quantify the magnitude of these trends we fit a constant and a linear time trend to the wage premium for those skill groups plotted in figure 1. The coefficients associated with the time trend measures the percentage change per year in the respective wage premium. Table 1 shows the results.
Table 1: Fitted time trends by schooling group
Fitted variable: wage premia by schooling group (base category: unskilled workers)
time period Semi-skilled group Skilled group
Males Females Males Females
80-98 -2.11 *** -3.37 *** 0.23 -3.41 ***
(0.54) (0.50) (1.20) (1.37)
90-98 0.25 -0.38 10.1 **** 6.7 **
(1.03) (1.21 ) (1.47) (2.2)
es: The tim d takes the values t - 1 23 6 7 ... 19. *** ifthe coefficient is statisticall
Not e tren , , , " , y different from zero at fue
one percent significance leveI. ** if the coefficient is statistically different from zero at the five percent significance
leveI. We report the statistical significance ofthe fitted trends only as informative measures.
positive trend. In particular, the estimated coefficient for this period implies that the male college wage premium raised 10 percentage points per year during the nineties. The female college wage premium behavior illustrates even more strongly the change in the wage structure occurred during the nineties. For the secondary school group we find, consistent1y with what we see in figure 1, that its wage premium with respect to the incomplete secondary group has not changed during the nineties, although it has been dec1ining during the whole 1980-1998 period.
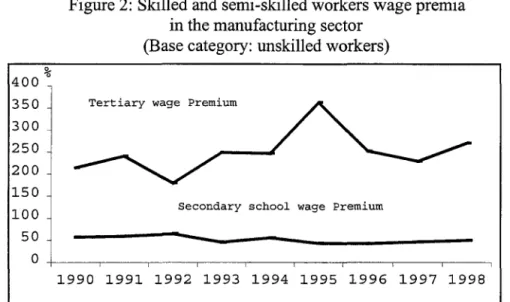
Figure 2 illustrates the evolution ofthe wage premia for the manufacturing sector. Due to sample size considerations we present only an average wage premium by skill group. It is manifest fIom the figure that the trends we observe in the manufacturing sector during the nineties are similar to those we observe for the whole economy. We find a significant positive trend in the college wage premium. On average, it increased approximately 7 percentage points per year during the nineties while the secondary school wage premium slight1y decreased but not significantly.3 Thus, overall, we may conc1ude that during the nineties, the trends in the wage structure in the manufacturing sector are quite similar to those for the whole economy.
%
400 350 300 250 200 150 100 50
Figure 2: Skilled and semi-skilled workers wage premia in the manufacturing sector
(Base category: unskilled workers)
Tertiary wage Premium
Secondary school wage premium
o
KMMMMML⦅MMMNMMMMNMMMMMイMMMMLMMMMセMMMMN⦅MMMML⦅MM⦅L@1990 1991 1992 1993 1994 1995 1996 1997 1998
Notes: The figure reports the evolution of the educational wage premia in the manufacturing sector. These statistics are derived from the coefficients of a wage equation where the dependent variable is the logarithm of the hourly wages and
among the covariates there is a set of educational dummies, a quadratic function in potential experience and a gender dummy. The dependent variable is the logarithm of the hourly eamings of the sampled individuais in their main occupation. The yearly data is taken from the October wave ofthe Household survey for Greater Buenos Aires (GBA). Source: author's elaboration.
3. Trade liberalization, trade flows and employment in Argentina in the nineties
Argentina trade liberalization process has been accomplished by policies applied unilaterally, regionally and also within the multilateral negotiations at the General Agreement on Trade and Tariffs (GATT). The process oftrade liberalization started as a unilateral policy in 1988. The prograrn inc1uded both a reduction in nominal protection and a significant reduction oftariffpositions that were subject to quantitative restrictions. The process was deepened by the new administration that took office in 1989. By the end of 1991, nominal tariffs had been lowered to an average leveI of 10 percent. In addition, alI import licenses had been eliminated. This impulse toward liberalization was partially reversed when an extraordinary and temporary non-tariff duty of 10 percent to almost alI tariff items was established during 1992. However, at the end of 1994 this extraordinary levy was reduced to 3 percent (see Berlinsky, 1999). Overall, the average tariff in Argentina was reduced from a leveI of 45 percent in 1987 to around 12 percent in 1994.
protection in Argentina, it has played a key role in sustaining the nominal protection at a leveI substantially lower than the one compromised on a multilateral basisA
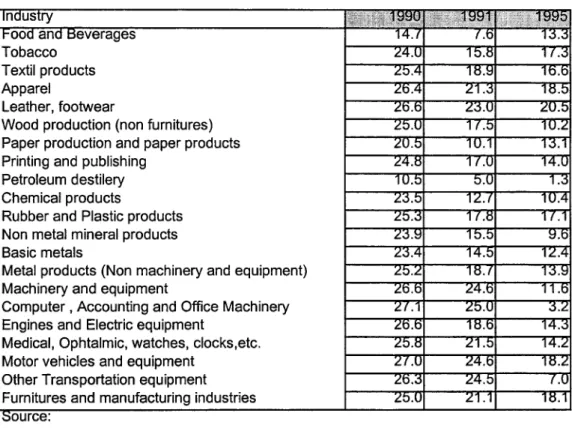
The impact of the overall process of trade liberalization in industry nominal protection is described in Table 2 where we show data on tariff by industry sector. There we compute tariffs by two digit ofthe ISIC (version 3) industrial classification since 1990.
We observe significant declines in tariffs in many industries at the beginning of the 90s which, for some sectors, continued latter on in the decade (i.e capital goods like computer and office
Table 2. Tariffs by two digit ISIC classification: 1990-1995
Tobacco Textil products Apparel
Leather, footwear
Wood production (non furnitures) Paper production and paper products Printing and publishing
Petroleum destilery Chemical products
Rubber and Plastic products Non metal mineral products Basic metais
Metal products (Non machinery and equipment) Machinery and equipment
Computer , Accounting and Office Machinery Engines and Electric equipment
Medicai, Ophtalmic, watches, clocks,etc. Motor vehicles and equipment
Other Transportation equipment Furnitures and manufacturing industries
equipment, other transportation equipment, etc.). Tariffs also decline for more unskilled labor intensive products like textiles, apparel and leather and footwear.
It is not surprising that such a profound and rapid process of trade liberalization would have had a tremendous impact on trade flows like it did in Argentina. Total trade rose almost four times between 1987 to 1998 (see figure 3), almost doubling its share in DGP: from approximately 10 percent to 18 percent.
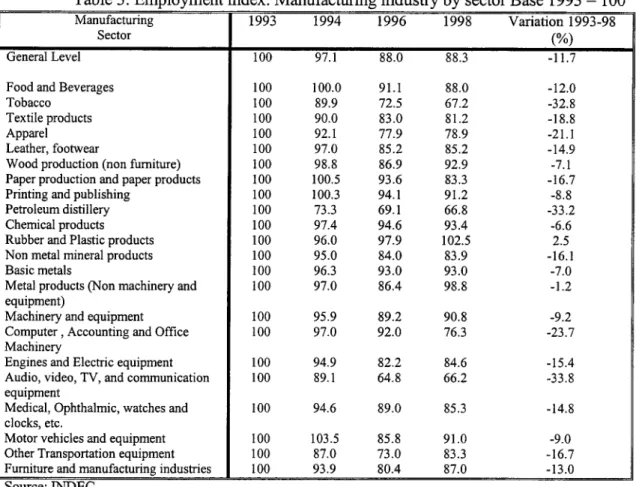
The impact of trade liberalization on industry employment was very significant. Figure 4 shows that the manufacturing sector was almost the on1y sector that suffered a large reduction in employment during the nineties. The employment performance of the manufacturing sector look even worse if it is compared with the performance of the rest of the economy with the exception of the electricity, gas and water sector which has been heavily affected by unrnanning as a result of privatization during the nineties.5. Note that between 1992 and 1996, approximately thirty percent of the net manufacturing employment was destroyed. As shown in Table 3 the fall in employment has taken place in most
manufacturing sectors. Now, as it will be suggested by the theoretical analysis presented in the next section, the impact of this fall in employment in industry on relative wages will depend on the degree of the relative skillness of labor in industry vis a vis the rest of the economy. Table 4 shows that, compared to the other sectors ofthe economy, the industry is relative intensive in low skilled and semi skilled labor.
Figure 4: Employment by sector: Employees Annual averages (miles)
('000) 1200 1100 Manufacturing sector 1000 2500 2300 2100
Social and Personal Services
/ -_.
__
.. _._ .. ⦅NセMM⦅N⦅@ ...._
... セLMMセM⦅O@/
,
/ /
900 1900 GMMセMMGMMセMMMMB⦅セMGMMセ⦅⦅G⦅セ⦅MGMMセMQ@
1986 1988 1990 1992 1994 1996 1998 1986 1988 1990 1992 1994 1996 1998
80 Electricity, Gas / .. セ@ and Water / .\
70 / \
60 ---'-.... / |セ@ .. ___________ - .. _-__
---UPGMMセセセセMセᅪMセMlセMlMセMQ@
350 Construction //
/
300 /
/'- /
250 BLセN@ ,--_____ . __ MMMMMMMセNMG@
, /
200
"--1986 1988 1990 1992 1994 1996 1998 1986 1988 1990 1992 1994 1996 1998
950
Trade, Hotels and "
Restaurants / , / ___ •.• ---.... ---..--... セB@ 850
750
セOON⦅NMN⦅M
650 GMMMBMMMGMセMMGMセMGMセMMGMセMMGMMセMMG@
500
Transpor! and Communications ,.//
450 _
OOセMMM
/,/ .._---
---""---../ 400350
1986 1988 1990 1992 1994 1996 1998 1986 1988 1990 1992 1994 1996 1998
500 Bussines and Financiai Services
400
Prirnary Sector / \ ,/"",
/----// '\/
セN⦅N⦅MMMM
/' year
50
40
SPPGMMセセセセMセMGMMセMlセMlMセセ@ 30
1986 1988 1990 1992 1994 1996 1998 1986 1988 1990 1992 1994 1996 1998
Table 3: Employment index: Manufacturing industry by sector Base 1993 = 100
Manufacturing 1993 1994 1996 1998 Variation 1993-98
Sector (%)
General LeveI 100 97.1 88.0 88.3 -11.7
Food and Beverages 100 100.0 91.1 88.0 -12.0
Tobacco 100 89.9 72.5 67.2 -32.8
Textile products 100 90.0 83.0 81.2 -18.8
Apparel 100 92.1 77.9 78.9 -21.1
Leather, footwear 100 97.0 85.2 85.2 -14.9
Wood production (non fumiture) 100 98.8 86.9 92.9 -7.1 Paper production and paper products 100 100.5 93.6 83.3 -16.7
Printing and publishing 100 100.3 94.1 91.2 -8.8
Petroleum distillery 100 73.3 69.1 66.8 -33.2
Chemical products 100 97.4 94.6 93.4 -6.6
Rubber and Plastic products 100 96.0 97.9 102.5 2.5 Non metal mineral products 100 95.0 84.0 83.9 -16.1
Basic metaIs 100 96.3 93.0 93.0 -7.0
Metal products (Non machinery and 100 97.0 86.4 98.8 -1.2 equipment)
Machinery and equipment 100 95.9 89.2 90.8 -9.2
Computer , Accounting and Office 100 97.0 92.0 76.3 -23.7 Machinery
Engines and Electric equipment 100 94.9 82.2 84.6 -15.4 Audio, video, TV, and communication 100 89.1 64.8 66.2 -33.8 equipment
Medicai, Ophthalmic, watches and 100 94.6 89.0 85.3 -14.8 clocks, etc.
Motor vehicles and equipment 100 103.5 85.8 91.0 -9.0 Other Transportation equipment 100 87.0 73.0 83.3 -16.7 Fumiture and manufacturing industries 100 93.9 80.4 87.0 -13.0 Source: INDEC
Table 4: Factor intensity in Argentina in the 90s
1993 1994 1995 A verage 1993-95
Share unskilled (%)
Total Economy 78.4 78.0 75.4 77.3
Total Economy but the 76.1 76.2 73.4 75.2
manufacturing sector
Manufacturing sector 86.2 84.9 83.1 84.7
Services sector 69.7 68.9 66.1 68.2
Notes: Unskdled workers compnse the group of unskdled and seml-skdled workers, that IS, those workers that
completed at most secondary school.
Certainly, it seems difficult not to relate at least part ofthe indicated absolute (and
even higher relative) fall in manufacturing employment to the process oftrade liberalization
during the nineties given that it is this sector the only one that has heavily faced foreign
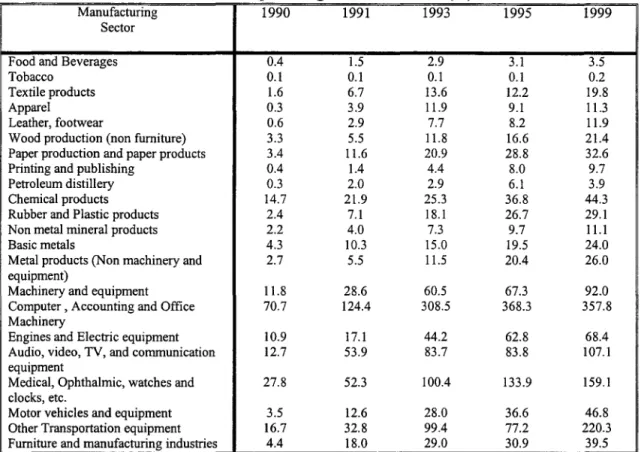
competition during this period. In this respect, Table 5 shows that since 1990 most
manufacturing sectors faced a significant rise in the import penetration indicator calculated
as the ratio ofimports to value added. For the industry as a whole the value ofthis variable
rose from 5.7 percent in 1990 to 19 percent in 1998.
Table 5: Import penetration c1assified according to the Standard Intemational Trade Classification (SITC), revision 3.
Ratio of imports to gross value added (%)
Manufacturing 1990 1991 1993 1995 1999
Sector
Food and Beverages 0.4 1.5 2.9 3.1 3.5
Tobacco 0.1 0.1 0.1 0.1 0.2
Textile products 1.6 6.7 13.6 12.2 19.8
Apparel 0.3 3.9 11.9 9.1 11.3
Leather, footwear 0.6 2.9 7.7 8.2 11.9
Wood production (non fumiture) 3.3 5.5 11.8 16.6 21.4 Paper production and paper products 3.4 11.6 20.9 28.8 32.6
Printing and publishing 0.4 1.4 4.4 8.0 9.7
Petroleum distillery 0.3 2.0 2.9 6.1 3.9
Chemical products 14.7 21.9 25.3 36.8 44.3
Rubber and Plastic products 2.4 7.1 18.1 26.7 29.1
Non metal mineral products 2.2 4.0 7.3 9.7 11.1
Basic metaIs 4.3 10.3 15.0 19.5 24.0
Metal products (Non machinery and 2.7 5.5 11.5 20.4 26.0 equipment)
Machinery and equipment 11.8 28.6 60.5 67.3 92.0
Computer , Accounting and Office 70.7 124.4 308.5 368.3 357.8 Machinery
Engines and Electric equipment 10.9 17.1 44.2 62.8 68.4 Audio, video, TV, and communication 12.7 53.9 83.7 83.8 107.1 equipment
Medicai, Ophthalmic, watches and 27.8 52.3 100.4 133.9 159.1 clocks, etc.
Motor vehicles and equipment 3.5 12.6 28.0 36.6 46.8
Other Transportation equipment 16.7 32.8 99.4 77.2 220.3 Fumiture and manufacturing industries 4.4 18.0 29.0 30.9 39.5
Source: Own calculatlon based on data provlded by Cepal and partIy pubhshed fi Kosakoff et aI (2000).
Unfortunately, the evaluation ofthe relationship between change in employment and
import deepening is dampened by the lack of comparable data before 1993 (for the
is a positive association between fall in employment and import competition. For example, in textiles the important fall in employment (18.8 percent between 1993 and 1998) coincides with a significant increase in the degree of import penetration in that sector (from 12 percent to 19 percent). A similar relationship is found for other sectors, however, the petroleum distillery sector shows the strongest fall in employment (33 percent) even though it faced a constant and very low leveI of foreign competition during the period. Nevertheless, this sector has been heavily affected by unrnanning as a result ofprivatization during the nineties6. The lack of a strong evidence relating foreign competition and employment suggest that, beyond the indicated problem regarding the availability of comparable data, other factors beyond trade might have played a significant role in shaping employment. This is not surprising and a key candidates are wage adjustment, unrnanning and labor augmenting technological progresso
But, beyond what other forces that may have affected employment and wages in the industry, if we still want to keep trade liberalization as part of the explanation we have to look at other complementary piece of data. That is, we have to find evidence that both the increase in imports and the decline in employment and production in industry are associated with changes in relative prices, in terms, induced by the trade liberalization measures. Moreover, as pointed out by Richarson (1995) there are many reasons why trade flows may increase and job in industry to fall. Still the fall in industry relative price is the only way we can related trade openness with the observed increase in the wage premium of skilled labor.
Now when facing the challenge of the "price test" is when most studies done for developed countries ended up concluding that openness is not, afier all, a significant force behind the observed deterioration in unskilled wages (see Lawrence (1994), Lawrence and Slaugter (1993), Sachs and Shatz (1994)). In performing this analysis researchers have had problems for gathering the right price data, as well as there has been some disagreement of what prices to include and how to measure relative prices. We encounter similar problems when analyzing the argentine data. On one
hand there is not a unique data set ofindustrial prices that covers the whole 1988/1999 period. We have one data set starting in 1980 (the ISIC version two) that ends in 1995 and another that starts in
1993 (the ISIC version three). Both have different commodity definition at two-digit leveI.
When we evaluate industry relative prices (in tenns ofthe GDP deflator) we find a clear trend of
Figure 5. Manufacturing sectors prices
(relative to GOP deflator) 1984M1995
1 . 7 r - - - _ ,
1.5 -1-_ _ _ _ _ _ _ _ _ _ _ _ _ _ _ _ _ _ _ _ _ _ _ _ -1
1.3 - I - - - " 7 f - - - " ; - - - / - - - \ - - - 1
--+-Food Beverages and Tobacro
-a-Textils, Apparel and Leather
Wood and wood products (including
fumitures)
1.1 KMセセセ⦅]ZZZセMMBMM⦅⦅⦅Zセ]セセセセMMM|MMMMMMMMMM⦅i@ """-*_Paperand paperproducts, Printing
0.9 BfNZZZZZZZZZエ]SZ[ZZZZWBGセMMMMBG⦅⦅Ztセ⦅ZZ⦅MMMGMMWZZセセセZZZZZZ⦅⦅MMセOMMMGQ@
0.7 KMMMMMMM]MMMMMMセセMM]MMZZZZZZZZZセセセ]]セZ[[Z[セ⦅⦅⦅j@
0.5 -I---..::::::::II==-==---=--I
0.3.f--_ _ M⦅MセM⦅M⦅M⦅M⦅MM⦅M⦅M⦅M⦅MMェ@
1984 1985 1986 1987 1988 1989 1990 1991 1992 1993 1994 1995
and Publishing
--*-Chemicals and Petroleum
derivatives
---&-Non metal mineral products
-+-Basic metal products
Figure 6. National product prices (relative to imported
products) Manufacturing sectors 1981 =1
1.6,--m .. -.. m--.. -... -m.- _____ . ______ . __ m __ ._m __ ... ______ .. __ . __ ·· ... __ ... _._.m_ .. __ ._ .. ___ ,
1.4 KMMセセセセセMGMセセMセセセMMMLMMᄆャイセセセセMMセセセMMMゥ@
1.2 KMMセセセセセセセセMMMMKMZMMNZ@
1.0
-N.-:'Iit--r----:---::-=---tt-0.8
0.6
0.4
0.2
0.0
J J J J J J J J J J J J
ul- ul- ul- ul- ul- ul- ul- ul- ul- ul- ul-
ul-84 85 86 87 88 89 90 91 92 93 94 95
__ Wood
-'e-Paper
Chemical products
·--)-!-Industrial chemicals
__ OIher chemical products
__ Basic metal products
-+-Iron and steel
-er-Nonferrous metais
-Metal products. ュ。」ィゥョ・セ@
and equipment
Non electric machinery
Electric machinery
Table 5
Correlations
Spearrnan's rho RELPRlCE Correlation Coefficient Sigo (2-tailed)
N
MY Correlation Coefficient
Sigo (2-tailed) N
XY Correlation Coefficient
Sigo (2-tailed) N
*. CorreJation is significant at the .05 levei (2-tailed). **. CorreJation is significant at the .01 levei (2-tailed).
RELPRlCE MY XY
1.000 -.196* .103
.017 .216
147 147 147
-.196* 1.000 .258**
.017 .002
147 147 147
.103 .258** 1.000
.216 .002
147 147 147
Thus we find a negative and significant correlation between prices change and import penetration, which suggests that import penetration have affected relative prices of industry during the period under analysis. In particular, higher penetration of imports is associated with lower domestic relative prices. AIso the positive and significant value for the correlation between export and import penetration suggest that trade liberalization has implied a significant increase in intra-industry trade.
4. Wage inequality and trade: theory
Many studies have looked at the relationship between trade liberalization and wage inequality using the well-known Heckscher-Ohlin (HO) theory. In particular they have considered a simple formulation with two factors ofproduction (skill and unskilled labor) and two traded manufactured goods, one that uses intensively skilled labor (i.e machinery) and other employing intensively unskilled labor (i.e apparel).
Under the assumption of full employment and product diversification, the HO model can be used to derive the Stolper Samuelson (SS) hypothesis. This hypothesis has been expressed in various forms (see Deardoff (1994». For our purpose, it could be convenient to bring in what Deardoff called the "essential version": ... "an increase (decline) in the relative price of a good rises (decreases) the real wage ofthe factor used intensively in producing that good and lowers (rise) the real wage ofthe other factor".
Then if trade liberalization causes a decline in the relative price of the labor unskilled good, then wages of that type of labor will decline relative to skilled. This very simple prediction has been applied to understand the recent trends in some developed countries in which coincidentally with a rapid increase in imports of low skill products from the developing world, there has been a strong rise in wage differential in favor of skilled workers (see Wood 1994, Sachs and Shatz, 1994, Leamer 1994, 1995).
as a consequence of the change in products reI ative prices. This is due to the assumption of perfect1y mobility of factors of production across sectors of the economy. As we have shown before, the rapid and significant increase in the rate of unemployment during the period of reform, in particular that of the unskilled workers, suggest that Argentina has been going through a transitional period where the reallocation of labor across sectors has not been completed.
Two features of the argentine labor market can be brought in to explain this. One is the assumption that there is an industry specific component in labor productivity which is lost when workers move from one sector to the other; second, the presence of labor unions which gives certain short-term rigidity (specially downward) in the movement of real wages. We are going to assume that both the sector-specificity component of labor productivity and the presence of labor unions vary across type of labor. In particular, evidence suggest that low skilled labor is immobile and has stronger unions compared to skilled workers.
Thus consider a very simple model with two final traded industrial products (goods 1 and 2) and services (good 3). We will assume that the two traded industrial goods are intensive in low skilled labor while services used intensively skilled labor. We assume that unskilled labor is a fixed factor in each sector while skilled labor is perfect1y mobile. Finally preferences are described as a usual Cobb-Douglas function. The solution of such a model gives rise to the following expressions for the unskilled wage in each sector,
good one, so p1=1). Perfect mobility of skilled labor across sectors implies that wages for this type of labor is equal across industries,
And total demand of skilled labor equals total supply. Finally the model is c10sed with the equilibrium condition corresponding to the demand and supply of the service sector that determines p3,
Where U3 equals the coefficient ofthe service good in the Cobb-Douglas utility function.
Using (1)-(3) we can derive an implicit expression for the relative wages in the economy,
reI = Wu =
(/0
+ f2(.) + f\·)) _ LsWs wsLu Lu
We are interested in explore the one particular static comparative analysis which is the effect of a reduction in the price of one of the industrial product, say p2, on the relative wage,
In general terms the above results will have an undetermined signo Nevertheless, under the assumption that industry is intensive in unskilled labor compared to services, the direct and positive effect of a change in price on sector 2 output will prevail on the
indirect, general equilibrium effect, of the change in the this price on the production of the other two sectors (which will have the opposite sign) and on the equilibrium wage of skilled labor (which will be positive).
Thus, a decline in the price of sector 2 price, will reduce the unskilled wage paid in that sector and of course will reduce the average unskilled wage paid in the economy. Figure 7 illustrates this result. On the left side origin we measure the labor demand of skilled labor in industry while on the right hand side we measure labor demand of skilled labor by services. As usual the equilibrium wage for skilled labor is determined where the aggregate demand for unskilled labor in industry cuts the labor demand for services. In the graph we show the indicated decline in P2 which as a consequence of the fact this factor is not used intensively in this sector generates a small decline in skilled wages across the economy. Nevertheless as shown, the decline in the payments to the fixed unskilled factor (measured as the are under the labor demand above Ws) is much more significant.
In presence of wage rigidity due to labor unions the above adjustment to a reduction of prices will take place, in part, through an increase in the rate of unemployment of unskilled labor in the relevant sector.
Now so far we have emphasized that trade liberalization can be seen as affecting (reducing) direct1y the prices of industry through the reduction of tariffs and other barriers to trade. Still, thinking in our empirical application for Argentina, we must consider the possibility that, at least in the short run, the law of one price fails to prevail and so domestic prices cannot capture entirely the effect of foreign competition on domestic industry7. Thus, we will allow the labor demand in figure 7 to depend directly on trade flows. Finally, a very important factor that has been emphasized in the literature
7 At the same time, domestic prices will also pick up another factors beyond trade
is technological progresso This of course will also shifi the labor demand curves in Figure 6 and we will try to control for this factor using both year and sector specific dummies.
5. An empirical test of the impact of trade on wage inequality using micro data
In this section we study whether the deepening of trade liberalization has had any identifiable impact on the distribution of wages. Specifically, we test, using micro data, whether or not those manufacturing sectors where import penetration relative to the gross value added deepened are, ceteris paribus, the sectors where a higher increase in wage inequality by skill group occurred. As we have seen in section 3, the degree of import penetration has largely increased in most manufacturing sectors during the nineties. What is more, the rise in foreign competition was not uniform across sectors. Thus, we are able to investigate whether, afier we control for several individual characteristics, it is the case that relative wages widened comparatively more in those sectors that faced strongest competition from foreign markets.
Hence, in order to test the hypothesis that import penetration plays a role in shaping wage inequality we estimate the coefficients of the following regression function:8
Log( wijt)
=
I
dSijgt agt +I
dSijgt m jt agm +I
dtijct tPct +J;
(ageijt)+ dsexijt CPt + Ct + J.lj + uijt (1)g_1 g c_I
where dSijgt is a dummy variable that indicates schooling group g in period t, and agt is a schooling effect in period t; mjt is the logarithm of the ratio of imports to gross value
added in the manufacturing sector j in period t. dtijct is a dummy variable that indicates tenure group and rPct is the tenure effect in period t. The tenure groups are: (0,1), [1,5), [5,10), [10,20) and [20,20+) . .ft(ageiJ is a non-linear function ofthe age ofindividual i in
the intercept in period t (the period effect); )lj is the sector fixed-effect, and uijt is the
error term for individual i working in sectorj during period t.
The dependent variable is the logarithm of the hour1y eamings of the sampled individuaIs in their main occupations. The schooling groups are the unskilled group, the semi-skilled group and the skilled group defined in section 2. The micro data comes from the household survey for the period 1992-1999 for both waves of the year. Thus, the period effect refers to the wave-year effect. The data on imports, exports and value added by sector at the two digit leveIs is taken from the Argentine Intemational Trade Commission.
We estimate equation (1) by sampling only the workers of the manufacturing sector because they are the only group of workers for which the measure of import penetration adopted presents variability. It needs to be reemphasized that our objective is to test whether there is any identifiable impact ofimport penetration on wage inequality.
Thus, under the specification adopted for our test, the schooling group g wage
premium in sector j in year t is given by WPjgt = 100 [Exponential( CXgt
+
(CXgm - abm) mjt) -1], where abm is the estimated coefficient in the regression function 1 for the educational base category. Consequently, the set of CXgm are the parameters of interest in our study.Given our hypothesis, that is, that the relative wages widened comparatively more in those activities that faced strongest competition from foreign markets and the evidence gathered in section 2, we expect the difference among the coefficients of the skilled group and the other two skill groups to be positive. Additionally, we may also expect these two differences to be statistically similar.
Note that our estimate of the impact of import penetration on wage inequality are not necessarily an estimate of the whole effect of the former on the latter, that is, it is not necessarily an estimate of the general equilibrium effect which may not be identifiable. For example, if trade liberalization shifts labor demand against the unskilled in some
manufacturing sectors and labor is highly mobile, it would be the case that the wages of the unskilled workers are adjusted in every sector of the economy and hence, the correlation between the degree of import penetration and wage differentials by sector vanishes. However, as we shown in section 4, under certain technological conditions or rigidities in the adjustment of the economy, an increase in import penetration may widen income inequality relatively to the rest of the economy in the sectors affected. Our test evaluates the existence ofthese differential effects in the manufacturing sectors. Ifwe do not find any effect, it is still plausibly, at least theoreticalIy, that import penetration may be shaping wage inequality. Instead, if we do find an effect from the degree of import penetration on wage inequality, this effect may not necessarily be an estimate of the general equilibrium effect: it would just be the identifiable effect.
Note the similitude of our regresslOn model and the wage curve mo deI of Blanchflower and Oswald (1994). We control both for period fixed-effect and sector-fixed effect. Thus, our model does not provide information about the leveI of wages by sector because we are conditioning our estimates on the sample means by sector. In our model the curve would be drawn in the plane of wage premium and sector import penetration instead.
It is worth noting that in the specification of the regression function (1) we control for any aggregate shock that affect wages homogeneously. Thus, for example, if inflation affects alI wages in the same way, it would be captured by the period effect (for instance, the same would be true for the technological change). If instead inflation, or any other aggregate variable, affects wages differently by skilI group, it would be captured by the wage premium that we alIow to vary by period. The Iatter is an important feature of the specification adopted that makes justice to the altemative hypothesis of our test. Thus, the
set of parameters CXgm should only capture the impact on wages of the sector import
penetration.
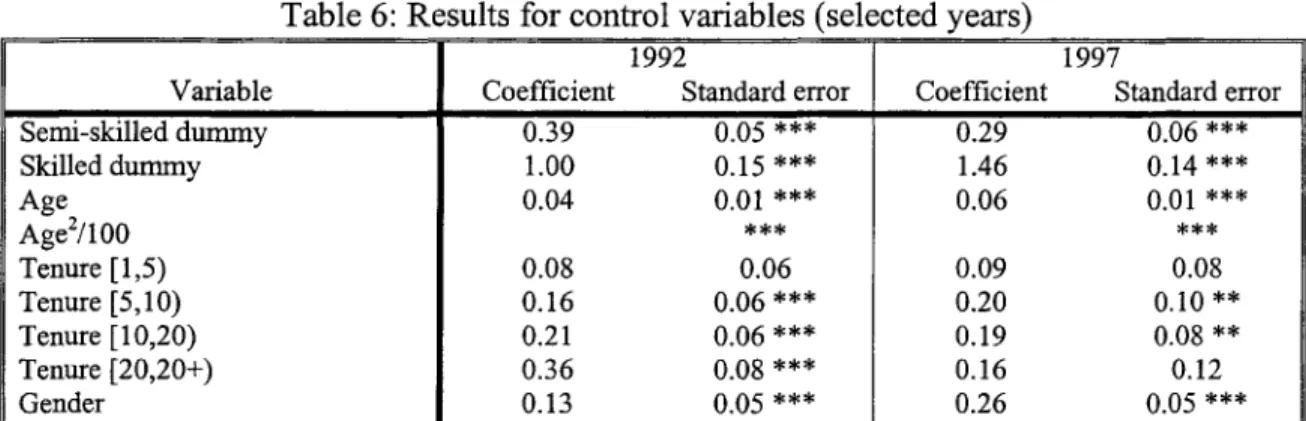
coefficients are as expected. Wages increase with the education leveI, age and tenure. Both the age and tenure pro files look familiar and to some extent they appears to be stable during the period studied. There is also a typical male wage premiurn that has risen during the period studied. The skilled wage premiurn has also increased on average during the period studied.
Table 6: Results for control variables (selected years)
1992 1997
Variable Coefficient Standard error Coefficient Standard error
SemÍ-skilled dummy 0.39 0.05
***
0.29 0.06***
Skilled dummy 1.00 0.15
***
1.46 0.14***
Age 0.04 0.01
***
0.06 0.01***
Agé/100
***
***
Tenure [1,5) 0.08 0.06 0.09 0.08
Tenure [5,10) 0.16 0.06
***
0.20 0.10**
Tenure [10,20) 0.21 0.06
***
0.19 0.08**
Tenure [20,20+) 0.36 0.08
***
0.16 0.12Gender 0.13 0.05
***
0.26 0.05***
..Notes: The coefficlents correspond to the October wave ofthe survey for each year. *** lfthe coefficlent IS statlstlcal1y
different from zero at the one percent significance leveI. ** if the coefficient is statistical1y different from zero at the five percent significance leveI.
Table 7 presents the estimated coefficients of the pararneters of interest. Additionally, it presents the results of successively enlarging the model by adding the interaction of the school durnrny variables with the logarithrn of the ratio of the exports of the sector to its gross value added and the logarithrn of the relative price of the sector to the aggregate price level. The reported standard errors are consistent standard errors although the errors in the regression function (1) may lack independence. In particular, they are robust to the problem of random group or cluster effects in the data (cf. e.g. Huber, 1967 and Moulton,
1986).
in those manufacturing sectors where the import penetration increased the most, wage inequality also widened relatively more in favor of the most skilled workers. The difference in the education coefficient in favor of the skilled group is confirmed by the F test we perform in table 8. On the other hand we do not detect any statistically significant difference between the two other low educational groups. Therefore, we have shown that the difference of the coefficients of the skilled group and any other group is positive and statistically significant.
Table 7: Coefficients (standard errors) oftrade variables on wages by skiU group
Variable Coefficient Robust Coefficient Robust Coefficient Robust
standard standard standard
error error error
Unskilled dummy * import 0.067 0.035 ** 0.067 0.035 ** 0.068 0.037 * penetration
Semi-skilled dummy * 0.060 0.035 * 0.062 0.035 * 0.061 0.038 * import penetration
Skilled dummy * import 0.125 0.048 *** 0.121 0.047 *** 0.139 0.050 *** penetration
Unskilled dummy * export 0.000 0.026 -0.019 0.024
ratio
Semi-skilled dummy * 0.007 0.026 -0.004 0.027
export ratio
Skilled dummy * export 0.071 0.047 0.035 0.051
ratio
Unskilled dummy * 0.000 0.001
relative prices
Semi-skilled dummy * 0.000 0.002
reI ative prices
Skilled dummy * reI ative 0.003 0.002
prices
Table 8. Test F for equality of coefficients
test edu1 ap2d = edu3ap2d
F( 1, 174) = 3.33 F( 1, 174) = 3.03 F( 1, 146) = 4.80
Prob>F= 0.0698 Prob>F= 0.0834 Prob>F= 0.0300
test eduLapLd ...; edu3ap2d
F( 1, 174)
=
4.15 F( 1, 174) = 3.56 F( 1, 146) = 6.07Prob>F= 0.0431 Prob>F= 0.0609 Prob>F= 0.0149
test edu1ap2d = edu2ap2d
F( 1, 174) = 0.28 F( 1, 174) = 0.18 F( 1, 146) = 0.21
Prob>F= 0.5969 Prob>F= 0.6720 Prob>F= 0.6506
Consequent1y, we find that there is scope for trade liberalization to explain the increase of the skilled group wage premium during the 90s. Thus, at least partially, the aggregate trends on wage differentials we presented in section 2 may be explained by the impact on trade liberalization on wages. However, the identified effect of trade liberalization on wage inequality does not explain much even though the average (weighted by employment) imports to sector value added increased approximately 80 percent during the period studied. Hence, for example, the average identifiable increase in the skilled wage premium due to trade liberalization in the manufacturing sector is approximately 5 percentage points which is only 10 percent of the increase in the skilled wage premium during the same period.
VI. Concluding remarks.
In this paper we investigated the relationship between trade openness and wage inequality. There are a priori ground to think this relationship has been present in Argentina given the fact that, as we showed, the wage of skilled labor (college graduates) has been rising since the beginning of the nineties, coincidentally with the implementation of the trade liberalization policies.
To study this relationship we combined aggregate data compiled at the industry leveI with micro-data coming from household surveys. This approach allows us to define skilled labor in terms of precise educational categories and more important we can control for a number of individual characteristics (sex, age, work experience, etc.) that also affect wages and which cannot taken into account when working with data at industry leveI. In terms of educational attainrnent, we work with three categories: unskilled (those individuaIs who at most have attend high school but have not finished it), semÍ-skilled (those that just finished high school) and skilled workers (those that finished a tertiary degree).
References
Berman, E., Bound J. and Griliches, Z. (1994): "Changes in the demand for skilled labor within U.S. manufacturing industries: Evidence from the Annual Survey of Manufacturers", Quarterly Journal of Economics, vol. 109, pp. 367-97.
Berlinski (1999): EI Sistema de Incentivos en la Argentina (de la liberalización unilateral aI Mercosur). Instituto Di Tella, Serie Seminarios No 13 1998.
Bound, J., and G. Johnson (1992): "Changes in the structure of wages in the 1980s: An evaluation of altemative explanations", American Economic Review, vol. 82, pp. 371-92.
Buchinsky, M. (1994): "Changes in the U.S. wage structure 1963-1987: Applications of quantile regression", Econometrica, vol. 62, pp. 405-58.
Burtless, G. (1995): Intemational Trade and the Rise in eamings Inequality. Joumal of Economic Literature, Vol XXXIII, pp. 800-816.
Cristini, M. (1999): Apertura Economica, Politica Comercial y la Distribucion deI Ingreso: Que aporta el caso Argentino aI Debate?
Galiani, S. (1999): "The differential evolution ofwages, job stability and unemployment", mimeo, Oxford.
Griliches, Z. (1977): "Estimating the retums to schooling: Some econometric problems", Econometrica, vol. 45, pp. 1-22.
Goldin, C. and Margo, R. (1992): "The great compression: the wage structure in the United States at rnid-century", Quarterly Journal ofEconomics, vol. 107, pp. 1-34.
Hanson, G. and Harrison, A. (1994): "Trade, Technology and Wage Inequality: Evidence from Mexico". Mimeo.
Johnson, G. and Stafford, F. (1999): "The Labor Market Implications ofIntemational Trade". In Handbook ofLabor Economics, Vo13, edited by O. Ashenfelter and D. Cardo Elsevier Science.
Juhn, c., Murphy, K. and Brooks, P. (1993): "Wage inequality and the rise in retums to skill", Journal of Political Economy, vol. 101, pp. 410-42.
Katz, L., Loveman, G. and Blanchflower, D. (1995): "A comparison of changes in the structure ofwages in fOUI OECD countries", in Freeman and Katz (eds.): Differences and changes in wage structures, The University of Chicago Press.
Katz, L., and Murphy, M. (1992): "Changes in relative wages, 1963-1987: Supp1y and demand factors", Quarterly Journal of Economics, vol. 107, pp. 35-78.
Kosacoff, B. (2000). El Desempeno Industrial Argentino: Mas Alla de la Sustitución de Importaciones. CEPAL.
Krugman, P. and Lawrence, R. (1993): Trade, Jobs and Wages. National Bureau of Economic Research,
WP No 4836.
Leamer (1984): "Sources ofIntemational Comparatiuve Advantage". Cambridge Press.
Leamer, E. (1994): "Trade, Wages and Revolving Door Ideas". National Bureau of Economic Research, WP No 4716.
Leamer, E. (1995): "A Trade Economist's View on US Wages and "Globalization"". Mimeo.
Richardson, J.D. (1995): Income Inequality and Trade: How to Think, What to Conc1ude. Joumal of Economic Perspectives, vol9, pp. 33-55.
Schmitt, J. (1995): "The changing structure ofmale eamings in Britain, 1974-1988", in Freeman and Katz (eds.): Differences and changes in wage structures, The University ofChicago Press.
Sachs, J. and Shatz, H. (1994): Trade and Jobs in U.S. Manufacturing. Brooking Papers on Economic Activity, vol1, pp. 1-84
Salustro, M. and Sanguinetti, P. (2000): EI Mercosur y el sesgo regional de la política comercial: aranceles y barreras no tarifarias. CEDI, mirneo.
Wood, A. (1994): "How Trade Hurt Unskilled Workers". Journal ofEconomic Perspectives vol9, pp. 57-80.
AGイG[BBGセBGGGGGャゥaMB[LLBM]GZGMG@ セイMG@ ;*.''
-J' B 1 [l ;. •. " ' ,', セZZ@ .'.
í.'i/\RIO HE;',':-l!C,:: ,";"ONSEN
, fuセjセaj@ gセゥᅵ@ セLGセセs@
lZセ■Eエセヲ@
J)
qセ■ウj@
f
FUNDAÇÃO GETULIO VARGAS
BIBLIOTECA
ESTE VOLUME DEVE SER DEVOLVIDO À BIBLIOTECA NA ÚLTIMA DATA MARCADA
N.Cham. P/EPGE SA S226w
Autor: Sanguinetti, Pablo.
Título: Wage inequality and trade liberalization : evidence 305084