Nº 520 ISSN 0104-8910
A new incidence analysis of Brazilian social policies using
multiple data sources
M arcelo Neri
A New Incidence Analysis of Brazilian Social Policies
Using Multiple Data Sources
1Marcelo Neri2
Introduction
Brazil is a country where the poorest 50% earn around 10% of its aggregate labor income
while the wealthiest 10% earn approximately 50% of total labor earnings3. The high degree of
labor income inequality has kept a substantial part of the population below the poverty line,
despite the relatively high per capita earnings observed. Consequently, the small share of total
GDP appropriated by labor is as worrisome as the degree of labor earnings inequality found in
Brazil. While most countries—with this data available—show that the share of total GDP
appropriated by labor corresponds to 2/3 of total GDP, in Brazil, this value is around 40%.
Almost every study on Brazilian income distribution uses information solely on income, and
in particular, on monthly labor earnings, so that the remaining 60% of income not
appropriated by labor is neglected, contributing to our ignorance about the degree of Brazilian
inequality.
The main task of this paper is to assess inequalities in terms of access to different social
policies in the 1996-2002 period. This means using a larger variety of welfare sources. A
related issue is to incorporate the effects of the provision of public goods and the so-called
social services, either public or private, in the assessment of the welfare level of the income
poor population.
A harder and more fundamental question not pursued here is the role played by capital
accumulation on the income generating potential of the poor. This would help to direct the
type of capital enhancing policies to implement. However, a decisive step in this direction is
to study the relationship between social policies and income distribution outcomes. The
incidence analysis will be structured under four headings:
Human capital (education and health)
Physical capital (housing credit)
1
I would like to thank the excellent research assistance by Helen Harris, Luisa Carvalhais, Samanta Montes and Hugo Simas. I would like to thank, comments by Fernando Blanco. This research was financed by the World Bank. All remaining errors are my own.
2
Center for Social Policy at IBRE/FGV and Assistant Professor at EPGE/FGV. 3
Public goods (infrastructure and public services)
Income Transfers (Minimum income, conditional cash transfers, pensions)
The two first categories are conceptually easier to quantify. One of the best examples
of successful applied empirical work in Brazil4. According to this literature, there exists a
strong link between education and distribution in Brazil: the variable completed years of
schooling explains between 35% to 40% of observed wage differentials. On the other hand,
the literature on the quality of education has been emerging within the Brazilian context.5. We
will devote a substantial section to education and to its relation to income distribution. Access
to health services, its prices and quality will be evaluated from the special supplements from
PNAD in 1998 and 1981.
The access to basic public goods and services, like water, sewerage, electricity,
communications, and public transportation are straightforward to measure using standard
household surveys. Once again, the main contribution is to combine public and private
aspects of the supply of these services.
The effects of private and public income transfers on poverty outcomes should not be
restricted to its impacts on mean per capita income (or mean unsatisfied needs) but include as
well its informal risk reduction function. Take the example of the family, the most basic unit
of organization and coordination: the contribution of the poor family’s cash remittances to
household welfare is certainly greater than the expected increase per capita permanent
income. This new source of income also helps to diversify risks of those that are close to their
surviving constraint. By the same token, the main contribution of institutions, such as
unemployment insurance and social security (especially the fully funded schemes), to social
welfare is probably not only redistributive but also reduces individual risks.
The biggest contribution of this study is to open new data sources for the incidence
analysis of the items mentioned above or to update the analysis for recent times. Following
the long established tradition of household surveys, in this paper we used the following
sources of microdata:
Pesquisa Nacional de Amostras a Domicilio - PNAD (an annual national
household survey). This is an annual household survey performed in the third quarter that
4
The assessment of returns to education and its main determinants, the provision of education as a public good, the evasion of children from school, education and inequality, the influences of community variables, has been analyzed in detail by innumerous studies in Brazil (see, in particular, the work of Ricardo Barros in the references).
5
interviews 100,000 households every year. It has been conducted by the Instituto Brasileiro de
Geografia e Estatística - IBGE since 1967.
This survey has extensive information on personal and occupational characteristics of
individuals. The PNAD has detailed information on the possession of durable goods and on
housing conditions since its start. It underwent a major revision between 1990 and 1992
increasing the size of the questionnaire from 60 to 130 questions. The new questionnaire,
available from 1992 onwards, has information on the value spend in rent and a series of new
public services were included in the questionnaire.
Pesquisa de Orçamentos Familiares - POF: This consumer expenditure survey
was performed only twice in 1987 and 1996 by the IBGE. It covers the eleven main Brazilian
metropolitan regions. Besides information regarding personal and occupational characteristics
of individuals, the survey has a very broad and disaggregated data on income sources,
consumption expenditures and on the importance of public and private social services impact
on households’ budgets.
Pesquisa Mensal do Emprego - PME: This monthly employment survey is
performed in the six main Brazilian metropolitan regions by the IBGE. It has covered an
average of 40000 monthly households since 1980 until 2002. This survey also has detailed
features on personal characteristics and labor earnings of all household members above ten
years of age, allowing us to calculate social welfare measures based on labor earnings. We are
innovative by presenting poverty evolution and per capita income distribution measures until
2002 (the last PNAD available is 2001), opening metropolitan areas into core and periphery.
Amostra dos Censos: We use the sample of Demographic Census for 1991 and
2000. One advantage is that the Census covers the whole country so other items captured by
PNAD and PPV such as access to public services, housing among others are represented at
the national level. The questions related to education including different levels (i.e. day care)
and special types of education (i.e. adult literacy programs) are beneficial aspects. Finally,
income categories—more modern than that of other household surveys—allow us to capture
the incidence of the new generation of Brazilian compensatory policies (e.g., bolsa-escola,
renda minima) and private income transfers.
Suplemento Especial sobre Saúde da PNAD: The PNAD Special Supplement on
Health (for 1981 and 1998) allow us to analyze in detail the incidence of access of health
2. Data Strategy for Incidence Analysis
The task of reducing poverty in a context of economic crisis observed in Brazil
during the last five years seems more imposing and challenging. In order to properly
assess policies that have been implemented and the effect of those expecting to come
into place, we must look at the efficiency of public social spending in all aspects of
society. By doing such, we are then capable of determining whether or not public social
spending has been well targeted and effective in achieving its goals. In undertaking this
task, we will analyze consolidated social spending, having as main categories income
deciles, per capita family income below half a minimum wage (or other program
eligibility criteria) and regional dimensions. As the databases stemming from the
household surveys are those belonging to larger samples and degrees of freedom, by
working with income deciles we do not need to commit to a single specific poverty line.
In reference to the project, we will provide an incidence analysis based on household
surveys, in accordance to the subjects listed in Table 28, in page 88, of the Bank’s
Report No. 20475-BR, “Attacking Brazil’s Poverty.”
With respect to the subcategories of education, we will use data found in the
Census. Through this data, we are capable of distinguishing between public and private
education at all school levels, from day care centers to higher education. We will also
complement this information with data derived from the PNAD. In the specific
subcategory of Adult Education/Training, we will only be able to capture adult
alphabetization programs.
In the following item, that of Universal Public Health Care, we will use
POF/IBGE to attain the amount of private spending on health care according to income
deciles. In order to obtain a deeper comprehension on this category, we shall also use
the PNAD 98 Special Supplement on Health, which provides a richer variety of
information. We will compare the data from the PNAD 98 Health Supplement with that
of the PNAD 81, thus establishing a temporal analysis before and after the 1988
Constitution that among other things promoted the universalization of health services.
In the next category, we again use both household surveys to attain a better grasp
and thus a deeper analysis. In the items related to Water and Sewer Connections, Urban
Public Transport and Housing, we are capable of capturing the total amount spent
according to income deciles through the POF. Access rates will be measured using
In the items pertaining to Pensions and Social Assistance Services, we hit an
impasse, as although we are capable of identifying social security payments, we are
unable of disentangling their origin, determining whether they were public or private.
However, we are successful in determining the specific groups receiving these transfers.
In particular, we are able to identify seniors (67 years of age or older) receiving BPC
(LOAS), disabled individuals and children. As such, our strategy is to evaluate the
amount of public transfers reaching each group, but not to discriminate the specific
programs these transfers originate from.
We will present a detailed description of each household survey structure and its
data used in the empirical exercises performed from an analytically based perspective.
The overall goal of this project will be to gauge how progressive is the incidence of past
3.Education
The following tables show the relationship between the distribution of income
(according to quintiles) and education. By providing this relationship throughout a
variety of years, we are able to capture the changes in education throughout time. We
can see that as income grows, so does the probability of staying in school, without being
held behind. Of all the years with data available, the year with the highest percentage of
children, between the ages of seven and fifteen, in school was 2001. This is perceived as
a result of Bolsa-Escola, the program within the Alvorada Project to increase attendance
in schools, improving education. This concept is supported by the fact that we see a
dramatic increase in the percentage of children from the lower quintiles of income
distribution, more so than that of the wealthiest quintiles.
Source: CPS/FGV based on microdata drom PNAD/IBGE.
Figure 1
% of Population in School or Day Care Center According to Income Quintiles (Ages 7-15)
50 55 60 65 70 75 80 85 90 95 100
1st 2nd 3rd 4th 5th
2001
1999 1997
1995
The probability of children attending school or a day care center, if those
children belong to the lower quintiles, shifted from 80.91% to 93.07% during the years
of 1995 to 2001. There was then a convergence in the education system, as can be seen
in Figure 1, since the gap between the wealthiest and poorest quintiles decreased
intensely, from a divergence of seventeen percentage points to one of six percentage
points. In Table 1, we see how the Bolsa-Escola program contributed to the increase in
school attendance. Table 1 shows the incidence analysis of school attendance for
children between the ages of seven and fifteen—the ages eligible for the Bolsa-Escola
cut-off point being those with more than half a minimum wage household income per
capita. From 1995 to 2001, the proportion of seven to fifteen year olds—belonging to
families with less than half one minimum wage family income per capita—in school
increased from 81.94% to 93.31%. The increase of the percentage of children in school
shows the success of Bolsa-Escola and other education targeting programs.
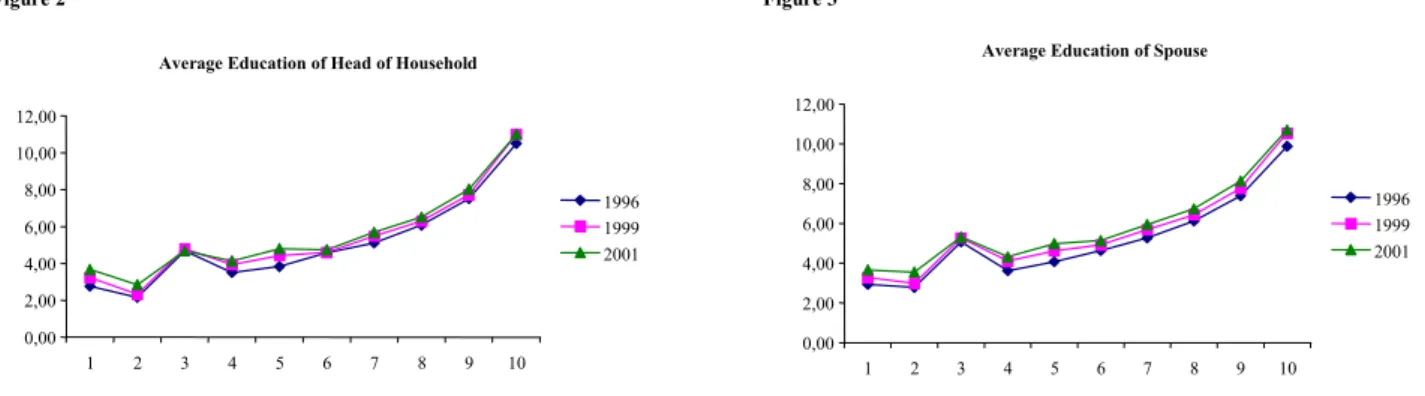
We also observe that the average education of the household’s head has also
increased, specially in the poorer half of the population, as can be noticed from Figure
2. Figure 3 shows similar results for the spouse of the household head, however, as is
noticed here, overall there is a greater variation between 1996 and 2001 in this category
than in head’s education level, captured consistently in the wealthiest half of the
population.
Figure 2 Figure 3
Source: CPS/FGV based on microdata from PNAD/IBGE Source: CPS/FGV based on microdata from PNAD/IBGE
Average Education of Head of Household
0,00 2,00 4,00 6,00 8,00 10,00 12,00
1 2 3 4 5 6 7 8 9 10
1996 1999 2001
Average Education of Spouse
0,00 2,00 4,00 6,00 8,00 10,00 12,00
1 2 3 4 5 6 7 8 9 10
1996 1999 2001
In accordance to Table 2, we observe that for almost every decile in all three
years of sampling, the spouse’s education was above that of the head. We also notice
that the variation coefficients for the lower deciles of the population are always greater
than those belonging to wealthier segments of the population. At times, the variation
coefficient of the first decile was almost three times as much as that of the tenth decile.
In addition to the growth in numbers of population attending school, we also
observe a decrease in the amount of children being left behind in school, an indicator of
school quality. Again we use the sample of children between seven and fifteen, as these
are the ones benefiting from Bolsa-Escola. As seen in Figure 4, there has been a
significant decrease in the percentage of children repeating the academic year and thus
being left behind. The most significant shift in the number of students behind in school
occurred from 1999 to 2001. During this period, all but the top quintile experienced a
significant fall in the repetition rate; it varied between seven and ten percentage points.
the most from the investment in the quality of education were the top four income
quintiles. In fact, the third quintile experienced a drop of almost twenty percentage
points in the proportion of children behind in school, while the first and fifth quintiles
experienced an eleven and a thirteen points drop, respectively.
Figure 4
Source: CPS/FGV based on microdata from PNAD/IBGE.
% of Population Behind in School According to Income Quintiles
0 10 20 30 40 50 60 70 80
1st 2nd 3rd 4th 5th
1995 1997 1999 2001
In terms of expenses devoted to education, we find that over the course of the
past four years, the government’s social expenditure on education has increased in gross
values.
Figure 5
Sources: SIAFI, TEM/FAT, BACEN, MPAS, MF/SRF, MF/STN, BNDES Elaboration: CPS/FGV
State's Social Spending on Education in R$
4.990 11.220
12.896
4.871 3.622
3.455
4.851 4.724
4.568 3.935
8.070
9.123
0
2.000 4.000 6.000 8.000 10.000 12.000 14.000
1998 1999 2000 2001
Culture and Education Expenses (exclusive of personnel)
Active Personnel
(Education)
Mandatory transfers to states and municipalities
However, in terms of percentages of GNP, it has shown a movement without pattern.
While mandatory transfers to states and municipalities (mainly FUNDEF) have
education has decreased, although the gross value went from R$3,935 million in 1998 to
R$4,851 million in 2001. A detailed disaggregated table of the components of these
three educational expenses is found in Table 3.
Sources: SIAFI, TEM/FAT, BACEN, MPAS, MF/SRF, MF/STN, BNDES Elaboration: CPS/FGV
Figure 6
State's Social Spending on Education as % of GNP
1,09%
0,45% 0,42%
0,38% 0,38% 0,47%
0,43% 0,43%
0,41% 0,95%
0,88
1,03%
0,00% 0,20% 0,40% 0,60% 0,80% 1,00% 1,20%
1998 1999 2000 2001
Culture and Education Expenses (exclusive of personnel)
Active Personnel (Education)
Mandatory transfers to states and municipalities
We are unable to tell whether private expenses in education have increased or
decreased over the course of the last four years. Currently, the only data available
providing this information is the 1995/1996 POF. By the time this paper is concluded,
the new POF—currently at the field level—will have been concluded, although not
released. For the sake of future reference, we provide the results from the 1995/1996
POF. In it, we find that as income grows, so does the proportion of education expenses
in relation to total expenses.
Source: CPS/FGV based on microdata from Pesquisa de Orçamento Familiar 1995/1996 IBGE
Figure 7
Education as % of Total Expenses
1,07%
1,60% 1,71% 1,79%
2,07% 2,31% 2,73%
3,33%
4,47% 4,60%
0,00% 1,00% 2,00% 3,00% 4,00% 5,00%
1 2 3 4 5 6 7 8 9 10
Table 1
Total Population Yes No Missing Total Population Yes No Missing
Total Population 100 95.42 4.57 0.01 Total Population 100 94.6 5.37 0.03
Household Income per Capita Household Income per Capita
Up to Half a Minimum Wage 100 93.31 6.68 0.02 Up to Half a Minimum Wage 100 92.04 7.92 0.03
Above Half a Minimum Wage 100 97.24 2.75 0.01 Above Half a Minimum Wage 100 96.34 3.63 0.03
Household Income per Capita 1999 Household Income per Capita Quintile
Up to Half a Minimum Wage 100 93.18 6.8 0.02 1st 100 91.58 8.38 0.04
Above Half a Minimum Wage 100 96.93 3.06 0.01 2nd 100 93.58 6.39 0.03
Household Income per Capita Quintile 3rd 100 95.32 4.66 0.02
1st 100 93.07 6.91 0.02 4th 100 97.19 2.8 0.01
2nd 100 95.12 4.88 . 5th 100 98.8 1.15 0.05
3rd 100 96.88 3.11 0.01 Head's Income Quintile*
4th 100 98.71 1.29 . 1st 100 91.48 8.49 0.03
5th 100 99.23 0.74 0.02 2nd 100 92.71 7.26 0.03
Head's Income Quintile* 3rd 100 95.36 4.61 0.03
1st 100 93.3 6.67 0.03 4th 100 97.44 2.55 0.01
2nd 100 95.02 4.98 . 5th 100 98.44 1.52 0.04
3rd 100 97.01 2.99 . Missing 100 92.97 7 0.03
4th 100 98.25 1.75 . Source: CPS based on microdate from PNAD 1999/IBGE.
5th 100 99.26 0.72 0.02 * In families with more than one child. these variables were accounted for more than once. in accordance to the number of children.
Missing 100 93.99 5.99 0.01
Source: CPS based on microdate from PNAD 2001/IBGE.
* In families with more than one child. these variables were accounted for more than once. in accordance to the number of children.
Incidence Analysis - School Attendance 1997 Brazil: Population Between 7-15 Years Old
Total Population Yes No Missing Total Population Yes No Missing
Total Population 100 91.59 8.38 0.03 Total Population 100 88.49 11.49 0.02
Household Income per Capita Household Income per Capita
Up to Half a Minimum Wage 100 86.98 13.01 0.01 Up to Half a Minimum Wage 100 81.94 18.06 0
Above Half a Minimum Wage 100 94.46 5.5 0.04 Above Half a Minimum Wage 100 92.47 7.5 0.03
Household Income per Capita 1999 Household Income per Capita 1999
Up to Half a Minimum Wage 100 86.98 13 0.01 Up to Half a Minimum Wage 100 82.02 17.97 0
Above Half a Minimum Wage 100 94.52 5.44 0.04 Above Half a Minimum Wage 100 92.59 7.38 0.03
Household Income per Capita Quintile Household Income per Capita Quintile
1st 100 86.17 13.82 0.01 1st 100 80.91 19.09 .
2nd 100 89.65 10.3 0.05 2nd 100 86.39 13.6 0.01
3rd 100 93.16 6.78 0.06 3rd 100 90.29 9.64 0.07
4th 100 96.28 3.7 0.02 4th 100 94.36 5.62 0.01
5th 100 98.15 1.84 0.01 5th 100 97.93 2.05 0.02
Head's Income Quintile* Head's Income Quintile*
1st 100 86.24 13.75 0.01 1st 100 81.13 18.87 .
2nd 100 88.04 11.91 0.05 2nd 100 81.62 18.38 .
3rd 100 92.56 7.42 0.01 3rd 100 89.05 10.91 0.04
4th 100 95.65 4.3 0.05 4th 100 94.04 5.91 0.05
5th 100 98.25 1.73 0.02 5th 100 97.58 2.42 .
Missing 100 90.05 9.9 0.05 Missing 100 86.83 13.15 0.02
Source: CPS based on microdate from PNAD 1997/IBGE. Source: CPS based on microdate from PNAD 1995/IBGE.
* In families with more than one child. these variables were accounted for more than once. in accordance to the number of children. * In families with more than one child. these variables were accounted for more than once. in accordance to the number of children.
Attends School or Day Care Center (%) Incidence Analysis - School Attendance 2001
Brazil: Population Between 7-15 Years of Age
Incidence Analysis - School Attendance 1999 Brazil: Population Between 7-15 Years of Age
Attends School or Day Care Center (%)
Attends School or Day Care Center (%) Incidence Analysis - School Attendance 1995
Brazil: Population Between 7-15 Years Old
Table 2
Total Population Yes No Missing Total Population Yes No Missing
Total Population 29772522 28408605 1360176 3741 Total Population 29647311 28045431 1593091 8789
Household Income per Capita Household Income per Capita
Up to Half a Minimum Wage 13776879 12854518 919785 2576 Up to Half a Minimum Wage 12041772 11083662 954048 4062
Above Half a Minimum Wage 15995643 15554087 440391 1165 Above Half a Minimum Wage 17605539 16961769 639043 4727
Household Income per Capita 1999 Household Income per Capita Quintile
Up to Half a Minimum Wage 12006577 11187771 816230 2576 1st 8469848 7756728 709620 3500
Above Half a Minimum Wage 17765945 17220834 543946 1165 2nd 6986825 6538479 446261 2085
Household Income per Capita Quintile 3rd 5538766 5279599 258050 1117
1st 11391868 10602580 786712 2576 4th 4811168 4676095 134820 253
2nd 7291329 6935741 355588 . 5th 3840704 3794530 44340 1834
3rd 4897043 4744388 152089 566 Head's Income Quintile*
4th 3628216 3581471 46745 . 1st 5496988 5028791 466550 1647
5th 2564066 2544425 19042 599 2nd 4775405 4427327 346563 1515
Head's Income Quintile* 3rd 4830207 4605898 222720 1589
1st 8656200 8076597 577239 2364 4th 4946738 4819908 126316 514
2nd 4731972 4496526 235446 . 5th 4394782 4326186 66762 1834
3rd 4409479 4277652 131827 . Missing 5203191 4837321 364180 1690
4th 3235743 3179199 56544 . Source: CPS based on microdate from PNAD 1999/IBGE.
5th 3119550 3096577 22374 599 * In families with more than one child. these variables were accounted for more than once. in accordance to the number of children.
Missing 5619578 5282054 336746 778
Source: CPS based on microdate from PNAD 2001/IBGE.
* In families with more than one child. these variables were accounted for more than once. in accordance to the number of children.
Total Population Yes No Missing Total Population Yes No Missing
Total Population 30480800 27916249 2555458 9093 Total Population 31167155 27579150 3582071 5934
Household Income per Capita Household Income per Capita
Up to Half a Minimum Wage 11712583 10187222 1523701 1660 Up to Half a Minimum Wage 11786760 9657697 2128516 547
Above Half a Minimum Wage 18768217 17729027 1031757 7433 Above Half a Minimum Wage 19380395 17921453 1453555 5387
Household Income per Capita 1999 Household Income per Capita 1999
Up to Half a Minimum Wage 11867128 10322456 1543012 1660 Up to Half a Minimum Wage 12099328 9924133 2174648 547
Above Half a Minimum Wage 18613672 17593793 1012446 7433 Above Half a Minimum Wage 19067827 17655017 1407423 5387
Household Income per Capita Quintile Household Income per Capita Quintile
1st 8643919 7448179 1194701 1039 1st 9211814 7453179 1758635 .
2nd 6925566 6208905 713408 3253 2nd 6348545 5484419 863579 547
3rd 5640618 5254677 382387 3554 3rd 6044841 5458054 582759 4028
4th 5080555 4891687 188047 821 4th 5061503 4776210 284657 636
5th 4190142 4112801 76915 426 5th 4500452 4407288 92441 723
Head's Income Quintile* Head's Income Quintile*
1st 5904442 5092179 811845 418 1st 5471243 4438865 1032378 .
2nd 4845066 4265628 577146 2292 2nd 4138567 3377907 760660 .
3rd 4882016 4519011 362448 557 3rd 6487244 5776907 707848 2489
4th 5064631 4844550 217781 2300 4th 5267130 4953349 311300 2481
5th 4679794 4597968 80983 843 5th 4837232 4720379 116853 .
Missing 5104851 4596913 505255 2683 Missing 4965739 4311743 653032 964
Source: CPS based on microdate from PNAD 1997/IBGE. Source: CPS based on microdate from PNAD 1995/IBGE.
* In families with more than one child. these variables were accounted for more than once. in accordance to the number of children. * In families with more than one child. these variables were accounted for more than once. in accordance to the number of children.
Incidence Analysis - School Attendance 1997 Brazil: Population Between 7-15 Years Old
Attends School or Day Care Center
Incidence Analysis - School Attendance 1995 Brazil: Population Between 7-15 Years Old
Attends School or Day Care Center Incidence Analysis - School Attendance 2001
Brazil: Population Between 7-15 Years of Age
Attends School or Day Care Center Attends School or Day Care Center
Table 3
Total Population Yes No Total Population Yes No
Total Population 100 45.58 54.42 Total Population 100 50.18 49.82
Household Income per Capita Household Income per Capita
Up to Half a Minimum Wage 100 58.38 41.62 Up to Half a Minimum Wage 100 65.16 34.84
Above Half a Minimum Wage 100 35 65 Above Half a Minimum Wage 100 40.4 59.6
Household Income per Capita 1999 Household Income per Capita Quintile
Up to Half a Minimum Wage 100 59.4 40.6 1st 100 66.86 33.14
Above Half a Minimum Wage 100 36.6 63.4 2nd 100 58.64 41.36
Household Income per Capita Quintile 3rd 100 47.39 52.61
1st 100 59.67 40.33 4th 100 35.94 64.06
2nd 100 48.61 51.39 5th 100 22.98 77.02
3rd 100 37.09 62.91 Head's Income Quintile*
4th 100 27.76 72.24 1st 100 64.33 35.67
5th 100 19.54 80.46 2nd 100 62.49 37.51
Head's Income Quintile* 3rd 100 51.03 48.97
1st 100 59.13 40.87 4th 100 40.24 59.76
2nd 100 49.49 50.51 5th 100 25.92 74.08
3rd 100 39.43 60.57 Missing 100 55.01 44.99
4th 100 30.15 69.85 Source: CPS based on microdate from PNAD 1999/IBGE.
5th 100 22.15 77.85 * In families with more than one child. these variables were accounted for more than once. in accordance to the number of children.
Neglected 100 49.52 50.48
Source: CPS based on microdate from PNAD 2000/IBGE.
* In families with more than one child. these variables were accounted for more than once. in accordance to the number of children.
Total Population Yes No Total Population Yes No
Total Population 100 54.32 45.68 Total Population 100 56.79 43.21
Household Income per Capita Household Income per Capita
Up to Half a Minimum Wage 100 69.48 30.52 Up to Half a Minimum Wage 100 70.13 29.87
Above Half a Minimum Wage 100 45.61 54.39 Above Half a Minimum Wage 100 49.6 50.4
Household Income per Capita 1999 Household Income per Capita 1999
Up to Half a Minimum Wage 100 69.44 30.56 Up to Half a Minimum Wage 100 70.21 29.79
Above Half a Minimum Wage 100 45.46 54.54 Above Half a Minimum Wage 100 49.24 50.76
Household Income per Capita Quintile Household Income per Capita Quintile
1st 100 70.67 29.33 1st 100 70.6 29.4
2nd 100 63.47 36.53 2nd 100 66.77 33.23
3rd 100 52.24 47.76 3rd 100 56.42 43.58
4th 100 41.91 58.09 4th 100 46.12 53.88
5th 100 28.33 71.67 5th 100 33 67
Head's Income Quintile* Head's Income Quintile*
1st 100 67.85 32.15 1st 100 69.01 30.99
2nd 100 67.42 32.58 2nd 100 69.74 30.26
3rd 100 54.97 45.03 3rd 100 60.33 39.67
4th 100 44.94 55.06 4th 100 48.17 51.83
5th 100 30.38 69.62 5th 100 35.04 64.96
Missing 100 60.4 39.6 Missing 100 63.01 36.99
Source: CPS based on microdate from PNAD 1997/IBGE. Source: CPS based on microdate from PNAD 1995/IBGE.
* In families with more than one child. these variables were accounted for more than once. in accordance to the number of children. * In families with more than one child. these variables were accounted for more than once. in accordance to the number of children.
Incidence Analysis - Academic Delay 1995 Brazil: Population Between 7-15 Years of Age
Population Behind in School (%) Population Behind in School (%)
Incidence Analysis - Academic Delay 1997 Brazil: Population Between 7-15 Years Old Attending School
Population Behind in School (%) Incidence Analysis - Academic Delay 1999
Brazil: Population Between 7-15 Years Old Attending School Population Behind in School (%)
Table 4
Total Population Yes No Total Population Yes No
Total Population 28408605 12948635 15459970 Total Population 28045431 14074522 13970909
Household Income per Capita Household Income per Capita 11083662 7221684 3861978
Up to Half a Minimum Wage 12854518 7504993 5349525 Up to Half a Minimum Wage
Above Half a Minimum Wage 15554087 5443642 10110445 Above Half a Minimum Wage 16961769 6852838 10108931
Household Income per Capita 1999 Household Income per Capita Quintile 7756728 5186407 2570321
Up to Half a Minimum Wage 11187771 6645462 4542309 1st
Above Half a Minimum Wage 17220834 6303173 10917661 2nd 6538479 3833864 2704615
Household Income per Capita Quintile 3rd 5279599 2502012 2777587
1st 10602580 6326160 4276420 4th 4676095 1680369 2995726
2nd 6935741 3371668 3564073 5th 3794530 871870 2922660
3rd 4744388 1759550 2984838 Head's Income Quintile* 5028791 3235196 1793595
4th 3581471 994177 2587294 1st
5th 2544425 497080 2047345 2nd 4427327 2766787 1660540
Head's Income Quintile* 3rd 4605898 2350438 2255460
1st 8076597 4776060 3300537 4th 4819908 1939618 2880290
2nd 4496526 2225315 2271211 5th 4326186 1121407 3204779
3rd 4277652 1686827 2590825 Missing 4837321 2661076 2176245
4th 3179199 958520 2220679 Source: CPS based on microdate from PNAD 1999/IBGE.
5th 3096577 686030 2410547 * In families with more than one child. these variables were accounted for more than once. in accordance to the number of children.
Missing 5282054 2615883 2666171
Source: CPS based on microdate from PNAD 2000/IBGE.
* In families with more than one child. these variables were accounted for more than once. in accordance to the number of children.
Total Population Yes No Total Population Yes No
Total Population 27916249 15164927 12751322 Total Population 27579150 15661158 11917992
Household Income per Capita Household Income per Capita
Up to Half a Minimum Wage 10187222 7078189 3109033 Up to Half a Minimum Wage 9657697 6772909 2884788
Above Half a Minimum Wage 17729027 8086738 9642289 Above Half a Minimum Wage 17921453 8888249 9033204
Household Income per Capita 1999 Household Income per Capita 1999
Up to Half a Minimum Wage 10322456 7167611 3154845 Up to Half a Minimum Wage 9924133 6967843 2956290
Above Half a Minimum Wage 17593793 7997316 9596477 Above Half a Minimum Wage 17655017 8693315 8961702
Household Income per Capita Quintile Household Income per Capita Quintile
1st 7448179 5263720 2184459 1st 7453179 5262249 2190930
2nd 6208905 3940952 2267953 2nd 5484419 3662128 1822291
3rd 5254677 2745235 2509442 3rd 5458054 3079442 2378612
4th 4891687 2049906 2841781 4th 4776210 2203002 2573208
5th 4112801 1165114 2947687 5th 4407288 1454337 2952951
Head's Income Quintile* Head's Income Quintile*
1st 5092179 3454945 1637234 1st 4438865 3063186 1375679
2nd 4265628 2875721 1389907 2nd 3377907 2355900 1022007
3rd 4519011 2484113 2034898 3rd 5776907 3485187 2291720
4th 4844550 2177165 2667385 4th 4953349 2385952 2567397
5th 4597968 1396650 3201318 5th 4720379 1653997 3066382
Missing 4596913 2776333 1820580 Missing 4311743 2716936 1594807
Source: CPS based on microdate from PNAD 1997/IBGE. Source: CPS based on microdate from PNAD 1995/IBGE.
* In families with more than one child. these variables were accounted for more than once. in accordance to the number of children. * In families with more than one child. these variables were accounted for more than once. in accordance to the number of children.
Incidence Analysis - Academic Delay 1997 Brazil: Population Between 7-15 Years Old Attending School
Population Behind in School (%)
Incidence Analysis - Academic Delay 1995 Brazil: Population Between 7-15 Years of Age
Population Behind in School Incidence Analysis - Academic Delay 2001
Brazil: Population Between 7-15 Years Attending School
Population Behind in School
Incidence Analysis - Academic Delay 1999 Brazil: Population Between 7-15 Years Old Attending School
Table 5
Access to Assets in Brazil According to Income Deciles Education - 2001
Average Education of Head of Household Average Education of Spouse Variation Coefficient of Head's Education Variation Coefficient of Spouse's Education
1 3.68 3.67 1.06286 0.99918
2 2.84 3.55 1.16646 0.981035
3 4.67 5.31 0.93991 0.837498
4 4.13 4.32 0.80713 0.73271
5 4.80 4.98 0.72362 0.668531
6 4.74 5.14 0.77194 0.699975
7 5.68 5.95 0.65977 0.615229
8 6.52 6.74 0.60574 0.567204
9 8.02 8.14 0.52377 0.503188
10 11.01 10.71 0.4003 0.390601
Source: CPS/FGV based on microdata from PNAD/IBGE
Access to Assets in Brazil According to Income Deciles Education - 1999
Average Education of Head of Household Average Education of Spouse Variation Coefficient of Head's Education Variation Coefficient of Spouse's Education
1 3.23 3.27 1.15213 1.07245
2 2.31 2.97 1.31476 1.08288
3 4.78 5.27 0.9317 0.82757
4 3.94 4.10 0.82374 0.75904
5 4.43 4.62 0.75398 0.69548
6 4.59 4.92 0.75694 0.70119
7 5.49 5.69 0.66064 0.62505
8 6.29 6.44 0.61574 0.58664
9 7.73 7.77 0.54435 0.52238
10 11.00 10.54 0.41483 0.40682
Source: CPS/FGV based on microdata from PNAD/IBGE
Access to Assets in Brazil According to Income Deciles Education - 1996
Average Education of Head of Household Average Education of Spouse Variation Coefficient of Head's Education Variation Coefficient of Spouse's Education
1 2.77 2.94 0 0
2 2.15 2.77 1.241791 1.117886
3 4.67 5.07 1.347859 1.147263
4 3.52 3.62 0.9517895 0.871014
5 3.83 4.07 0.8743075 0.8212577
6 4.58 4.64 0.8448476 0.7766761
7 5.11 5.27 0.7456347 0.7196494
8 6.08 6.13 0.7030052 0.6653471
9 7.52 7.40 0.6410354 0.6152014
10 10.51 9.89 0.5668743 0.5511174
Table 6
R$ M % PIB R$ M % PIB R$ M % PIB R$ M % PIB
8) Culture and Education Expenses (exclusive of personnel)
3,455 0.38 3,622 0.38 4,871 0.45 4,990 0.42
Information Technology 4 0 2 0 31 0 67 0.01
Social Communication 7 0 6 0 9 0 11 0
Student Financing 182 0.02 298 0.03 968 0.09 513 0.04
Secondary Education and Professional Training
147 0.02 205 0.02 445 0.04 809 0.07
Professional Training 146 0.02 200 0.02 240 0.02 289 0.02
Secondary Education 0 0 5 0 205 0.02 521 0.04
Children Education 18 0 - - 14 0 135 0.01
Young Adults and Adults Educaition – Literacy and Supplement
35 0 30 0 41 0 284 0.02
Primary Education 1,674 0.18 1,452 0.15 1,670 0.15 1,187 0.1
Human Resources - - - - 6 0 15 0
Distance Learning 11 0 10 0 10 0 13 0
Textbooks, Publishing, Library and School Transportation
457 0.05 299 0.03 548 0.05 658 0.06
Acquisition of Spaces in Private Education
23 0 7 0 8 0 15 0
Other Basic Learning Activities 758 0.08 449 0.05 511 0.05 486 0.04 Transfers to States and Municipalities
(State Complement to FUNDEF)
425 0.05 685 0.07 587 0.05 476 0.04
Special Education 22 0 24 0 32 0 21 0
Higher Learning 1,284 0.14 1,503 0.16 1,504 0.14 1,773 0.15
Undergraduate 596 0.07 727 0.08 972 0.09 1,247 0.11
Graduate 38 0 73 0.01 40 0 40 0
Distance Learning - - - - 0 0 3 0
Scholarships 588 0.06 635 0.07 411 0.04 399 0.03
Medical Training and Health Education
58 0.01 60 0.01 70 0.01 75 0.01
College Extension 6 0 7 0 10 0 9 0
Research in Education - - - - 6 0 5 0
Culture – Diffusion and Patrimony 81 0.01 102 0.01 151 0.01 184 0.02
9) Active Personnel (Education) 3,935 0.43 4,568 0.47 4,724 0.43 4,851 0.41
10) Mandatory transfers to states and municipalities
8,070 0.88 9,123 0.95 11,220 1.03 12,896 1.09
15% of FPE/FPM/IPI Exp./Lei Compl. 87 – Part of FUNDEF
4,039 0.44 4,655 0.48 5,241 0.48 6,000 0.51
10% of FPE/FPM/IPI Exp./Lei Compl. 87 – not a part of FUNDEF
2,693 0.29 3,103 0.32 3,494 0.32 4,000 0.34
25% of other transfers 51 0.01 110 0.01 760 0.07 893 0.08
Quota Part of Education Wage 1,286 0.14 1,255 0.13 1,725 0.16 2,004 0.17
The State’s Social Spending R$ million and % GNP
Figure 8a
Source: CPS based on microdate from PNAD/IBGE. Source: CPS based on microdate from PNAD/IBGE.
Source: CPS based on microdate from PNAD/IBGE. Source: CPS based on microdate from PNAD/IBGE.
Variation Rate - Population Attending School Ages 7-15
0.00% 2.00% 4.00% 6.00% 8.00% 10.00% 12.00% 14.00% 16.00%
1 2 3 4 5
1995-1997 1997-1999 1999-2001 1995-2001
Variation Rate - Population Behind in School Ages 7-15
-45.00% -40.00% -35.00% -30.00% -25.00% -20.00% -15.00% -10.00% -5.00% 0.00% 5.00%
1 2 3 4 5
1995-1997 1997-1999 1999-2001 1995-2001
Average Annual Variation Rate - Population Attending School Ages 7-15
0.00% 0.50% 1.00% 1.50% 2.00% 2.50% 3.00% 3.50%
1 2 3 4 5
1995-1997 1997-1999 1999-2001 1995-2001
Average Annual Variation Rate - Population Behind in School Ages 7-15
-14.00% -12.00% -10.00% -8.00% -6.00% -4.00% -2.00% 0.00% 2.00%
1 2 3 4 5
Figure 8b
Variation Rate - Population Attending School Variation Rate - Population Behind in School
1995-1997 1997-1999 1999-2001 1995-2001 1995-1997 1997-1999 1999-2001 1995-2001
1 6.50% 6.28% 1.63% 15.03% 1 0.10% -5.39% -10.75% -15.48%
2 3.77% 4.38% 1.65% 10.11% 2 -4.94% -7.61% -17.10% -27.20%
3 3.18% 2.32% 1.64% 7.30% 3 -7.41% -9.28% -21.73% -34.26%
4 2.03% 0.95% 1.56% 4.61% 4 -9.13% -14.24% -22.76% -39.81%
5 0.22% 0.66% 0.44% 1.33% 5 -14.15% -18.88% -14.97% -40.79%
Average Annual Variation Rate - Population Attending School Average Annual Variation Rate - Population Behind in Sch
1995-1997 1997-1999 1999-2001 1995-2001 1995-1997 1997-1999 1999-2001 1995-2001
1 3.20% 3.09% 0.81% 2.36% 1 0.05% -2.73% -5.53% -2.76%
2 1.87% 2.17% 0.82% 1.62% 2 -2.50% -3.88% -8.95% -5.15%
3 1.58% 1.15% 0.81% 1.18% 3 -3.78% -4.76% -11.53% -6.75%
4 1.01% 0.47% 0.78% 0.75% 4 -4.67% -7.40% -12.11% -8.11%
5 0.11% 0.33% 0.22% 0.22% 5 -7.35% -9.94% -7.79% -8.36%
Figure 9
Variation Rate - Average Education of Spouse
0.00% 5.00% 10.00% 15.00% 20.00% 25.00% 30.00%
1 2 3 4 5 6 7 8 9 10
1996-1999 1999-2001 1996-2001
Average Annual Variation Rate - Average Education of Spouse
0.00% 2.00% 4.00% 6.00% 8.00% 10.00%
1 2 3 4 5 6 7 8 9 10
1996-1999 1999-2001 1996-2001
Variation Rate -
Average Education of Head of Household
-5.00% 0.00% 5.00% 10.00% 15.00% 20.00% 25.00% 30.00% 35.00%
1 2 3 4 5 6 7 8 9 10
1996-1999 1999-2001
1996-2001
Average Anual Variation Rate -Average Education of Head of Household
-2.00% 0.00% 2.00% 4.00% 6.00% 8.00% 10.00% 12.00%
1 2 3 4 5 6 7 8 9 10
4. Health
The following two tables show health related concerns according to income
deciles. Table 1 shows that only 24.45% of the Brazilian population has access to health
insurance plans; of these, 25% are entitled to medical care, as they are public servants.
This percentage (of 24.5%) leaves 75% of the population with no health care plan
whatsoever, and are thus excluded from the medical system. As expected, the
proportion of people with health insurance increases as we move towards the wealthiest
income groups. This growth remains constant, and increases dramatically as we
approach the wealthiest 10%. In fact, even when compared to percentile group beneath
it, the wealthiest decile shows a large discrepancy, having 72.8% of its population with
medical insurance, whereas the following percentile group has 49.98% with health
insurance.
s expected, the extremes of the deciles division show the most dramatic
differe
Table 1
Incidence Analysis of Public and Private Health Services - Brazil Access rates (%) According to Income Deciles - Health Assets
Total 1 2 3 4 5 6 7 8 9 10
Is Entitled to Health Insurance Plan 24,45 2,84 4,44 17,05 6,85 12,18 17,59 25,83 35,12 49,98 72,80
Medical Care for the Public Worker 25,01 27,10 58,01 40,29 32,92 25,61 23,54 24,48 23,50 23,40 20,87
Health Insurance Value Up to 50 Reais 48,04 39,70 80,46 44,11 79,49 78,17 78,42 68,74 62,41 51,22 27,18
Health Insurance Includes Complementary Exams 96,35 97,38 92,98 93,22 93,93 93,27 93,46 95,10 96,25 96,97 98,03
Health Insurance Includes Hospitalization 93,64 94,13 91,28 94,48 85,00 86,74 87,12 89,98 91,69 93,98 97,44
Sought Health Insurance in the Last Two Weeks 12,99 8,63 10,51 12,21 11,87 12,25 13,59 13,54 13,94 15,17 18,19
Sought Medical Care for Routine or Precautionary Check-up 4,36 3,95 3,49 3,78 4,40 4,53 4,14 4,61 5,02 4,52 4,63
Has Health Insurance Plan Specifically for Dental Care 3,52 2,71 1,16 3,12 0,84 2,66 2,66 3,49 3,15 3,79 4,09
Went to the Dentist Over the Last Two Years 51,76 28,43 35,77 46,51 41,92 46,74 49,22 57,01 61,28 69,42 81,41
Prepared by CPS/FGV based on microdata from PNAD/IBGE 98 Supplement
A
nce. We see a significant gap between the two extremes of income distribution,
as the wealthiest 20% is 18 times more likely to have a health insurance plan than the
poorest 20%. However, in terms of a health insurance plan specifically for dental care,
we do not see such disparities. What can be stated regarding dental care health plan is
that overall, it is not common to Brazilians, although it is most popular in the wealthiest
segments of the population.
Figure 1
Source: CPS/FGV based on microdata from PNAD/IBGE Supplement 1998
Has Health Insurance for Dental Care
0,00 0,50 1,00 1,50 2,00 2,50 3,00 3,50 4,00 4,50
1 2 3 4 5 6 7 8 9 10
In relation to the services provided by the health insurance plans, they increase
in breadth relative to income. With the exception of the lowest income group, the
inclusion of complementary exams within health insurance increases concomitantly
with income. The inclusion of hospitalization, on the other hand, does not show a
constant pattern throughout the deciles.
Table 2
Monthly Fee Value (% of income group who already have health insurance plan)
1 2 3 4 5 6 7 8 9 10 Total
Up to 50 Reais 43.1 74.6 39 85.6 78.2 74.6 61.7 53.8 42.3 20.7 44
From 50 to 100 Reais 24.2 21.1 16.9 26.6 10.5 16.7 15.6 22 25 27.4 25.2 Fro m 100 to 200 Reais 21 20.5 6.5 19.7 5.2 4.7 7.7 11.7 15.3 20.2 30.4
From 200 to 300 Reais 7.1 8.1 0.6 8.7 1.2 0.3 1.0 2.1 3.2 5.4 12.1
From 300 to 500 Reais 3.5 7.8 0 3.8 1.3 0.4 0.2 0.6 0.9 2.2 6.6
Above 500 Reais 1.1 3.3 0 0.9 0 0 0 0.1 0 0.3 2.5
Source: CPS/FGV based on Micro-data from the PNAD98/IBGE Special Supplement
With relation to the monthly value paid to the health insurance plans, we see that
almost half of the population (44%) pays up to R$50.00, while only 2.5% pay a monthly
fee of over R$500.00. It is observed that the first and second deciles show the largest
relative proportion of individuals paying the highest monthly fees (more than
R$200.00), which supports the concept that the lowest end of the income groups are
those spending the most with health expenses. This idea is reinforced by Figure 2,
which shows that the first decile also spends more with drug store needs, relative to the
household expenditures.
Figure 2
Source: CPS/FGV based on microdata from Pesquisa de Orçamento Familiar 1995/1996 IBGE
Health Related Expenses as % of Total Expenditure
0,00% 2,00% 4,00% 6,00% 8,00% 10,00%
1 2 3 4 5 6 7 8 9 10
Income Deciles
The next table provides us with a clearer picture of where the health-related
needs lie. Interviewees were asked to comment on their morbidity rates, including their
own judgment upon their health conditions. This question could be answered in three
ways: “normal” and “irregular.” These two were then divided into subcategories, these
being “good” or “excellent.”
It is worth mentioning that the PNAD requests the individual to determine
his/her
health related issues, we
Table 3
Incidence Analysis of Health Problems - Brazil Morbidity rates (%) According to Income Deciles
Total 1 2 3 4 5 6 7 8 9 10
Considers Own Health Condition Good or Excellent 79,11 80,90 74,74 75,11 76,75 78,22 75,38 79,39 80,56 82,94 87,08
Has Been In Bed in the Past Two Weeks 3,94 3,95 4,39 4,61 4,62 4,05 4,41 3,47 3,52 3,27 3,10
Has Back Pains 17,41 15,46 20,98 19,23 15,46 16,20 18,56 17,23 16,97 17,30 16,80
Has Arthritis or Rheumatism 8,16 6,89 11,26 10,06 7,97 7,01 9,68 7,66 7,56 7,12 6,43
Has Cancer 0,22 0,09 0,14 0,17 0,20 0,21 0,24 0,21 0,28 0,31 0,38
Has Diabetes 1,97 0,63 1,23 1,71 1,58 1,73 2,57 2,25 2,71 2,61 2,72
Has Bronchitis or Asthma 4,85 3,05 3,11 4,63 5,96 5,75 6,00 5,36 5,24 4,85 4,59
Has Hypertension 10,57 5,93 10,06 10,75 9,49 9,52 12,90 11,59 11,91 11,87 11,73
Has Heart Disease 3,89 1,62 3,03 3,68 3,89 3,62 5,34 4,60 4,42 4,36 4,42
Has Chronic Renal Failure 2,51 2,10 2,45 2,42 2,98 2,66 3,17 2,58 2,55 2,34 1,82
Has Depression 4,96 3,07 4,42 5,00 4,90 4,85 5,82 5,31 5,50 5,46 5,32
Has Tuberculosis 0,09 0,13 0,12 0,10 0,14 0,06 0,11 0,08 0,07 0,05 0,05
Has Tendinitis or Tenosynovitis 1,83 0,93 1,27 1,51 1,38 1,44 1,85 1,74 2,07 2,67 3,48
Has Cirrhosis 0,15 0,08 0,13 0,16 0,19 0,17 0,14 0,15 0,14 0,15 0,15
Prepared by CPS/FGV based on microdata from PNAD/IBGE 98 Supplement
s own health conditions. Although this has some validity, it is not the best
method to determine whether an individual’s medical needs are being supplied, as
medical professionals are the ones suited for this task. A person may believe his/her
health condition is great, while perhaps being unaware of a disease he/she might have.
Also, when analyzing one’s health conditions, the interviewee also takes into
consideration stress, vitality, anxiety, etc. For this reason, the hypothesis of observing
the results in an adjusted well-being scale is not strongly supported, as each individual
self-evaluates himself based on categories relative to that individual. Nonetheless, this
question, in conjunction to those related to specific health issues, provide approximate
indicators for the Brazilian population’s health related needs.
When looking at the government’s expenditure with
observe that the proportion of GNP devoted to health has increased over the years
between 1998 and 2001, as Table 4 shows. There has been a doubling of the percentage
of GNP devoted to mandatory transfers to states and municipalities, and the value of
these transfers have more than doubled. In plain health expenditures, excluding
personnel, we find that there has been a 16.43% increase in the proportion of GNP spent
on these. However, in terms of active personnel, we notice that the values increased in
terms of gross value, but decreased relative to GNP.
R$ M % PIB R$ M % PIB R$ M % PIB R$ M % PIB 11) Health Expenditures
(excluding personnel)
12,781 1.4 15,231 1.58 17,617 1.62 19,356 1.63
General Administration 163 0.02 161 0.02 184 0.02 246 0.02
Human Resources 7 0 15 0 128 0.01 110 0.01
Information Technology 6 0 11 0 73 0.01 122 0.01
Social Communication and Health Education
42 0 19 0 37 0 32 0
PAB - Fixed – Basic Attention 189 0.02 1,774 0.18 1,726 0.16 1,790 0.15
Food and Nutrition 61 0.01 141 0.01 152 0.01 169 0.01
Sanitary Watch 49 0.01 132 0.01 155 0.01 147 0.01
Epidemic Watch 434 0.05 702 0.07 586 0.05 757 0.06
DST 52 0.01 107 0.01 666 0.06 621 0.05
SUS 10,734 1.17 10,482 1.09 12,378 1.14 13,370 1.13
Medications and Bacines 712 0.08 1,198 0.12 644 0.06 785 0.07
Family Health and Community Agents (Saúde da Família Program)
226 0.02 346 0.04 663 0.06 976 0.08
Women’s Health 38 0 47 0 9 0 9 0
Blood and Hemoderivatives 16 0 35 0 142 0.01 145 0.01
Research and Events 51 0.01 61 0.01 73 0.01 78 0.01
10) Mandatory transfers to states and municipalities (health)
- - - - 2,190 0.2 4,920 0.42
FPE/FPM/IPI Exp. - - - - 2,181 0.2 4,903 0.41
ITR - - - - 9 0 17 0
12) Active Personnel (Health) 2,249 0.25 2,501 0.26 3,006 0.28 2,628 0.22
Source: SIAFI, TEM/FAT, BACEN, MPAS, MF/SRF, MF/STN, BNDES Elaboration: MF/SFE E Sec.Executiva
R$ million and % GNP
1998 1999 2000 2001
In this case, access to a health insurance plan was perceived as an asset, as it
allows for different treatment among those who have it and does who do not. We not
only no
he most privileged. To support this claim, we look at the numbers relating to
Table 4
The State’s Social Spending
tice inequalities among those with health insurance plans and those without, but
we also observe a wide gap among those with health insurance, relative to their income
levels. While the poorer deciles spend more of their income (proportion wise) in health
related expenses, they have a more limited access to complementary services within
their health plans. It was affirmed that easily identified diseases (those not requiring
medical examinations) are more common in the lowest income deciles, while those
diseases requiring medical examinations are more commonly found in the wealthier
deciles.
As for the consumption of health services, it was clearly noticed that inequality
favored t
the questions of whether the individual sought medical care recently, for precautionary
or regular check-ups, and whether the individual went to the dentist in the past two
years. Those with higher income levels were more likely to confirm these two
access to assets, in this case health insurance, tends to lead to a greater demand for
health services, as the marginal cost of health service becomes null once the individual
has a health plan.
The analysis of income distribution according to health measures allowed us to
determine a profile for the access, needs and services, all health-related. Overall, it was
firme
af d that poorer individuals have worse access to assets such as health insurance,
they get sick more often, and the consume less health services, contributing to the
worsening of the income inequality effect. In this sense, the reinforcement of asset
portfolios (health, human and physical capital) is poverty-fighting policies, with the
5. Sanitation
When considering the sustainable development of a population’s health, it is
necessary to take into consideration the importance of a proper sanitation system. The
Brazilian experience with water treatment and sewerage has been improving over the
course of the past few years. The following figures and tables show that the access to
proper sanitation has ameliorated in the past five years. However, we still see a
significant gap between deciles. As can be more clearly understood through Figures 1
and 2, discrimination is still present between those with access to sanitation treatment
and those without, in accordance to their income levels.
Figure 1
Figure 2
Source: CPS/FGV based on microdata from PNAD/IBGE
Source: CPS/FGV based on microdata from PNAD/IBGE
Access to Assets According to Income Deciles - Sewerage
0,00% 10,00% 20,00% 30,00% 40,00% 50,00% 60,00% 70,00% 80,00%
1 2 3 4 5 6 7 8 9 10
1996 1999 2001
Access to Assets According to Income Deciles - Water Treatment
40,00% 50,00% 60,00% 70,00% 80,00% 90,00% 100,00%
1 2 3 4 5 6 7 8 9 10
1996 1999 2001
In relation to water treatment, we observe—in Figure 2—that there is a trend
towards convergence until the last deciles, starting from the third income level.
second and third deciles. In Figure 1, we still observe a gap between the lower and
higher deciles, but of a different nature, while in water treatment the observed trend is
one of convergence, in relation to sewerage, the tendency is one of monotone growth
(with the exception of the movement between the first and second deciles).
Access to Assets in Brazil According to Income Deciles
Public Services Horizontal Composition
Sewerage Running
Water Sewerage
Running
Water Sewerage
Running Water
1 25.58% 49.07% 30.20% 53.64% 34.80% 59.05%
2 14.89% 50.69% 15.40% 52.77% 19.32% 58.78%
3 24.05% 73.59% 27.58% 75.77% 29.59% 77.96%
4 30.91% 80.21% 35.83% 84.17% 37.38% 85.76%
5 38.22% 88.16% 41.00% 91.24% 44.34% 92.02%
6 43.54% 92.37% 46.96% 93.56% 47.96% 93.86%
7 48.30% 94.82% 52.25% 96.36% 52.84% 96.63%
8 54.05% 97.10% 56.62% 97.87% 57.10% 97.86%
9 60.01% 98.40% 62.32% 98.95% 63.00% 99.03%
10 67.52% 99.42% 69.68% 99.65% 70.65% 99.65%
Source: CPS/FGV based on microdata from PNAD/IBGE
1996 1999 2001
In comparison to those of water treatment, the access rates of sewerage are
disappointing. While the wealthiest half of the population has an access rate to running
water a
ile the increase of access rate to sewerage
of the
Table 1
bove 90%, not even the wealthiest decile has that much access to sewerage,
having had an access rate of only 70.65% in 2001, while the poorest decile had one of
34.8%. It is important to note that although sewerage still is poorly spread, it has
increased almost ten percentage points for the poorest decile from 1996 to 2001. This
growth has not been as significant for the other deciles, varying between three and six
percentage points for the remaining deciles.
In relation to water treatment, the change between the five years has been more
impressive and more accurately targeted. Wh
poorest decile was three times that of wealthiest, the poorest gained over forty
times as much than the tenth decile from the government’s investment in water
treatment. As can be seen from Figures Z and B, the government’s investment in water
treatment has increased over the past four years, not only in size but also as a proportion
Nonetheless, further progress is still necessary for the im
popularization of the distribution and reach of sewage treatme
Sources: SIAFI, TEM/FAT, BACEN, MPAS,MF/SRF, MF/STN, BNDES. Elaboration: CPS/FGV
Figure 4
Elaboration: CPS/FGV
Sources: SIAFI, TEM/FAT, BACEN, MPAS,MF/SRF, MF/STN, BNDES. The State's Social Spending as % of GNP -
Water Treatment
0,06 0,06
0,04
0,14
0 0,02 0,04 0,06 0,08 0,1 0,12 0,14 0,16
1998 1999 2000 2001
563 544
445
1642
0 200 400 600 800 1000 1200 1400 1600 1800
1998 1999 2000 2001
provement and
nt. This is especially true
in the case of the poorest percentiles of the population. As shown by the POF
1995/1996 in Figure 5, household expenses with water and sewerage increase in the
bottom
Figure 3
The State's Social Spending in Reais (millions) - Water Treatment
deciles of the population, until reaching a saturation point in the fourth decile,
where then the proportion of household expenditure on water treatment and sewerage
starts to decrease monotonically. This can be explained by the fact that the lower deciles
the richer deciles, as show in Table 2. This then makes the cost of both services more
overbearing, and thus they consume a greater proportion of their incomes. The wealthier
deciles, on the other hand, have better access to water treatment and sewerage (access
increasing with income), such that the cost imposed on them is not as overbearing.
When plotting the gains and losses in access to running water and sewerage in
Brazil between the years of 1999 and 2001, we see that the income deciles benefiting
the most from the government’s .08% increase in spending in water treatment w
Source: CPS/FGV based on microdata from Pesquisa de Orçamento Familiar 1995/1996 IBGE
Figure 5
Public Services as % of Total Household Expenses - Water and Sewerage
1,82%
2,05% 2,15% 1,85%
1,69% 1,73% 1,44%
1,22% 0,87%
0,44%
0,00% 0,50% 1,00% 1,50% 2,00% 2,50%
1 2 3 4 5 6 7 8 9 10
ere
ose in the bottom half. Between 1999 and 2001, the lowest decile experienced a 4.6
ercen th
p tage points increase in the access to sewerage and a 5.41 percentage points
increase in the access to running water. Concomitantly, the wealthiest decile
experienced a 0.97 percentage points increase in the access to sewerage, while access to
running water remained the same from 1999 to 2001.
Figure 6
Gains and Losses in Access to Sanitation According to Income Deciles -
6,00% 7,00%
Source: CPS/FGV based on microdata from PNAD/IBGE -1,00%
0,00% 1,00% 2,00% 3,00% 4,00% 5,00%
1 2 3 4 5 6 7 8 9 10
sewerage
running water
Overall, we see that although the situation of sanitation in Brazil has improved,
Table 2
nonetheless, it is still lacking. Policies increasing the access to running water and
sewerage have been properly targeted, as the lower deciles have been the ones
benefiting the most from the government’s investment in water treatment, which has
tripled in gross value from 1999 to 2001.
Access to Assets in Brazil According to Income Deciles
Public Services Vertical Composition
Sewerage Running
Water Sewerage
Running
Water Sewerage
Running Water
1 6.38% 6.05% 6.91% 6.36% 7.63% 6.87%
2 3.68% 6.19% 3.54% 6.29% 4.22% 6.82%
3 5.82% 8.79% 6.26% 8.93% 6.55% 9.16%
4 7.59% 9.73% 8.20% 9.99% 8.09% 9.85%
5 10.15% 11.57% 9.36% 10.80% 9.76% 10.75%
6 9.92% 10.39% 10.72% 11.08% 10.44% 10.85%
7 11.81% 11.46% 12.10% 11.57% 11.63% 11.29%
8 13.48% 11.96% 12.76% 11.44% 12.43% 11.31%
9 14.56% 11.79% 14.24% 11.72% 13.84% 11.55%
10 16.61% 12.08% 15.92% 11.81% 15.40% 11.53%
Source: CPS/FGV based on microdata from PNAD/IBGE
1996 1999 2001
Table 3
Access to Assets in Brazil According to Income Deciles
Public Services
Sewerage Running
Water Sewerage
Running
Water Sewerage
Running Water
1 6748011 12945470 8147040 14471006 9942309 16869642
2 3892438 13251648 4176036 14309856 5505712 16753145
3 6150626 18818328 7388100 20299191 8540744 22499400
4 8030516 20842184 9670650 22716433 10542766 24187641
5 10738529 24769615 11038479 24565584 12720081 26396828 6 10490597 22254301 12650680 25203570 13612394 26639016 7 12496233 24530429 14274262 26324155 15157358 27716492 8 14260378 25617393 15053550 26022784 16207814 27776876 9 15397238 25248781 16795352 26665855 18044208 28365578 10 17566339 25865711 18776060 26852045 20074246 28315641
Source: CPS/FGV based on microdata from PNAD/IBGE
Figure 7
Source: CPS/FGV based on microdata from PNAD/IBGE Source: CPS/FGV based on microdata from PNAD/IBGE
Figure 8
Source: CPS/FGV based on microdata from PNAD/IBGE Source: CPS/FGV based on microdata from PNAD/IBGE
Variation Rate - Running Water
-5.00% 0.00% 5.00% 10.00% 15.00% 20.00% 25.00%
1 2 3 4 5 6 7 8 9 10
1996-1999 1999-2001 1996-2001
Variation Rate - Sewerage
0.00% 5.00% 10.00% 15.00% 20.00% 25.00% 30.00% 35.00% 40.00%
1 2 3 4 5 6 7 8 9 10
1996-1999 1999-2001 1996-2001
Average Annual Variation Rate - Sewerage
0.00% 2.00% 4.00% 6.00% 8.00% 10.00% 12.00% 14.00%
1 2 3 4 5 6 7 8 9 10
1996-1999 1999-2001 1996-2001
Average Annual Variation Rate - Running Water
-1.00% 0.00% 1.00% 2.00% 3.00% 4.00% 5.00% 6.00%
1 2 3 4 5 6 7 8 9 10
Of all these services, electricity is the one demonstrating the most egalitarian
distribution, as there has occurred an impressive shift towards convergence. An
important criticism though, is that while there is an egalitarian distribution throughout
most deciles, the first and second income deciles still lag behind. They have
ce 1996, starting at the access rate of 74.2%
rates such as 85.27% and 86.89%,
decile onwards, a significant shift has not
h levels of access rates, the lowest one
the improvement of the distribution of
in 1996, the difference between the two extremes of the
s, whereas in 2001 this difference already
almost half. The time period with the
1999. For the first few deciles, we continue
but from the fourth decile onwards the
ent. The shifts between periods are clearly
tes plotted in Figure 5. Through this graph, it becomes
throughout the years of 1996 to 2001 were the
Figure 3
Source: CPS/FGV based on microdata from PNAD/IBGE Access to Assets in Brazil According to Income Deciles - Telephone
(%)
0,00 20,00 40,00 60,00 80,00 100,00
1 2 3 4 5 6 7 8 9 10
1996 1999 2001
experienced an increase in access rate sin
and 77.8% respectively, and in 2001 reaching
respectively. Meanwhile, from the fifth
occurred, as these deciles already started at hig
being 96.27% for the fifth decile. To show
electricity, we observe that
income groups was of 25.69 percentage point
shrunk to 14.67 points, showing a reduction of
greatest amount of change was from 1996 to
to observe increases in access rates until 2001,
shifts were less than the order of one perc
observed by the variation ra
obvious that the deciles gaining the most
Source: CPS/FGV based on microdata from PNAD/IBGE
Figure 4
-0,0200 0,0400 0,1200
1 2 3 4 5 6 7 8 9 10
1999-2001 Variation Rate - Electricity
0,0000 0,0200 0,0600 0,0800 0,1000 0,1400 0,1600
1996-1999
1996-2001
When looking at the amount of expenses that electricity consum
these (in proportion to total expenses) decrease in accordance to income
such, the lower income groups use up more of their income to obt
than the wealthier groups. While the tenth decile spends 1.43% of total expenses on
electrical energy, the first decile spends 4.15%. This information is obtained from
Pesquisa de Orçamento Familiar 1995/1996. Although this is interesting inform
is useless for comparison, as that is the only period for which the POF is available. We
provide this information since the POF is currently at the field level, with the
es, we learn that
growth. As
ain electrical energy
the
ation, it
plan of
uly and the results being released three months thereafter. completion in J
Figure 5
Source: CPS/FGV based on microdata from Pesquisa de Orçamento Familiar 1995/1996 IBGE
Public Services as % of Total Household Expenses - Electrical Energy
4,15% 4,29% 4,00% 3,89%
3,27% 3,17% 2,91% 2,46%
1,91% 1,43%
0,00% 1,00% 2,00% 3,00% 4,00% 5,00%
1 2 3 4 5 6 7 8 9 10
The service with the second most egalitarian distribution is garbage collection,
as can be seen from Figure 2. It also shows come convergence, but in a much milder
manner than electricity. The period with the largest amount of shifts was 1996-1999. In
total, during that period access to garbage collection improved by almost twice the
amount in the 1999-2001 period. In the 1996-1999 period, the curve shifted upwards, in
an attempt to improve the situation of the lower ends of the income spectrum. At this
time, the bottom half of the income groups increased their access rates to garbage
collection between eight and fifteen percentage points—a notable move. However, the
movement towards equity had not yet been fully started, as the difference between
income levels was still striking, as the preoccupation was raising the extremely low
access rates of half of the population. In 1996, only the highest income deciles had
acces
ing standards than the actual poor.
When looking at the variation rate for the periods discussed, we confirm that the major
shifts occurred in the first three-year period being analyzed. As with electricity,
improvements concentrated on the bottom half of the income decile division, especially
in the 1996-1999 period. In the second three-year period, the variation rate was lower
than one-tenth for all deciles, except the poorest two.
s rates above ninety percent, and more than half had access rates of less than
seventy percent, with the two poorest deciles with access rates below forty percent. In
1999, only one decile was below fifty percent, and just barely, with 47.51%.
Between 1999 and 2001, on the other hand, there was already a movement
towards convergence, instead of a mere upwards shift of the curve. The increases in this
period focused mainly on the first and second deciles. All other deciles experienced an
improvement somewhere between four and 0.3 percentage points. This allowed for
amelioration in the distribution of the service. However, there is still great disparity
among the deciles, especially when comparing the top five deciles to the bottom ones.
Starting from the third decile in 2001, we observe that there is a movement towards
stabilization, especially of the upper deciles, which have remained almost constant in
the 1999-2001 period (relative to the lower deciles). Still, the difference between the
third decile and the first two deciles is striking. While in 2001, the third income group
had an access rate of 72.62%, the bottom two had rates of 56.51% and 59.47% (for the
second and first, respectively). Notice that the first decile had an access rate greater than
that of the second decile in 2001. This is mainly due to the fact that individuals with no
income (such as those between employment opportunities) are included in the first