ABSTRACT:Objective: To describe the prevalence of self-reported arterial hypertension in the adult population in the Brazilian state capitals and Federal District in 2011, and analyze the trend from 2006 to 2011. Methods: A time series study was conducted with data from the monitoring system by telephone survey (Vigitel) in the period between 2006 and 2011. Approximately 54,000 individuals were assessed per year in the locations studied. A polynomial regression model was used for trend analysis according to gender, age, education and region of the country. Results: The prevalence of hypertension was 22.7% in 2011, higher in women (25.4%; 95%CI 24.2 – 26.5) than in men (19.5%; 95%CI 18.4 – 20.7). In the period between 2006 and 2011, the lower frequency of hypertension was observed in 2006 (21.5%), and the higher in 2009 (24.4%), with no statistically signiicant diference in the period. Conclusion: There was no signiicant sex-speciic trend, maintaining the higher frequency among women. The prevalence of hypertension increased progressively with age and was higher among adults with lower education (0 – 8 years of study). The South was the only region that showed a statistically signiicant increasing trend for the years between 2006 and 2011 (15% per year).
Keywords: Hypertension. Prevalence. Interview. Chronic disease. Time series studies. Morbidity.
Prevalence of self-reported arterial hypertension
in Brazilian capitals in 2011 and analysis of its
trends in the period between 2006 and 2011
Prevalência da hipertensão arterial autorreferida nas capitais brasileiras
em 2011 e análise de sua tendência no período de 2006 a 2011
Silvania Suely Caribé de Araújo AndradeI,II, Deborah Carvalho MaltaI,III, Betine Moehlecke IserI,IV,
Patricia Chueri SampaioI, Lenildo de MouraV
IDepartament of Non-Communicable Disease and Condition Surveillance and Health Promotion, Health Surveillance Secretariat, Ministry of Health – Brasília (DF), Brazil.
IIPublic Health School at Universidade de São Paulo – São Paulo (SP), Brazil. IIINursing School at Universidade Federal de Minas Gerais – Belo Horizonte (MG), Brazil.
IVUniversidade Federal do Rio Grande do Sul – Rio Grande do Sul (RS), Brazil.
VPanamerican Health Organization – Brasília (DF), Brazil
Corresponding author: Silvânia Suely Caribé de Araújo Andrade. Departamento de Vigilância de Doenças e Agravos Não Transmissíveis e Promoção da Saúde, Secretaria de Vigilância em Saúde, Ministério da Saúde. SAF Sul, Trecho 2, Lote 5/6, Torre I, Edifício Premium, Sala 14, Térreo, CEP: 70070-600, Brasília, DF, Brasil. E-mail: [email protected]
Conlict of interests: nothing to declare – Financing source: none.
ORIGINAL ARTICLE / ARTIGO ORIGINAL
INTRODUCTION
Cardiovascular diseases (arterial hypertension, ischemic and cerebrovascular diseases) are the irst cause of morbimortality in the world1 and are responsible for about 30% of causes of death in Brazil1,2. Among them, hypertension is the most frequent cause of morbidity and the main risk factor for cardiovascular complications, such as stroke and acute myocardial infarction, besides chronic kidney disease1,3.
The World Health Organization (WHO) estimates that approximately 25% of the population have arterial hypertension (AH), and an increase of 60% is predicted for 20251,4. Besides, AH brings high socioeconomic costs, and directly afects individuals, the health system and the economy5.
Risk factors associated with AH are described in literature, such as inadequate diet, excessive salt, abusive alcohol consumption, physical inactivity, excess weight, smoking, glucose and lipid metabolism disorders3-7.
In Brazil, there are a few population based studies referring to the prevalence of AH. Most of them are focused on cities or regions8-13. In general, studies present methodological differences (sample, population groups, age group, and diagnostic criteria) that make comparability more diicult. However, prevalence ranges from 15 to 40% in the urban adult Brazilian population8-14.
RESUMO:Objetivo: Descrever as prevalências de hipertensão arterial (HA) autorreferida na população adulta nas capitais brasileiras e no Distrito Federal em 2011, e analisar a tendência entre 2006 e 2011. Métodos: Foi realizado estudo de séries temporais de dados provenientes do sistema de monitoramento por inquérito telefônico, o Vigitel, no período de 2006 a 2011. Foram avaliados cerca de 54.000 indivíduos em cada ano nos locais estudados. Foi utilizado o modelo de regressão polinomial para análise de tendência segundo sexo, faixa etária, escolaridade e região do país. Resultados: A prevalência de HA foi de 22,7% em 2011, maior em mulheres (25,4%; IC95% 24,2 – 26,5) do que em homens (19,5%; IC95% 18,4 – 20,7). No período de 2006 a 2011, a menor frequência de HA foi veriicada em 2006 (21,5%), e a maior em 2009 (24,4%), sem diferença estatisticamente signiicativa no período. Conclusões: Não houve tendência signiicativa especíica por sexo, mantendo-se maior frequência entre mulheres. A prevalência de HA aumentou progressivamente com a idade e foi maior entre os adultos de menor escolaridade (0 a 8 anos de estudo). A região Sul foi a única que apresentou tendência de aumento estatisticamente signiicativo (incremento de 15% ao ano) para os anos de 2006 a 2011.
PREVALENCE OF SELF-REPORTED ARTERIAL HYPERTENSION IN BRAZILIAN CAPITALS IN 2011 AND ANALYSIS OF ITS TRENDS IN THE PERIOD BETWEEN 2006 AND 2011
Due to the methodological diiculties to measure blood pressure in population studies, analyses that employ self-reported data have been used as a proxy measure, even if it is not gold-standard for the evaluation of blood pressure. However, this is the only available standardized option for all of the capitals, regardless of their respective social discrepancies14.
In the supplement of the National Household Survey (PNAD) from 2008, a frequency of 14% of hypertension was reported among people aged more than 15 years old15. In the United States, the Behavioral Risk Factor Surveillance System (BRFSS) used the self-reported methodology to monitor AH for more than 20 years16.
The prevalence of self-reported hypertension in the United States, from 2005 to 2009, increased from 25.8 to 28.3%, according to data from BRFSS17. A systematic review with data published from January 1980 to July 2003 indicates that the prevalence of hypertension is different around the world: the lowest prevalence was in the rural region of India (5.2%), and the highest one was in Poland (70.7%)18.
The monitoring of AH is useful to support the elaboration of preventive measures of morbimortality for this group of cardiovascular diseases. In 2006, the Ministry of Health implemented Vigitel – Telephone-Based Surveillance of Risk and Protective Factors for Chronic Diseases – an instrument that monitors the distribution of risk and protective factors for non-communicable chronic diseases, including self-reported arterial hypertension, using telephone interviews19.
The objective of this study is to estimate the prevalence of self-reported AH in the adult population in 2011 in Brazilian capitals and in the Federal District, and also to analyze the trend in the period from 2006 to 2011.
METHODS
TYPE OF STUDY
A study of time series database with data originated from the Telephone-Based Surveillance of Risk and Protective Factors for Chronic Diseases (Vigitel) was conducted in the 26 Brazilian capitals and in the Federal District from 2006 to 2011. Annually, about 2,000 telephone interviews were collected in each of the 26 Brazilian capitals and in the Federal District, accounting for 54,000 individuals assessed every year19.
SAMPLE
Vigitel uses the probability sample in two stages:
2. Random selection of one adult person aged > 18 years old living in the household to answer the interview19.
The estimates of indicators were weighed by considering the differences in the probability of selecting each interviewee, characterized according to the number of landlines and adults living in the selected household, as well as the differences in the sociodemographic composition of the Vigitel sample in relation to the composition of the total adult population in each city, according to the census distribution of 2000. Final weights are attributed to each interviewed individual, which are a result of the multiplication of the following factors: the opposite of the number of landlines in the household of the interviewee; number of adults in the interviewed household; and post-stratification weight, which aims at equaling the sociodemographic composition of the adult population in the city with the population census, according to data of sex, age groups and schooling. A forth weighing factor is used for the estimates related to the set of the 27 capitals, being the ratio between the proportion of adults in a given city by the proportion of adults in the 27 cities19.
STUDIED VARIABLES
The current study analyzed data referring to the prevalence of arterial hypertension, based on the number of individuals that refer to the medical diagnosis of arterial hypertension/ interviewed individuals, according to the answer given to the question “Has any doctor ever told you have high blood pressure?”.
STATISTICAL ANALYSIS
The tendency measure of the time series of AH was stratiied according to sex, age group, schooling and region of the country. The indicator was expressed by the proportion of adults who answered yes to the question concerning AH for each year of the survey. The technique used to estimate the tendency was the polynomial regression model, whose response variable (Yi) is the proportion of the indicator, and the explanatory variable (Xi) is time (year of survey). The negative signal of the angular coeicient (β) of the line adjusted by the model indicates that the relationship between indicator and time is decreasing; otherwise, the relationship is increasing. The value of the positive angular coeicient represents a mean annual increase in the proportion of the indicator for each unit of time. Otherwise, it represents the mean annual decrease of the proportion20.
PREVALENCE OF SELF-REPORTED ARTERIAL HYPERTENSION IN BRAZILIAN CAPITALS IN 2011 AND ANALYSIS OF ITS TRENDS IN THE PERIOD BETWEEN 2006 AND 2011
of model adequacy. For data processing and statistical analyses, the software Stata, version 11.1, was used. The commands indicated for proportions were used, considering the weighing factors attributed to each individual who was interviewed in Vigitel surveys19.
ETHICAL ASPECTS
This study was approved by the National Human Ethics Research Committee (CONEP). The informed consent form was replaced by the verbal consent, obtained during telephone contacts with the interviewees.
RESULTS
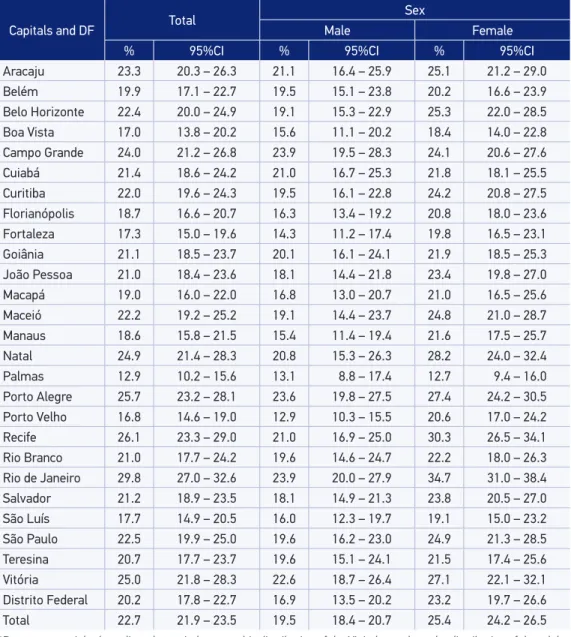
In the set of the adult population of the 27 cities analyzed in 2011, the frequency of a previous medical diagnosis of arterial hypertension reached 22.7% (95%CI 21.9 – 23.5), being higher among women (25.4%; 95%CI 24.2 – 26.5) than men (19.5%; 95%CI 18.4 – 20.7) (Table 1). The prevalence of adults who reported a medical diagnosis of arterial hypertension in 2011 ranged between 12.9% (95%CI 10.2 – 15.6) in Palmas and 29.8% (95%CI 27.0 – 32.6) in Rio de Janeiro. For the male gender, the highest frequencies were observed in Rio de Janeiro (23.9%; 95%CI 20.0 – 27.9), Campo Grande (23.9%; 95%CI 19.5 – 28.3) and Porto Alegre) 23.6%; 95%CI 19.8 – 27.5); lowest frequencies were observed in Porto Velho (12.9%; 95%CI 10.3 – 15.5), Palmas (13.1%; 95%CI 8.8 – 17.4) and Fortaleza (14.3%; 95%CI 11.2 – 17.4). Among women, the highest frequencies were observed in Rio de Janeiro (34.7%; 95%CI 31.0 – 38.4), Recife (30.3%; 95%CI 26.5 – 34.1) and Natal (28.2%; 95%CI 24.0 – 32.4); lowest frequencies were in Palmas (12.7%; 95%CI 9.4 – 16.0), Boa Vista (18.4%; 95%CI 14.0 – 22.8) and São Luís (19.1%; 95%CI 15.0 – 23.2). The capitals that presented signiicant diferences in prevalence between men and women were Porto Velho, Recife and Rio de Janeiro (Table 1).
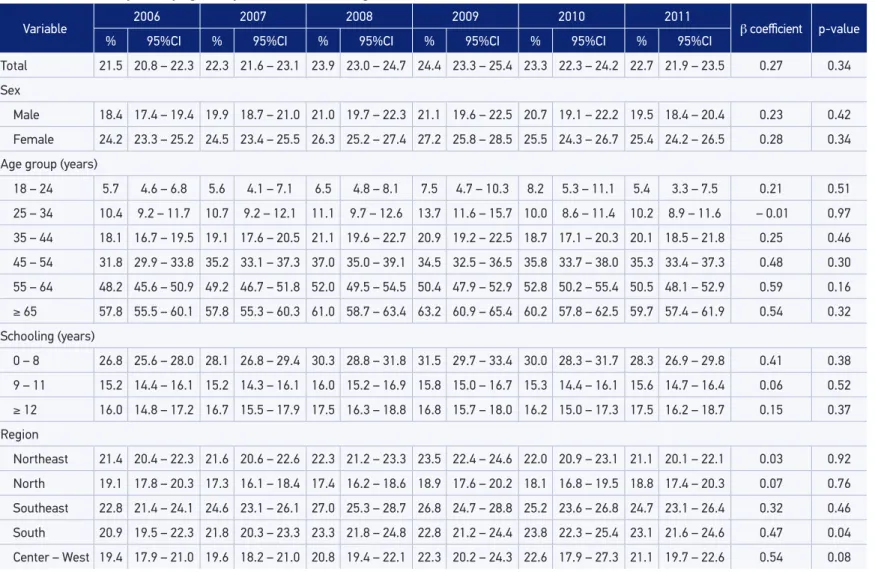
In the period of 2006 to 2011, the frequency of reported arterial hypertension among adults analyzed by Vigitel ranged from 21.5% in 2006 and 24.4% in 2009. Howver, there was no statistically signiicant diference in all of the analyzed period. Likewise, no speciic signiicant tendency was observed by sex. The highest frequency of hypertension among women was observed in all of the analyzed years (Table 2).
It was possible to verify progressive increase in the frequency of hypertension diagnosis with age, and the prevalence among the elderly (65 years old or more) was up to 10 times higher than that among young adults (18 to 24 years old). In 2011, for instance, the prevalence was of 5.4% for the former and 59.7% for the latter. This relationship was observed in all of the years of the series, with no time tendency of changes in the period. From the age of 55, arterial hypertension reaches practically half of the population (Table 2).
arterial hypertension, the same condition was observed among 16.0% of the adults with 12 schooling years or more. These diferences between schooling categories remained in 2011 (28.3 and 17.5%, respectively), also with no changes of tendency in the period.
In the evaluation of prevalence according to regions of the country, it was possible to notice that the highest frequencies were observed in the Southeast (prevalence of 24.7%
Table 1. Percentage* of adults (≥ 18 years old) who reported medically diagnosed hypertension, by sex, according to the Brazilian state capitals and the Federal District. Vigitel, 2011.
Capitals and DF Total
Sex
Male Female
% 95%CI % 95%CI % 95%CI
Aracaju 23.3 20.3 – 26.3 21.1 16.4 – 25.9 25.1 21.2 – 29.0 Belém 19.9 17.1 – 22.7 19.5 15.1 – 23.8 20.2 16.6 – 23.9 Belo Horizonte 22.4 20.0 – 24.9 19.1 15.3 – 22.9 25.3 22.0 – 28.5 Boa Vista 17.0 13.8 – 20.2 15.6 11.1 – 20.2 18.4 14.0 – 22.8 Campo Grande 24.0 21.2 – 26.8 23.9 19.5 – 28.3 24.1 20.6 – 27.6 Cuiabá 21.4 18.6 – 24.2 21.0 16.7 – 25.3 21.8 18.1 – 25.5 Curitiba 22.0 19.6 – 24.3 19.5 16.1 – 22.8 24.2 20.8 – 27.5 Florianópolis 18.7 16.6 – 20.7 16.3 13.4 – 19.2 20.8 18.0 – 23.6 Fortaleza 17.3 15.0 – 19.6 14.3 11.2 – 17.4 19.8 16.5 – 23.1 Goiânia 21.1 18.5 – 23.7 20.1 16.1 – 24.1 21.9 18.5 – 25.3 João Pessoa 21.0 18.4 – 23.6 18.1 14.4 – 21.8 23.4 19.8 – 27.0 Macapá 19.0 16.0 – 22.0 16.8 13.0 – 20.7 21.0 16.5 – 25.6 Maceió 22.2 19.2 – 25.2 19.1 14.4 – 23.7 24.8 21.0 – 28.7 Manaus 18.6 15.8 – 21.5 15.4 11.4 – 19.4 21.6 17.5 – 25.7 Natal 24.9 21.4 – 28.3 20.8 15.3 – 26.3 28.2 24.0 – 32.4 Palmas 12.9 10.2 – 15.6 13.1 8.8 – 17.4 12.7 9.4 – 16.0 Porto Alegre 25.7 23.2 – 28.1 23.6 19.8 – 27.5 27.4 24.2 – 30.5 Porto Velho 16.8 14.6 – 19.0 12.9 10.3 – 15.5 20.6 17.0 – 24.2
Recife 26.1 23.3 – 29.0 21.0 16.9 – 25.0 30.3 26.5 – 34.1
Rio Branco 21.0 17.7 – 24.2 19.6 14.6 – 24.7 22.2 18.0 – 26.3 Rio de Janeiro 29.8 27.0 – 32.6 23.9 20.0 – 27.9 34.7 31.0 – 38.4 Salvador 21.2 18.9 – 23.5 18.1 14.9 – 21.3 23.8 20.5 – 27.0 São Luís 17.7 14.9 – 20.5 16.0 12.3 – 19.7 19.1 15.0 – 23.2 São Paulo 22.5 19.9 – 25.0 19.6 16.2 – 23.0 24.9 21.3 – 28.5 Teresina 20.7 17.7 – 23.7 19.6 15.1 – 24.1 21.5 17.4 – 25.6 Vitória 25.0 21.8 – 28.3 22.6 18.7 – 26.4 27.1 22.1 – 32.1 Distrito Federal 20.2 17.8 – 22.7 16.9 13.5 – 20.2 23.2 19.7 – 26.6 Total 22.7 21.9 – 23.5 19.5 18.4 – 20.7 25.4 24.2 – 26.5
*Percentage weighed to adjust the sociodemographic distribution of the Vigitel sample to the distribution of the adult
population of each city in the 2000 Demographic Census 2000 (see Methodological Aspects).
SELF-REPORTED ARTERIAL HYPERTENSION IN BRAZILIAN CAPITALS
Table 2. Trend analysis of self-reported diagnosis of hypertension in the overall adult population (≥ 18 years old) of the Brazilian state capitals and the Federal District, by sex, by age and years of education. Vigitel, 2011.
Variable 2006 2007 2008 2009 2010 2011 β coeicient p-value
% 95%CI % 95%CI % 95%CI % 95%CI % 95%CI % 95%CI
Total 21.5 20.8 – 22.3 22.3 21.6 – 23.1 23.9 23.0 – 24.7 24.4 23.3 – 25.4 23.3 22.3 – 24.2 22.7 21.9 – 23.5 0.27 0.34
Sex
Male 18.4 17.4 – 19.4 19.9 18.7 – 21.0 21.0 19.7 – 22.3 21.1 19.6 – 22.5 20.7 19.1 – 22.2 19.5 18.4 – 20.4 0.23 0.42
Female 24.2 23.3 – 25.2 24.5 23.4 – 25.5 26.3 25.2 – 27.4 27.2 25.8 – 28.5 25.5 24.3 – 26.7 25.4 24.2 – 26.5 0.28 0.34
Age group (years)
18 – 24 5.7 4.6 – 6.8 5.6 4.1 – 7.1 6.5 4.8 – 8.1 7.5 4.7 – 10.3 8.2 5.3 – 11.1 5.4 3.3 – 7.5 0.21 0.51
25 – 34 10.4 9.2 – 11.7 10.7 9.2 – 12.1 11.1 9.7 – 12.6 13.7 11.6 – 15.7 10.0 8.6 – 11.4 10.2 8.9 – 11.6 – 0.01 0.97
35 – 44 18.1 16.7 – 19.5 19.1 17.6 – 20.5 21.1 19.6 – 22.7 20.9 19.2 – 22.5 18.7 17.1 – 20.3 20.1 18.5 – 21.8 0.25 0.46
45 – 54 31.8 29.9 – 33.8 35.2 33.1 – 37.3 37.0 35.0 – 39.1 34.5 32.5 – 36.5 35.8 33.7 – 38.0 35.3 33.4 – 37.3 0.48 0.30
55 – 64 48.2 45.6 – 50.9 49.2 46.7 – 51.8 52.0 49.5 – 54.5 50.4 47.9 – 52.9 52.8 50.2 – 55.4 50.5 48.1 – 52.9 0.59 0.16
≥ 65 57.8 55.5 – 60.1 57.8 55.3 – 60.3 61.0 58.7 – 63.4 63.2 60.9 – 65.4 60.2 57.8 – 62.5 59.7 57.4 – 61.9 0.54 0.32
Schooling (years)
0 – 8 26.8 25.6 – 28.0 28.1 26.8 – 29.4 30.3 28.8 – 31.8 31.5 29.7 – 33.4 30.0 28.3 – 31.7 28.3 26.9 – 29.8 0.41 0.38
9 – 11 15.2 14.4 – 16.1 15.2 14.3 – 16.1 16.0 15.2 – 16.9 15.8 15.0 – 16.7 15.3 14.4 – 16.1 15.6 14.7 – 16.4 0.06 0.52
≥ 12 16.0 14.8 – 17.2 16.7 15.5 – 17.9 17.5 16.3 – 18.8 16.8 15.7 – 18.0 16.2 15.0 – 17.3 17.5 16.2 – 18.7 0.15 0.37
Region
Northeast 21.4 20.4 – 22.3 21.6 20.6 – 22.6 22.3 21.2 – 23.3 23.5 22.4 – 24.6 22.0 20.9 – 23.1 21.1 20.1 – 22.1 0.03 0.92
North 19.1 17.8 – 20.3 17.3 16.1 – 18.4 17.4 16.2 – 18.6 18.9 17.6 – 20.2 18.1 16.8 – 19.5 18.8 17.4 – 20.3 0.07 0.76
Southeast 22.8 21.4 – 24.1 24.6 23.1 – 26.1 27.0 25.3 – 28.7 26.8 24.7 – 28.8 25.2 23.6 – 26.8 24.7 23.1 – 26.4 0.32 0.46
South 20.9 19.5 – 22.3 21.8 20.3 – 23.3 23.3 21.8 – 24.8 22.8 21.2 – 24.4 23.8 22.3 – 25.4 23.1 21.6 – 24.6 0.47 0.04
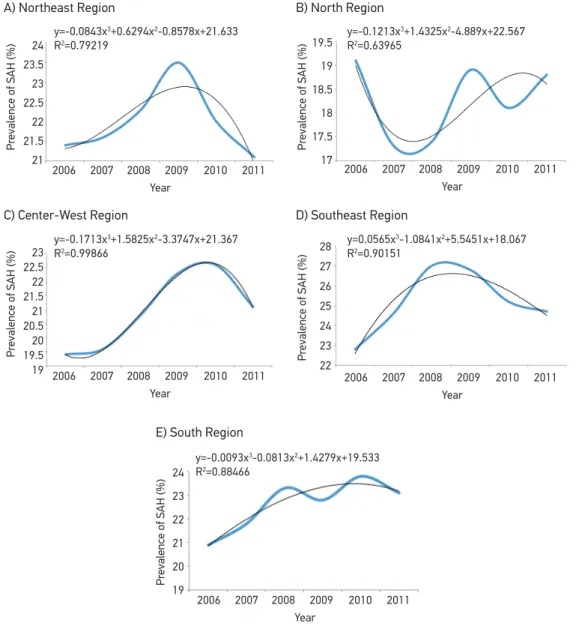
in 2011), and the lowest ones were in the North region (18.8%), and this situation was similar to the previous years. The South region showed statistically signiicant increasing tendency with non-constant increment of 0.47 a year, going from 20.9%, in 2006, to 23.1%, in 2011 (p = 0.044). The Northeast and Center-West regions presented 21.1% of prevalence in 2011 (Figure 1).
The third order model represented the historical series of 2006 to 2011, with no diference of sex and age group. It was observed that the mean coeicient was of 18.1% in the Southeast region, while the highest coeicient was in the North region in the same period (β0= 22.6).
Figure 1. Trend of self-reported diagnosis of hypertension in the overall adult population (≥ 18 years) according to Brazilian Region, 2006 – 2011.
24 23.5 23 22.5 22 21.5 21 19.5 19 18.5 18 17.5 17 Pr
evalence of SAH (%)
Pr
evalence of SAH (%)
Pr
evalence of SAH (%)
23 22.5 22 21.5 21 20.5 20 19.5 19 28 27 26 25 24 23 22 Pr
evalence of SAH (%)
24 23 22 21 20 19 Pr
evalence of SAH (%)
2006 2007 2008 2009 2010 2011 Year
2006 2007 2008 2009 2010 2011 Year
2006 2007 2008 2009 2010 2011 Year
2006 2007 2008 2009 2010 2011 Year
2006 2007 2008 2009 2010 2011 Year
y=-0.0843x3+0.6294x2-0.8578x+21.633
R2=0.79219
y=-0.1213x3+1.4325x2-4.889x+22.567
R2=0.63965
y=-0.1713x3+1.5825x2-3.3747x+21.367
R2=0.99866
y=0.0565x3-1.0841x2+5.5451x+18.067
R2=0.90151
y=-0.0093x3-0.0813x2+1.4279x+19.533
R2=0.88466 E) South Region
A) Northeast Region B) North Region
PREVALENCE OF SELF-REPORTED ARTERIAL HYPERTENSION IN BRAZILIAN CAPITALS IN 2011 AND ANALYSIS OF ITS TRENDS IN THE PERIOD BETWEEN 2006 AND 2011
The South region was the only one that presented statistically signiicant increasing tendency (15% increment a year), however, it was not constant for the years 2006 to 2011 (Figure 1).
DISCUSSION
The study showed prevalence of arterial hypertension (AH) in about one quarter of the population, with progressive increase with age, reaching more than half of the population aged more than 55 years old. Self-reported AH was more frequent among women and people with lower schooling. As to the behavior of the hypertension tendency, the series remained stable throughout the period for the characteristics of sex, age group, schooling and region, except for the South region, which demonstrated an increasing efect in the analyzed series. Hypertension is the most comprehensive vascular disease in the world, with major social impact, especially in Brazil, where cardiovascular conditions are the irst cause of death. The prevalence measured by Vigitel is compatible with other self-reported studies in the country8,9,12,14.
Regional diferences were pointed out and, in some capitals, prevalence rates are very diferent. Rio de Janeiro presented the highest prevalence (29.8%) among Brazilian capitals. This information is similar to the results in the Pró-Saúde study, conducted in a university of Rio de Janeiro, in 2001. This study showed 29.6% for both genders and statistically signiicant increase in prevalence with age21. This fact is compatible with the age structure of Rio de Janeiro, with high proportion of elderly people22.
On the other hand, the city of Palmas presented the lowers prevalence among all cities (12.9%), and that can be related to the high proportion of the young population in the city, which was created in the 1980s22,23. The North, Northeast and Center-West regions also have more young people in the composition of the population; therefore, there is lower prevalence of AH. The regional diferences should also be considered for the access to health services. Since this is a self-reported variable, there may be a fraction of undiagnosed cases of hypertension, which tends to be reduced with the ampliied access to health services and with the organization of primary care.
This same hypothesis can explain the highest frequencies of AH in the population of the Southeast and the South, with older population and better health care structure, both from the public and the private sector, for the access to the medical diagnosis of AH. According to PNAD from 200815, 50.3% of the permanent private households in the South region were registered in the Family Health Program, and 30% of their inhabitants declared having an insurance health plan. Additionally, the population aging in the South region could also explain the increasing tendency in the prevalence of hypertension in this location. Census 2010 pointed out that 8.1% of the population in this region is composed of people aged 65 years old or more22.
physical activity, and also to the higher access to health services1,6,24,25. However, literature reports that AH has been inversely associated with the schooling of the adult population in São Paulo. Despite that, self-reported AH demonstrated to be an adequate indicator for the surveillance of this disease26.
The World Health Organization (WHO) indicates that the prevalence of hypertension is higher in low and mid-income countries. However, what generates the decreased prevalence of this disease in high income countries are interventions in the public health field27. In order to reach the objective of a 25% relative reduction in the prevalence of high blood pressure, interventions are required to reduce the intake of salt and saturated fat, and also to increase the intake of fruits and vegetables. Eforts to reduce overweight and obesity as well as screening to detect and treat hypertensive people early are also necessary28.
The study demonstrated higher frequency of AH among women, which is diferent from data from WHO for 2008. The latter shows that for adults older than 25 years old, the highest prevalence is among men, both in the world (29.2% for men and 24.8% for women) and in the American region (26.3% for men and 19.7% for women)27. The diference between sexes in the prevalence of hypertension can be explained by the diversity of risk factors among men and women. A plausible explanation is that women recognize their condition of being hypertensive more than men21, since they attend health services more often8,12,24.
The main limitation of this study refers to the use of self-reported morbidity to the detriment of biomedical criteria to diagnose the disease. Therefore, the presented data concern only diagnosed cases. Despite the self-reported information, which, in the case of arterial hypertension, may be overestimated in up to 10%, this measure has been used in other studies and has been considered to be adequate8,25, with similar results15,19. Therefore, the high level of awareness of the population about their hypertensive state showed good access to health services and good AH detection6.
In the United States, a study comparing self-reported AH results in the telephone survey, Behavioral Risk Factor Surveillance System (BRFSS), and the National Health and Nutrition Examination Survey III, which measures blood pressure, point out to good sensitivity and speciicity when it comes to measures16,29. The study demonstrated that arterial hypertension increased with age, which was compatible with literature due to the natural history of the disease and the accumulation of risk factors3,21. For hypertension, literature showed that self-reporting is a satisfactory indicator for prevalence estimates, with the advantage of obtaining information fast and with low cost8,30.
PREVALENCE OF SELF-REPORTED ARTERIAL HYPERTENSION IN BRAZILIAN CAPITALS IN 2011 AND ANALYSIS OF ITS TRENDS IN THE PERIOD BETWEEN 2006 AND 2011
living in each capital (according to the census by IBGE). With that, it was possible to reduce the diferences between population with and without landlines14,31.
Other comparative studies between data from Vigitel and household surveys indicated the importance of weighing to reduce vice in some variables, especially those associated with low income and low schooling32,35. The monitoring of Vigitel data makes it possible to analyze tendencies, even though the six-year time for analysis is short to provide a more robust description of tendency, therefore, there may be changes in the historical series.
It is also important to mention the monitoring NCCDs and their risk factors as part of the promises made by Brazil, especially in the plan to face the NCCDs and in national and international goals and those established to reduce the mortality of NCCDs, the reduction of arterial hypertension and the control of risk patients, keeping them in control programs28,33-36. However, by considering the complexity and the diicult logistics of regular household surveys with objective measures of blood pressure, information resulting from Vigitel can contribute with planning, monitoring and evaluation of national actions for its control.
1. Organização Mundial de Saúde. Global status report on noncommunicable diseases 2010. Genebra: WHO; 2011.
2. Schmidt MI, Duncan BB, Silva GA, Menezes AM, Monteiro CA, Barreto SM, et al. Chronic non-communicable diseases in Brazil: burden and current challenges. Lancet 2011; 377(9781): 1949-61. 3. Ribeiro AB. Atualização em hipertensão arterial: clínica,
diagnóstico e terapêutica. São Paulo: Atheneu; 2007. 4. Kearney PM, Whelton M, Reynolds K, Muntner P, Whelton PK, He J. Global burden of hypertension: analysis of worldwide data. Lancet 2005; 365(9455): 217-23. 5. Balu S, Thomas J 3rd. Incremental expenditure of
treating hypertension in the United States. Am J Hypertens 2006; 19(8): 810-6.
6. Ferreira SR, Moura EC, Malta DC, Sarno, F. Frequência de hipertensão arterial e fatores associados: Brasil, 2006. Rev. Saúde Pública 2009; 43(2): 98-106. 7. Lino MZ, Muniz PT, Siqueira, KS. Prevalência e fatores
associados ao excesso de peso em adultos: inquérito populacional em Rio Branco, Acre, Brasil, 2007-2008. Cad Saúde Pública 2011; 27(4): 797-810.
8. Lima-Costa MF, Peixoto SV, Firmo JO. Validade da hiper tensão ar terial auto-referida e seus determinantes (projeto Bambuí). Rev Saúde Pública 2004; 38(5): 637-42.
9. Piccini RX, Victora CG. Hipertensão arterial sistêmica em área urbana no sul do Brasil: prevalência e fatores de risco. Rev Saúde Pública 1994; 28(4): 261-7. 10. Yokota RT, Iser BP, Andrade RL, Santos J, Meiners
MM, Assis DM de et al. Vigilância de fatores de risco e proteção para doenças e agravos não transmissíveis em município de pequeno porte, Brasil, 2010. Epidemiol Serv Saúde 2012; 21(1): 55-68.
11. Castro RA, Moncau JE, Marcopito LF. Prevalência de hipertensão arterial sistêmica na cidade de Formiga, MG. Arq Bras Cardiol 2007; 88(3): 334-9.
12. Passos VM, Assis TD, Barreto SM. Hipertensão arterial no Brasil: estimativa de prevalência a partir de estudos de base populacional. Epidemiol Serv Saúde 2006; 15(1): 35-45. 13. Barreto SM, Passos VM, Firmo JO, Guerra HL, Vidigal
PG, Lima-Costa MF. Hypertension and clustering of cardiovascular risk factors in a community in Southeast Brazil: the Bambuí Health and Ageing Study. Arq Bras Cardiol 2001; 77(6): 576-81.
14. Lessa, I. Hipertensão arterial sistêmica no Brasil: tendência temporal. Cad. Saúde Pública 2010; 26(8): 1470. 15. Brasil. Instituto Brasileiro de Geograia e Estatística.
Pesquisa Nacional por Amostra de Domicílios. Um panorama da saúde no Brasil. Acesso e utilização de serviços, condições de saúde e fatores de risco e proteção à saúde 2008. Rio de Janeiro: IBGE; 2010.
16. Centers for Disease Control and Prevention. Behavioral Risk Factor Surveillance System (BRFSS) [Internet]. Disponível em: http://www.cdc.gov/BRFSS/ (Acessado em 20 de janeiro de 2008).
17. Centers for Disease Control and Prevention. Self-Reported Hypertension and Use of Antihypertensive Medication Among Adults - United States, 2005-2009. Morb Mortal Wkly Rep 2013; 62(13): 237-44. 18. Kearney PM, Whelton M, Reynolds K, Whelton
PK, He J. Worldwide prevalence of hypertension: a systematic review. J Hypertens 2004; 22(1): 11-19. 19. Brasil. Secretaria de Vigilância em Saúde, Ministério
da Saúde. VIGITEL 2011: vigilância de fatores de risco e proteção para doenças crônicas por inquérito telefônico. Brasília (DF): Ministério da Saúde; 2012.
20. Bussab WO, Morettin PA. Estatística básica. 5a ed. São Paulo: Saraiva; 2006.
21. Nogueira D, Faerstein E, Coeli CM, Chor D, Lopes CS, Werneck GL. Reconhecimento, tratamento e controle da hipertensão arterial: Estudo Pró-Saúde, Brasil. Rev Panam Salud Publica 2010; 27(2): 103-9. 22. Brasil. Instituto Brasileiro de Geograia e Estatística.
Sinopse do Censo Demográico 2010. Rio de Janeiro: IBGE; 2011.
23. Schmidt MI, Ducan BB, Hoffmann JF, Moura L, Malta DC, Carvalho RM. Prevalência de diabetes e hipertensão no Brasil baseada em inquérito de morbidade auto-referida, Brasil, 2006. Rev Saúde Pública 2009; 43(2): 74-82.
24. Chobanian AV, Bakris GL, Black HR, Cushman WC, Green LA, Izzo JL Jr, et al. Seventh report of the Joint National Committee on Prevention, Detection, Evaluation, and Treatment of High Blood Pressure. Hypertension 2003; 42(6): 1206-52.
25. Ferreira AD, César CC, Malta DC, Souza AA, Ramos CG, Proietti FA et al. Validade de estimativas obtidas por inquérito telefônico: comparação entre VIGITEL 2008 e inquérito Saúde em Beagá. Rev Bras Epidemiol 2011; 14(1): 16-30.
26. Selem SS, Castro MA, César CL, Marchioni DM, Fisberg RM. Validade da hipertensão autorreferida associa-se inversamente com escolaridade em brasileiros. Arq Bras Cardiol 2013; 100(1): 52-9.
27. Organização Mundial de Saúde. World health statistics 2012. Genebra: WHO; 2012.
28. Organização Mundial de Saúde. Prevention and control of non communicable diseases. Formal meeting of Member States to conclude the work on the comprehensive global monitoring framework, including indicators, and a set of voluntary global targets for the prevention and control of non communicable diseases. Report by the Director-General. Genebra: WHO; 2012. 29. Centers for Disease Control and Prevention. NHANES
III. National Health and Nutrition Examination Survey [Internet]. Disponível em: http://www.cdc.gov/nchs/ about/major/nhanes/nh3data.htm (Acessado em 20 de janeiro de 2008).
30. Vargas CM, Burt VL, Gillum RF, Pamuk ER. Validity of self-reported hypertension in the National Health and Nutrition Examination Survey III, 1988-1991. Prev Med 1997; 26(5 Pt 1): 678-85.
31. Bernal R, Silva NN. Cobertura de linhas telefônicas residenciais e vícios potenciais em estudos epidemiológicos. Rev Saúde Pública 2009; 43(3): 421-6. 32. Francisco PM, Barros MB, Segri NJ, Alves MC, Cesar CL, Malta DC. Comparison of estimates for the self-reported chronic conditions among household survey and telephone survey--Campinas (SP), Brazil. Rev Bras Epidemiol 2011; 14(1): 5-15.
33. Brasil. Ministério da Saúde. Plano de ações estratégicas para o enfrentamento das doenças crônicas não transmissíveis (DCNT) no Brasil, 2011-2022. Brasília (DF): Ministério da Saúde; 2011.
34. Malta DC, Morais Neto OL, Silva Junior JB. Apresentação do plano de ações estratégicas para o enfrentamento das doenças crônicas não transmissíveis no Brasil, 2011 a 2022. Epidemiol Serv Saúde 2011; 20(4): 425-38. 35. Nações Unidas. Political declaration of the high-level
meeting of the General Assembly on the prevention and control of non-communicable diseases. UN General Assembly A/66/L.1. 2011.
36. Organização Mundial de Saúde. 65th World Health Assembly closes with new global health measures [Internet]. Disponível em: http://www.who. int/mediacentre/news/releases/2012/wha65_ closes_20120526/en/index.html (Acessado em 30 de maio de 2012).
Received on: 01/15/2014