..
FUNDAÇÃO
GETULIO VARGAS
EPGE Escola de Pós-Graduação
em Economia
SI':f\IIN .. \RI()S
I) I· P 1· S () l i I S;\
,·: ('()N<H'vlJ('A
"Monopoly Power and Trade
Protection: Cross - Industry
Evidence"
\j
Prof. Pedro Cavalcanti Ferreira
(EPGE/FGV)
LOCAL
Fundação Getulio Vargas
Praia de Botafogo, 190 - 10° andar - Auditório Eugênio Gudin
DATA
10/08/2000 (53 feira)
HORÁRIO
16:00h
i
Monopoly Power and Trade Protection:
Cross-Industry Evidence.
*
Pedro Cavalcanti Ferreira
tGraduate School of Economics
Fundação Getulio Vargas
Abstract
This paper investigates the impact of industry concentration on trade policy. Annual panel-databases of Brazilian industries for the years 1988 through 1994 were used. The regressions reported here are robust to openness indic ator. concentration index, control variables and sample size , and suggest that the higher the concentration of a given industry the higher its leveI of trade protection. In the period of study the country experienced a major trade liberalization, but the results in the paper show that the reduction in protection was smaller in more concentrated sectors. Assuming that concentration is
;1 gCl()d proX\' for mOllopoh' po\\'er as it reduces the free-rider problem in coordinating a lobby the results in this paper indicates that interest groups with control over specific markets in fact are able to obtain policy advantages that reduce (international) competition.
·Some of the main ideas of this paper were fostered during conversations with Boyan Jovanovic , to whom I wish to give special thanks. We gratefully acknowledge also the comments of João Issler and Andre", Horowitz. Many thanks to Honório Kume and Gilson Geraldino da Sil"a for somp 01' tl1f' data used . and C!\fPq and PRONEX for financiaI support.
I
1
Introduction
The link between monopoly ,power and growth performance has been attract-ing the attention of an increasattract-ing number of economists in recent years. Of course the idea that the organized action of interest groups may have a long-term impact on income leveIs and growth rates is not new, being present in works on economic history such as Mokyr(1990) and Jones(1988). The last author states that in "all or most large societies the impulse for growth was apparent all along, but had to be unchained and allowed to come to fruition. These so-called obstacles [to growth] took the form of unhelpful values and institutions, especially religious values, the guilds and the Indian caste sys-tem." Noteworthy examples in the recent (theoretical) growth literature are Parente and Prescott(1998), Prescott(1998), Holmes and Schmitz(1995) and Teixeira( 1999).
In one way or another, all these papers include a sector or sectors with some degree of monopoly power over the supply of spme factor that can impose prices and block adoption of new technology. In Parente and Prescott (1998), for instance, a coalition of factor suppliers is the monopoly seller of its input services. The coalition can dictate work practices and member's wages and the monopoly right is protected by law, which makes it costly to enter with more productive technology. In Holmes and Schmitz(1995), trade between two areas and the extension of markets - or free movement of goods between these areas - reduces the resistance to new technology. Again, the sources of resistance are interest groups who stand to lose rents if a new technology is adopted.
A corollary of the last article is that barriers to trade such as tariffs, quotas or any non-tariff barriers imposed by those interest groups affect the country total factor productivity (TFP) leveI and growth prospects. This is exactly the point of Teixeira(1999), who shows that under a quota arrange-ment , the most productive technology will not be used and investarrange-ment and capital stock will be smaller than under free trade. Simulations of the model reproduce observed cross-country per capita GDP differences. Once again, the monopoly power , over factor supply, of some coalition groups are the imposing force behind the different trade regimes.
I
tested, among others, in Cavalcanti Ferreira and Rossi(1999), using a panel data set of Brazilian manufacturing industries. The hypothesis that higher leveIs of tarifIs and efIective rate of protection imply smaller TFP and labor productivity growth could not be rejected. Similar results were obtained by Lee(1998), using Korean industry dataI.
In the present paper we test the first step of the argument above, more exactly, the link between monopoly power and trade protection. We want to investigate if there is any evidence from Brazilian manufacturing data that industries with higher monopoly power are more protected than those in competitive sectors.
We construct and estimate two groups of data sets for Brazilian industries. The first one is a small cross-section at a leveI that corresponds to the two-digit classification used in the U.S. The other group is composed of annual or bi-annual panel data sets at a higher disaggregation leveI than the first group, in some cases with 21 cross-industry observations and in others with 42. In most of our regressions we use two alternative measures of trade protection, average nominal tarifIs and efIective rate of protection2. For the
cross-section case we have three measures of industry concentration but for the panel data only one, but given the high correlation among these series we lost no information.
In the period of analysis , 1988 to 1994, the country experienced a major trade liberalization with general tarifI reduction and elimination of non-tarifI restrictions. However , not all sectors were afIected equally, and while tarifI dispersion was reduced , some difIerences remained. The interesting point here is that protection from trade fellless in some sectors where concentration is high and the lobby strong (e.g. , motor vehicle) than in more competitive sectors (e.g .. textiles). The main question of the paper , hence, is to test if this anecdotal evidence extends to the whole manufacturing sector and is statistically significant.
It has to be said that this literature does not claim exactly that monopoly power of the form we use is the ultimate cause of barriers to trade or to
tech-1 Evidence of the negative effect of trade protection on growth at country leveI is also strong (see, for instance , Edwards (1997), Harrison (1995), and Taylor (1996) among many), but some of the data used in part of these studies have been criticized by Rodríguez and Rodrik(1999) for not measuring trade barriers accurately.
nology adoption. However, we follow Tefier(1993), among others, in assuming that greater concentration alleviates the free-rider problem in coordinating a lobby so that it refiects or is proportional to the political power of the industry lobbies.
This study relates to the literature of political economy of trade pol-icy (e.g., Brock and Magee(1978), Tefier(1993) and Grossman and Help-man( 1994)), which studies the endogenous determination of trade protection and is surveyed in Rodrick(1995). In Grossman and Helpman(1994), spe-cial interest groups make donations to election campaigns to obtain trade protection. The model predicts , among other things, that protection should be higher in industries represented by a lobby In this model, however, alI lobbies are equally infiuent and the relevant difference is whether a sector is organized or noto Koujianou Goldberg and Magi(1999) tested and could not reject the main conclusions of this model. Trefier(1993) and Marvel and Ray(1983) among others , found a positive relationship between seller con-centration and protection in U.S. industry. Moreover, Tefier(1993) finds that business lobbying had much more infiuence than organized labor on Amer-ican trade policy, which minimizes , to a certain degree, the problem caused by the lack of labor data in the present study.
This paper is organized in 4 sections in addition to this introduction. The next section discusses the data and some speculative evidence on the relationship of trade policy and industry concentration in Brazil. Section 3 presents the cross-section estimations, section 4 the panel data estimations and section 5 concludes.
2
Industry concentration and trade barriers
in the Brazilian manufacturing industry
•
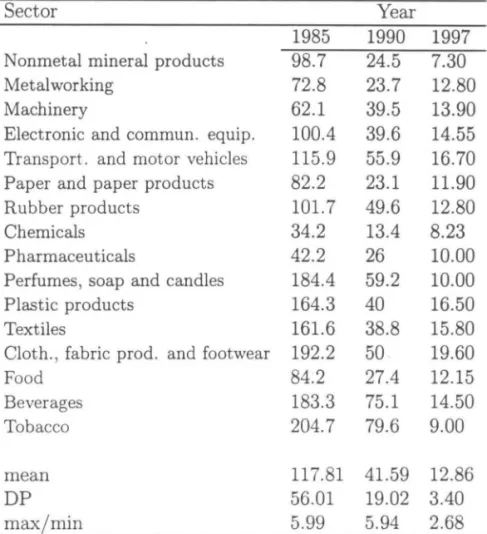
Table 1: Average Nominal Tariffs
Sector Year
1985 1990 1997 Nonmetal mineral products 98.7 24.5 7.30 Metalworking 72.8 23.7 12.80 Machinery 62.1 39.5 13.90 Electronic and commun. equipo 100.4 39.6 14.55 Transport. and motor vehicles 115.9 55.9 16.70 Paper and paper products 82.2 23.1 11.90 Rubber products 101.7 49.6 12.80 Chemicals 34.2 13.4 8.23 Pharmaceu ticals 42.2 26 10.00 Perfumes, soap and candles 184.4 59.2 10.00 Plastic products 164.3 40 16.50 Textiles 161.6 38.8 15.80 Cloth. , fabric prado and footwear 192.2 50 19.60 Food 84.2 27.4 12.15 Beverages 183.3 75.1 14.50 Tobacco 204.7 79.6 9.00
mean 117.81 41.59 12.86 DP 56.01 19.02 3.40 max/ min 5.99 5.94 2.68
The figures for effective rate of protection are even more teUing: in 1985 it was 427% for the Plastic Product industry and negative for the Tobacco and Beverages industries. In addition , the standard deviation was of the same order of magnitude as the average rate (about 100%). After liberalization, the average rate feU to less than 20% and the standard deviation to one third of this number.
If the reduction of protection is a general phenomenon, it did not affect alI the sectors in the same formo Take for instance the "automobiles, trucks and buses" and the "artificial textile fibers" sub-sectors. Between 1988 and 1990, the average tariff among the 46 sub-sectors - which together represent about 90% of the value added of the manufacturing sector - felI by a quarter
while increasing 21
%
in the "automobiles, trucks and buses" sub-sector. Thetariff in this sub-sector went from 1.53 times the mean tariff in 1988 to 2.40 times in 1993 and 1.7 times in 1994. On the other hand, the average tariff of" artificial textile fibers" sub-sector went from 1.43 the mean tariff in 1988
to less them 90% of the 1994 mean3.
Clear1y, there are forces specific to 'the "automobiles, trucks and buses" sub-sector partialIy offsetting the general movement of protection reduction of the Brazilian economy. Most probably those forces are weaker in the textile industry. We think that monopoly power and concentration may be that force. The figure below is illustrative:
300
250
200
'50
'00
• * * •
050
0001
""
8..,
.2 .3-+-cr4-Autom. ___ tariff-Aul0m. - . -0'4· Textilcs ~ wiff-Tcxtile$
Figure 1: Tariffs and concentration as a proportion of the median (textiles and motor vehicles)
"
Figure 1 presents the evolution of nominal tariffs and concentration of both sectors as a proportion of the median indices of the industry. The con-centration index used is the proportion of the sector revenue appropriated by the four largest firrns (CR4). Note that while concentration in the "au-tomobiles, trucks and buses" sector is at least twice as large as the median concentration of the manufacturing industry, in the artificial textile fibers industry it was on average only 75% of the mediano At the same time, while average nominal tariffs of both sectors were almost the same in 1988, about 1.5 times the median, in 1994 it was twice the median in "automobiles, trucks and buses" and exactly the median in the textile industry. In summary, the decrease in tariffs is notably larger in the less concentrated industry.
The strong monopoly power of the "automobiles, trucks and buses " in-dustry is refiected in the behavior of Anfavea, the official inin-dustry federation. Anfavea is in fact a powerful lobby and has been able to obtain a number of advantages in terms of the timetable of tariff reduction, tax breaks and subsidies that sectors with less polítical musde were not able to achievé. In the sub-sector of "Auto-parts", for instance, tariffs dropped steadily and fast and most of Brazilian firms either dose down or were sold to foreign-ers companies as they could not face competition from imports. This, of course, benefited even further the "automobiles, trucks and buses" sector. The question that we want to investigate econometrically now is whether this relationship extends significantly to the other sectors of the Brazilían manufacturing industry.
3
Industry concentration and tariffs: cross
section data
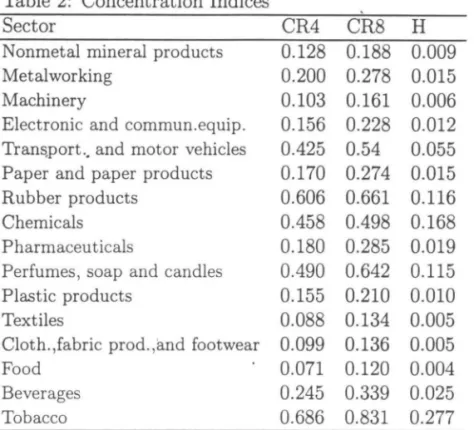
Table 2 below presents 3 different concentration indices for the same 16 man-ufacturing sectors displayed in Table 1. They were ca1culated with 1985 data.
..
•
Table 2: Concentration lndices
Sector CR4 CR8 H Nonmetal mineral products 0.128 0.188 0.009 Metalworking 0.200 0.278 0.015 Machinery 0.103 0.161 0.006 Electronic and commun.equip. 0.156 0.228 0.012 Trans,port .. and motor vehicles 0.425 0.54 0.055 Paper and paper products 0.170 0.274 0.015 Rubber products 0.606 0.661 0.116 Chemicals 0.458 0.498 0.168 Pharmaceuticals 0.180 0.285 0.019 Perfumes, soap and candles 0.490 0.642 0.115 Plastic products 0.155 0.210 0.010 Textiles 0.088 0.134 0.005 Cloth. ,fabric prod. ,and footwear 0.099 0.136 0.005 Food 0.071 0.120 0.004 Beverages 0.245 0.339 0.025 Tobacco 0.686 0.831 0.277
Although there are (serious) potential problems of aggregation, as the sec-tors are very broad, the data above are a good starting point. The C R4 and
C R8 indices measure the proportion of the sector revenue appropriated by the four and eight largest firms , respectively. The H index is the Herfindal indexs. As expected they are highly correlated across industries and , for instance, correlation between C R4 and C R8 is above 0.98. It is worth men-tioning the extremely high dispersion of these indices: the standard deviation of CR4 (0.20) is higher than the median index (17.5) and the maximum is almost ten times higher than the minimum: while in the Tobacco industry the four largest firms generate almost 70% of the sector revenue, in the Food industry they generate only 7%.
We want to test if industry concentration is correlated to tariffs leveI. Although the degrees of freedom of regressing tariffs displayed in Table 1 on the concentration data in Table 2 are too small, it is useful as a first
•
•
approximation. A good result here could give us a hint about the type and size of the true relationship. We tested for endogeneity of C R4, C R8 and
H using the Hausman test .(more on this in the next session) and the result rejected this hypothesis, so we used ordinary least squares in all regressions. We regressed 1985 and 1988 tariffs (NT85 and NT88) on the concentration indeces. As already mentioned, trade liberalization started in 1988, so we wanted to test if past concentration in any way affected the new tariffs. We are implicitly assuming that monopoly power today affects legislation with a lag, due maybe to the long political process of lobbying, debate in Congress and with bureaucrats, and voting. I~ all regressions we controlled for the sector capital requirement (RAK, defined as the prod uct of the mean size of the efficient plant and the sector capital intensity). All variables are in logs.
Table 3: Regressions of concentration on nominal tariffs Dependent Independent Variables R2
CR4 CR8 H RAK
NT85 0.44 -0.42 0.57
(2.67) (-4.19)
NT88 0.30 -0.29 0.74
(3 .78) (6 .08)
NT85 0.46 -0.40 0.54
(2.38) ( -3.98)
NT88 0.32 -0.28 0.72
(3.45) (5.70)
NT85 0.22 -0.43 0.55
(2.43) ( -3.99)
NT88 0.15 -0.30 0.70
(3.23) ( -5.49)
The results favor the hypothesis of monopoly power affecting trade pro-tection. For all measures of concentration and both years the estimated coefficients are positive and significant. Moreover , the magnitudes estimated are relatively high: a 100% difference in the industry concentration implies tariffs 30% to 45% higher for the C R4 and C R8 indices and 20% for the H
protection (or smaller reductions in tariffs) during the process of trade liber-alization(j. Note also that the R2 is consistently higher when the dependent variable is NT88.
Following the endogenous trade literature, we induded in the regressions a measure of import penetration. The estimated coefficient was never signif-icant at the usual leveIs, in contrast with the studies for the U .S. economy.
It did not affect, however, the estimated coefficients of the concentration indices and RAK .
The results for effective rate of protection are not as good as the previous one. There is not much difference when the 1988 series (ERP88) is the de-pendent variable: the estimated coefficient of the concentration index used is always significant, positive and the magnitudes are dose to those in Table 3. aIthough the R2 is smaller (about 0.50). However, when the dependent variabIe is the 1985 effective rate of protection (ERP85), the estimated co-efficient is only significant (and at 10%), when CR4 is used, but not when C R8 and H are. These results may indicate, on the one hand, that the link between monopoly power and protection is mostly obtained directly through tariffs on its products , and not indirectly through tariffs on inputs and other factors depicted by the effective rate of protection. On the other hand , it may indicate that in this case only the lag-effect hypothesis makes sense. TabIe 4 beIow displays the resuIts for C R4.
TabIe 4: Regressions of effecive rate of protection on concentration
Dependent Independent Variables
CR4 RAK
0.73 -0.43
(1.79) (-1.92) 0.28 ERP85
0.43 -0.30 (2.83) (-3.61)
ERP88 0.53
As aIready said, the small degree of freedom of the above regressions does not give us much confidence in the specification tests. However, the
results displayed above, and particularly those using nominal tariffs, are a first indication that there is a potential link between trade protection and monopoly power. Moreover, the positive impact of concentration measures on future tariffs and effective rates of protection hints that a dynamic model may fit the data better.
4
Industry 'concentration and tariffs: panel
data
The panel data set used in this section was constructed with data from two different sources. Average nominal tariff and average effective rate of protec-tion data were obtained from Kume(1996) and span from 1988 to 1994. It
originally included 56 sub-sectors, but eight of these were either agricultural or mining sectors and so were eliminated .. Moreover, gasoline and oil im~orts
are public monopolies and hence were also eliminated. The median nominal tariff of the 46 remaining industries went from 41% in 1988 to 13% in 1994. In 1988 the lowest tariff was that of the "Fertilizers" industry (14%) and the highest that of "Other Textile Products" sector (80%) while in 1994 they were, respectively, that of the "Artificial Textile Fibers " industry (2.26%) and that of the "Processed Milk" sector (30%). The behavior of effective rate of protection is similar: its median went from 52.65% in 1988 to 15.29% in 1994.
Data for concentration were limited to the CR4 indexo Given its high correlatioll to CR8 and H and the close results of the cross-section estimations with the three concentration indices , this does not seem to be a problem. The data base spans from 1986 to 1995 and includes 51 sub-sectors. In this period the median (and the mean) CR4 changed little although there was some fluctuation. However, in certain sectors it doubled (" Processed Rice") or almost doubled ("Machines and Equipment") and in others ("Sugar") it declined to 67% of its 1986 value.
in-dustries. In addition to concentration, we have data on capital-output ratio
(KY), on total machine and equipment purchased as proportion of revenues
(M P) , investment-output ratio (I NV) and also a profitability measure
(J)1.
These series were constructed from "Pesquisa Industrial Anual" data (Annual Industry Survey, FIBGE) and obtained from Geraldino da Silva(1999).
Our data , therefore, consist of a panel of 21 industries for seven years (from 1988 to 1994) . There are basicalIy two main techniques for panel esti-mation. One is the fixed-effects method, which is essentialIy an OLS regres-sion with cross-section dwnmies. The other is the random-effects method in which the intercept is considered a random variable and the generalized least square method is used. According to Hsiao (1986) the former is the proper procedure when estimating regressions with a specific number of sectors of firms and the inference is restricted to the behavior of this set. On the other hand , if the study is concerned with a large number of individuaIs or firms , so that they could be viewed as a random sample of a larger population, the latter method is recommended.
We ran the Hausmann specification test in order to decide between the two methods. When nominal tariff was the dependent variable the result favored the fixed-effects method , which we therefore used in alI regressions. When effective rate of protection was used the results were ambiguous de-pending on the control variables included in the regression and the time period of the sample. For the sake of comparison, only the estimations that used the fixed-effect method wilI be presented , but some of the results with the alternat e method will also be discussed.
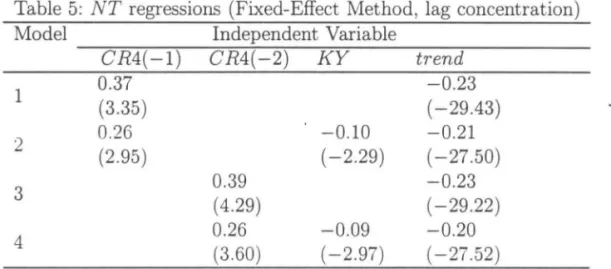
III section ;) we argued that it is possible that monopoly power today affects not current but future legislation , due to the long polítical process of lobbying, debate in Congress , negotiations with government officials and voting. The evidence in favor of this hypothesis was found to be strong when using cross-section data. For these reasons we chose to present first regres-sions with lagged CR4. We used the folIowing equation in alI estimations:
i = 1, ... , 21 , t = 1988, ... , 1994
where
Til
is one of the two openness indicators for sector i at time t , Zit is avector of independent variables that always contain the (lagged) concentra-tion index and may or may not contain addiconcentra-tional control variables, f3i is the industry-specific fixed effect, and E is the error termo Table 5 below presents
the results for NT (variables are in log, except the trend) 8:
Table 5: NT regressions (Fixed-Effect Method, lag concentration) Model Independent Variable
1
2
3
4
CR4(-1) CR4(-2) KY
0.37 (3.35) 0.26 (2.95 ) 0.39 (4.29) 0.26 (3.60) -0.10 ( -2.29) -0.09 ( -2.97) trend -0.23 ( -29.43) -0.21 ( -27.50) -0.23 ( -29 .22) -0.20 ( -27.52)
Note: t-statistic in parentheses; 21 cross-section observations
The results above favor the hypothesis that monopoly power (i.e.,past industry concentration) impacts nominal tariffs, as the estimated coefficient of CR4 is positive and significant at 5% in all regressions. Moreover, the estimated impact is large: for a given capital-output ratio, a difference of 20% in CR4 between industries implies 5% to 7% higher tariffs ..
The inclusion of a time trend was meant to capture macroeconomic and policy changes that affected the economy as a whole in the period. As already said, starting in 1988 there was a generalized reduction in trade barriers for the manufacturing sector. In our sample, the median tariff goes from 45.8% to 10.6%. But this did not affect all sectors equally, as tariffs of some sectors \Vere ill 1994 still two or even three times above the median tariff. The presence of the time trend in the regression simply excludes the common element of this phenomenon. In fact , the estimated coefficient had the expected sign and was highly significant in all regressions. It says that
there was a 20% negative trend in the nominal tariff value in the period9.
In this sense, it is maybe more exact to interpret the estimated coefficient of CR4 as the impact of industry concentration differences around the trend: on average, all sectors had their tariffs reduced by 20% a year, but the reduction was smaller in those industries were CR4 was higher.
The results are robust to the inclusion of additional variables. Different
models with(various combinations of) INV, MP,
J
and KP were tested, andthe estimated coefficient of CR4 did not change considerably and always remained significant. The negative estimated impact of the capital output
ratio (models 2 and 4) follows Tefler(1993). It may be indicating that KY acts
as an entry barrier for both domestic and foreign competitors, and not only domestic, so that it reduces the need for protection and hence the observed leveIs of tariffs.
Table 6 below presents the outcome of the ERP regressions (alI variables, but the trend, are in logs):
Table 6: ERP regressions (Fixed-Effect Method, lag concentration)
Model Independent Variable
1
2
3
4
CR4(-1) CR4(-2) KY
0.43 (2.96) 0.33 (3.11) 0.48 (5.12) 0.21 (5.09) -0.11 ( -2.48) -0.15 (-8 .10) trend -0.22 ( -22.82) -0.20 ( -27.50) -0.22 (-22.85) -0.17 ( -29.77)
Note: t-statistic in parenthesesj 21 cross-section observations
Results for effective rate of protection are similar to those for nominal tar-iff although the estimated coefficient of lagged CR4 is higher in most cases. The estimated trend remained around 0.20 and KY was found significant and negative in all models. As in the previous case , we tested for robustness
including different combinations of INV, MP,
J
and KP in several regres-sions and the estimated coefficient of CR4, trend and KP did not change considerably and always remained significant.The interpretation of the results in Table 6 also follows that of nominal tariffs: there is a common trend across industries of effective rate of pro-tection reduction, about 20% per year. However, in those industries where concentration is . higher the decrease in protection was smaller. A 10% dif-ference in concentration implies 2% to 5% difdif-ference in the effective rate of protection. We thus obtain an indication that a given industry' s monopoly power also infiuences the leveI of tariffs on its inputs, and not only on its own tariff. The anecdotal reference to the auto industry seems to extend with statistical significance to the other industries.
We now turn to regressions with contemporary CR4. One important
question to be addressed in this case is that of endogeneity. It can be argued
that the causation goes the other way around: higher tariffs would produce
less competition and consequently higher concentration. If this were the
case, then OL8 estimates would be biased and inconsistent. To test this hypothesis, we run a version of the Hausman test proposed by Davidson and
MacKinnon (1993) and used as instrument the variable
J,
which is correlatedwith CR4 but not with NT and ERplO. Again, the results are ambiguous.
For NT the test could not reject the hypothesis of consistent OL8 estimates but for ERP. depending on the time period, the test marginally rejects this hypothesis. To compare results, we will present in this case the OL8 and (weighted) two stage least square results.
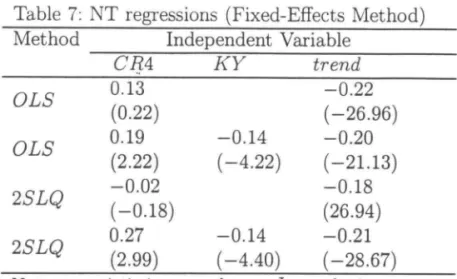
Table 7 below presents the results for NT.
Table 7: NT regressions (Fixed-Effects Method)
Method Independent Variable
C IJA KY trend
OLS
0.13 -0.22(0.22) (-26.96)
OLS
0.19 -0 .14 -0.20(2.22) (-4.22) (-21.13)
2SLQ
-0.02 -0.18(-0.18) (26.94)
2SLQ
0.27 -0.14 -0.21(2 .99) (-4.40) (-28.67)
Note: t-statistic in parentheses; J was the instrument in the two last equations. Variables are in logs.
Results are similar to those in Table 5 in the case of the second and fourth
equation, when KY is also one of the dependent variables.
In
these cases theestimated coefficient of concentration is significant and positive, the trend
found to be around 0.20 and barriers to entry (KY) also significative. Hence
we could not reject the hypothesis of past concentration affecting current trad<, policy.
However. unlike the case of past concentration, CR4 loses significance once KY is removed from the model. And this is still true when we introduce
other variables in the mo dei such as INV and J . One possible interpretation
is that in fact the model in which concentration affects trade policy without delay have no support by the data.
Results for effective rate of protection are similar, as shown by table 8 below:
Table 8:
ERP
regressions (Fixed-Effect Method)Method Independent Variable
OLS
(88-94)
OLS
(88-93)
OLS
(88-94)
CR4 KY trend
0.22 -0.14 -0 .19
(1.81) (-3.01) (-19.17)
0.20 -0.29 -0.17
(3.19) (-6.65) (-20 .60)
0.13 -0.22
(0.75) (-20.62)
The estimated coefficient of CR4 is around (or slightly above) 0.20 and that of the trend around 0.20 too (or slightly below). However, for the full sample the coefficient of CR4 is only significant at 7%. We induded a regression with a smaller sample to show that this result is not robust as in the 88-93 sample the coefficient was significant at the usual leveI. The problem here , however , is that once KY is exduded, CR4 estimates are not significant any longer , as in the previous case. We interpret this outcome as additional evidence against the idea of contemporary effect.
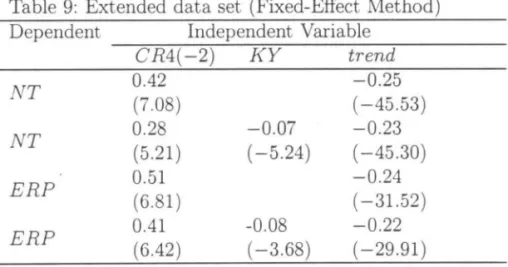
We also estimated the models above using an extended data set. In this case we induded sectors where the quality of the data was not as good as in the previous data set , but we obtained 20 extra cross-section observations. Problems with the data were mostly due to imprecise definition of industries , different aggregation leveIs between NT and ERP on the one hand and CR4 on the other, and imperfect matches between sectors (e.g., the CR4 and NT refer to different , but dose , sub-sectors of the same industry). In some cases , however, we are not even sure if there is any problem at an, we only have less confidence in the data. Moreover , tariff dispersion across sub-sectors is not very large, so that we believe the quality of these data is acceptable. Industries with more serious data problems were eliminated from the database. These 41 industries were responsible , in 1994, for 80% of the manufacturing industry value added , as opposed to 46% in the previous data set . The results are presented in Table 9 below:
Table 9: Extended data set (Fixed-Effect Method) Dependent Independent Variable
CR4 (-2) KY trend
NT 0.42 -0.25
(7.08) (-45 .53) 0.28 -0 .07 -0.23 (5.21) (-5.24) (-45 .30)
NT
0.51 -0 .24 (6 .8 1) (-31.52)
ERP
0.41 -0.08 -0 .22 (6.42 ) (-3 .68) (-29.91)
ERP
•
The estimated elasticity of the NT or ERP to CR4( _2)11, as in the reduced data set, is always positive and significant. Moreover, the values found were in general considerably higher than in Tables 6 and 7. For instance, one could expect that a sector twice more concentrated that another would have effective protection rates 50% higher than the latter. The estimated trend, as in all previous cases, is also around minus 20% a year in the 4 regressions and barriers to trade seems to play an important role. Once again, the link between industry concentration and trade protection appears to be solid.
5
Concluding Remarks
In this paper we estimated, using different data sets and econometric tech-niques. the impact of monopoly power on trade policy. We did not divide the industries between organized and non-organized sectors, but we assumed that the degree of industrial concentration of a sector reflects its political strength and the influence of the sector's lobby. We assumed that monopoly power is proportional to industry concentration. We also did not estimate a structural model. Instead, we estimated reduced form equations that we think reflect the ideas behind the literature on growth, which asserts that interest groups with control over specific markets obtain some form of monopoly rights that end up decreasing productivity. Our investigation here focuses on the first part of this reasoning - i.e., whether organized groups in fact are able to obtain policy advantages that reduce competition.
The results derived in the paper show that there is strong evidence that industries with higher monopoly power are those with higher trade protec-tion. This result is robust to changes in the database used, to estimation techniques, to changes in the dependent variable - nominal or effective tariffs - and, for the cross-section data base, to concentration indexo
In many regressions we controlled for capitoutput ratio, which was al-ways significant with negative estimated effect, following Tefler(1993). More-over, the inclusion of a time trend in the panel regression was essential to the results, as it controlIed for the generalized reduction in trade barriers observed in the country after 1988. Hence, another way of interpreting the panel data results is that although alI industries experienced reduction in trade protection, in those sectors with higher monopoly power the decrease in tariffs was smalIer. FinalIy, if we believe the literature that links higher
•
trade protection to smaller productivity growth, the result in this paper al-lows one to conclude that monopoly power has an indirect, and negative, infiuence on growth by way of its positive impact on nominal and effective tariffs.
References
[1] Brock, W. and Magee, S. (1978) "The Economics of Special Interest Politics: the Case of the Tariff," American Economic Review, 68, pp. 246-250.
[2] Cavalcanti Ferreira, P. and J.L. Rossi(1999) "Trade Barriers and Pro-ductivity Growth: Cross-Industry Evidence," Mimeo, Fundação Getulio Vargas .
[3] Da\'idson. R. and J. G. :'lacKinnon (1993) "Estimation and lnference
in Econometrics," Oxford University Press.
[4] Edwards, S. (1997) " Openness , Productivity and Growth: What do We
Really Know?", NBER working paper
#
5978.[5] Geraldino da Silva, G.(1999) "Estrutura de Mercado e Desempenho: Evidências Empíricas Para Setores Industriais Brasileiros a Partir de Dados em Painel," Mimeo, CEDEPLAR-MG.
[6] Grossman , G. and E . Helpman(1994) " Protection for Sale," American
Economic Review, 84, pp. 833-850.
[7] Harrison, A. (1995) "Openness and Growth: a Time-Series, Cross-Country Analysis for Developing Countries ," NBER Working Paper 522l.
[8] Holmes, T. , and J. Schmitz Jr.(1995) "Resistance to New Technology and Trade Between Areas ," FRB of Minneapolis Quanerly Review, Win-ter , pp. 2-18.
[9J
Hsiao,C.
(1986) " Analysis of Panel Data," Cambridge University Press.[10] Jones , E.L.(1988) "Growth Recurring: Economic Change in World His-tory," Oxford University Press.
•
[11] Kurne, H.(1996) "A Política de Importação no Plano Real e a Estrutura de Proteção Efetiva," discussion paper 423, IPEA.
[12] Koujianou Goldberg and Magi(1999) "Protection for Sale: an Empirical Investigation." American Economic Review, 89, pp. 1135-1155.
[13] Lee, J.W. (1996) " Government Interventions and Productivity Growth,"
Journal of Economic Growth, pp. 391-414.
[14] Macedo, P.B.R. and S. S Portugal(1995) "Estrutura de Mercado e De-sempenho na Indústria Brasileira':'. Revista Brasileira de Economia, 49, pp. 685-696.
[15J Nlarvel , H.P. and E.J. Ray(1983) "The Kennedy Round: Evidence on the Regulation of Trade in the U .S. " American Economic Review, 73, pp. 190-197.
[16] Mokyr, J. (1990) "The Lever of Riches: Technology Creativity and Eco-nomic Progress ," Oxford University Press.
[17] Parente, S. and E.C. Prescott(1998) "Monopoly Rights: A Barrier to Riches," FRB of Minneapolis Staff Report 236.
[18] Prescott, E.C.(1998) "Needed: a Theory of Total Factor Productivity," FRB of Minneapolis Staff Report 242.
[19] Rodríguez , F. and D. Rodrik , (1999) "Trade Policy and Economic Growth: a Skeptic's Guide to the Cross-National Evidence," NBER working paper 7081.
[20] Rodrik, D. (1995) "Polítical Economy of Trade Policy," in G. Grossman , G. and K. Rogoff. eds .. Handbook of International Economics, VoI. 3, N ürth- Holland.
[21] Taylor. A. (1996) "On the Cost of Inward-Looking Development: Price Distortions. Growth and Divergence in Latin America, " mimeo, North-westem university.
•
•
•
[23] Tefier, D.(1993) "Ttade Liberalization and the Theory of Endogenous Protection: an Econometric Study of D.S. Import Policy," Journal of Political Economy, 10(1), pp. 138-160 .
[24] Tybout, J., J. De Melo and V. Corbo. (1991) "The Effects of Ttade Reforms On Scale And Technical Efficiency: New Evidence From Chile,"
Journal of Iniernaiional Economics, v31(3/4), pp. 231-250 .
r
FUNDAÇÃO GETULIO VARGAS
BIBLIOTECA
ESTE VOLUME DEVE SER
NA ÚLTIMA D~T~V~;~~fD~ BIBLIOTECA
•
~- -
---r----~~----+---
--1--+---+---- --1--+---+---1--+---+---1--+---+----I--1--+---+----t--1--+---+---1--+---+---1--+---+----+--1--+---+---1--+---+---1--+---+----
---I-t---+---- ---I-t---+---I-t---+---I-t---+----1---I-t---+----+---I-t---+---I-t---+---I-t---+----+---I-t---+---I-t---+---I-t---+---I-t---+----
---1-+---+--- ---1-+---+--- ---1-+---+---~r---1-+---+---1-+---+---t---1-+---+---1-+---+---1-+---+---1-+---+---!---1-+---+---1-+---+---1-+---+---1-+---+---
-~r--t----!----000302964
\\
\\\\\\\\\\\\\\\\\\\\\\\\\\\\\
\\\
\\\
..
N.Cham. P/EPGE SPE F383m