❊♥s❛✐♦s ❊❝♦♥ô♠✐❝♦s
❊s❝♦❧❛ ❞❡
Pós✲●r❛❞✉❛çã♦
❡♠ ❊❝♦♥♦♠✐❛
❞❛ ❋✉♥❞❛çã♦
●❡t✉❧✐♦ ❱❛r❣❛s
◆
◦✸✹✸
■❙❙◆ ✵✶✵✹✲✽✾✶✵
❚r❛❞❡ ❇❛rr✐❡rs ❛♥❞ Pr♦❞✉❝t✐✈✐t② ●r♦✇t❤✿
❈r♦ss✲■♥❞✉str② ❊✈✐❞❡♥❝❡
❏♦sé ▲✉✐③ ❘♦ss✐ ❏✉♥✐♦r✱ P❡❞r♦ ❈❛✈❛❧❝❛♥t✐ ●♦♠❡s ❋❡rr❡✐r❛
❖s ❛rt✐❣♦s ♣✉❜❧✐❝❛❞♦s sã♦ ❞❡ ✐♥t❡✐r❛ r❡s♣♦♥s❛❜✐❧✐❞❛❞❡ ❞❡ s❡✉s ❛✉t♦r❡s✳ ❆s
♦♣✐♥✐õ❡s ♥❡❧❡s ❡♠✐t✐❞❛s ♥ã♦ ❡①♣r✐♠❡♠✱ ♥❡❝❡ss❛r✐❛♠❡♥t❡✱ ♦ ♣♦♥t♦ ❞❡ ✈✐st❛ ❞❛
❋✉♥❞❛çã♦ ●❡t✉❧✐♦ ❱❛r❣❛s✳
❊❙❈❖▲❆ ❉❊ PÓ❙✲●❘❆❉❯❆➬➹❖ ❊▼ ❊❈❖◆❖▼■❆ ❉✐r❡t♦r ●❡r❛❧✿ ❘❡♥❛t♦ ❋r❛❣❡❧❧✐ ❈❛r❞♦s♦
❉✐r❡t♦r ❞❡ ❊♥s✐♥♦✿ ▲✉✐s ❍❡♥r✐q✉❡ ❇❡rt♦❧✐♥♦ ❇r❛✐❞♦ ❉✐r❡t♦r ❞❡ P❡sq✉✐s❛✿ ❏♦ã♦ ❱✐❝t♦r ■ss❧❡r
❉✐r❡t♦r ❞❡ P✉❜❧✐❝❛çõ❡s ❈✐❡♥tí✜❝❛s✿ ❘✐❝❛r❞♦ ❞❡ ❖❧✐✈❡✐r❛ ❈❛✈❛❧❝❛♥t✐
▲✉✐③ ❘♦ss✐ ❏✉♥✐♦r✱ ❏♦sé
❚r❛❞❡ ❇❛rr✐❡rs ❛♥❞ Pr♦❞✉❝t✐✈✐t② ●r♦✇t❤✿ ❈r♦ss✲■♥❞✉str② ❊✈✐❞❡♥❝❡✴ ❏♦sé ▲✉✐③ ❘♦ss✐ ❏✉♥✐♦r✱
P❡❞r♦ ❈❛✈❛❧❝❛♥t✐ ●♦♠❡s ❋❡rr❡✐r❛ ✕ ❘✐♦ ❞❡ ❏❛♥❡✐r♦ ✿ ❋●❱✱❊P●❊✱ ✷✵✶✵
✭❊♥s❛✐♦s ❊❝♦♥ô♠✐❝♦s❀ ✸✹✸✮
■♥❝❧✉✐ ❜✐❜❧✐♦❣r❛❢✐❛✳
Trade Barriers and Productivity Growth:
Cross-Industry Evidence.
¤Pedro Cavalcanti Ferreira
yGraduate School of Economics,
Funda»c~
ao Getulio Vargas
Jos¶e Luis Rossi
IPEA
A bst r act
T his art icle invest igat es t he impact of t rade prot ect ion on t he evolut ion of labor productivity and t ot al fact or product ivity (T FP) of t he Brazilian manufact uring sect or. An annual panel-dat aset of 16 industries for t he years 1985 t hrough 1997, a period t hat includes a major t rade liberal-izat ion, was used. T he regressions report ed here are robust t o openness indicat or (nominal t ari®s and e®ect ive prot ect ion rat e were used), cont rol variables and t ime period and suggest t hat barriers t o t rade negat ively a®ect s productivity growt h at indust ry level: t hose sect ors wit h lower bar-riers experienced higher growt h. We were also able to link t he observed increase of indust ry product ivity growth aft er 1991 t o the widespread re-duct ion on e®ect ive prot ect ion experienced in t he count ry in t he ninet ies.
Very Preliminary Draft (August 1999)
1 I nt r oduct ion
Import substitution was the foundation of development policy in Latin America and a large number of Third World countries after the Second World War. One of its main assumptions was the idea that growth could only be achieved by fast industrialization and by the reduction of the relative importance of agriculture. However, according to this doctrine, fast growth would not be achieved under free trade. On the one hand, making use of a static argument, not entirely clear or logical, under this regime the comparative advantage of poor countries would stay forever in the production of primary goods. On the other hand, more sophisticated reasonings would justify trade restriction based on infant industry
¤We grat efully acknowledge t he comment s of Samuel Pess^oa, Eust ¶aquio Reis and A jax
M oreira. T hanks also t o Hon¶orio K ume for some of t he dat a used and t o CNPq and PRONEX for ¯ nancial support .
and scale or learning factors. Moreover, in the early stages of development, importation of heavy machinery and other capital goods would be an essential part of the process so that, given the relative scarcity of foreign exchanges (due to a supposed decline in terms of trade, among other reasons), capital ° ow controls would have to be imposed.
These arguments echoed loud among policy makers in the region, so that by the early ¯ fties almost all the countries in Latin America had adopted one form or another of trade barriers. In some countries, Brazil for one, what was sup-posed to be a temporary policy became permanent. Instead of identifying those sectors where protection would make sense, there was widespread imposition of tari®s and quantitative controls (import ban, in many cases) to stimulate the domestic production of formerly imported goods. In most cases, these controls lasted until the beginning of the nineties. In Brazil, for instance, the so-called " lei do similar nacional" ( " law of similar domestic production" ) would grant market shares for Brazilian ¯ rms or impose extremely high tari®s in any sector where domestic production was present, with no phase-out timetable or incen-tives to reduce cost.
There is now evidence, however, at least for country-level data, that the imposition of trade barriers hurt rather than helped growth in the long run, and that for many countries the large degree of protectionism bears a good part of the blame for their disappointing macroeconomic performance. For in-stance, evidence regarding the positive relationship between open trade policy and growth rates at cross-country level has been documented recently by Ed-wards (1997), Frankel, Romer and Cyrus (1996), Harrison (1995), Lee (1993), Sachs and Warner(1965) and Taylor (1996), using various types of data samples
and techniques1. Perhaps a more anecdotal but also indicative piece of evidence
comes from picking some representative countries. Consider, for example, the four \ dragons" of South East Asia: Singapore, Taiwan, Hong Kong and Korea. According to Lee's (1993) own-import weighted tari® rates on intermediate in-puts and capital goods data, their average tari® rates are, respectively, 2%, 7%, 0% and 14%. Consider now the following, much less successful, list of countries: Argentina, Peru, Uruguay, India and Bangladesh. The numbers are: 29%, 41%, 21%, 132% and 41%.
In this paper we test the link of trade barriers and productivity growth at the industry level. We construct an annual panel dataset for 16 Brazilian industries at a level that roughly corresponds to 2-digit level in the classi¯ cation adopted in the United States. We use labor productivity data and two (estimated) series of total factor productivity (one of them includes a rough measure of human capital). Most of our regressions use two alternative measures of trade protection, average nominal tari®s and e®ective rate of protection, to test for its
impact on labor productivity and total factor productivity (TFP) growth2. We
1See also Edwards(1993) for a survey of empirical result s on t his subject and K rueger(1997)
for a hist orical and t heoret ical discussion.
do not have data on quantitative restrictions, but this is not a serious problem in the present case because in the period of study - 1985 to 1997 - tari®s were the main policy instruments and most quantitativebarriers werealready abandoned, although some important exceptions remained.
There are few recent studies at micro level of the impact of trade policy on productivity growth, Lee(1996) being an exception. He used Korean industry data to estimate the impact of public policies - credit and trade policies, among them - on the growth of value-added, total factor productivity and capital stock growth and ¯ nds that the impact of trade policy (nominal tari® and non-tari® barriers in this case) is negative and signi¯ cant.
One of the main advantages of using this type of data is to control better for institutional and country-speci¯ c factors that have been found important in pre-vious growth studies. At cross-country level, the studies by Douglas North:(e.g., North[1981] and North[1990] ) have stressed the importance of institutions and institutional changes (e.g., respect to contracts and property rights) as a major factor explaining growth. More recently, Hall and Jones(1998) shows that a qualitative index of " institutional infrastructure" composed of measures of bu-reaucratic e± ciency, degree of respect to contracts and rule of law, explains a large part of labor productivity dispersion across countries.
With a cross-industry panel dataset, institutional factors are basically the same for all cross-section observations, and institutional changes in the time-series dimension in general will a®ect industries in the same way so that the
structure of incentives is similar across industries3. Moreover, valuable
infor-mation is not lost as in aggregate data and, therefore, there is no aggregation bias. Finally, given that the decision units in theoretical models are individuals and ¯ rms, the more disaggregate the regression the closer we are to theory. Of course, ¯ rm-level data would be ideal, but there are no reliable data available and, in this case, industry-level data are less likely to have serious problems of measurement error.
This paper is organized in 3 sections, in addition to this introduction. The next section discusses the data used and presents the main stylized facts. Just to anticipate some of those, by 1990 the country experienced a major commercial liberalization, when average nominal tari®s to the industry felt from 105% to 14% while the e®ective rate of protection experienced an average reduction of 75%. At the same time, productivity growth rates, negative for most industries before 1990, reached extremely high levels after this year. Section three tests the statistical signi¯ cance of this relationship while at the same time estimating
linking poor growt h performance and t rade policy. His crit icism is cent ered on t he est imat ion t echniques and mainly on t he dat a used in t hese st udies, e.g. black-market premium, t hat might not be measuring t rade barriers accurat ely. T his is not t he case in t he present st udy, bot h series used - nominal t ari® and e®ect ive prot ect ion rat e - are t radit ional measures of commercial rest rict ions.
3T hey may di®er, however, in t he degree of monopoly power and concent rat ion. A nd t his
productivity elasticity with respect to measures of trade protection. Section four concludes.
2 Pr oduct ivit y gr owt h and t r ade policy in B r azil
2.1 L abor pr oduct ivit y
Labor productivity and output series were constructed using information
ob-tained in the " Pesquisas Industrial Mensal - Produ»c~ao F¶isica" ( Monthly
In-dustry Survey - Physical Production) and " Pesquisas Industrial Mensal-Dados Gerais" (Monthly Industry Survey - General Data ), both from IBGE. We con-structed two measures of productivity: one used total hours worked and the
other " total labor force employed in production"4.There is no information on
value-added by industry, so that we used physical output as a proxy. This of course can be a problem. Bonneli and Fonseca (1997), however, show that for the industry aggregate there is no signi¯ cant e®ect. Moreover, at industry level, this would only be a relevant issue if the input-output relation within each sector changed considerably in the period, or if inputs that were previously produced in the sector started to be acquired outside it. Both facts are not true in the
present case5. Figure one below presents the evolution of average
productiv-ity, average hours, average employment and average output of the 16 Brazilian manufacturing industries for which there are data available for the entire period (1985 to 1997).
4T his series does not include administ rat ive workers and services such as security or
clean-ning, so t hat t he corresponding product ivity measure is not a®ect ed by t he observed t rend of sub-cont ract ing some of t hese services.
5It is int erest ing t o not e t hat , in a st udy for 19t h cent ury U.S., Engermen and Sokolo®
0 20 40 60 80 100 120 140 160 180
1985 1986 1987 1988 1989 1990 1991 1992 1993 1994 1995 1996 1997
h n y y/h y/n
Labor Productivity (Industry Average, 1985-1997)
In the picture above, h stands for hours, n for labor force and y for output. These 13 years can be divided in 3 sub-periods: 1985-1989, 1990-1993 and 1994-1997. In the ¯ rst one, labor productivity declined at an annual rate of -1.61% or -0.57%, in the output/ labor or in the output/ hours concepts, respectively. In this period output and employment increased, but the latter more than the former. Between 1990 and 1993, coinciding with the beginning of trade lib-eralization, average productivity increased at an annual rate of 5,11% (when using hours) or 4,80% (when using the employment concept). In this period the country was experiencing a recession but output reduction was more then compensated by employment reduction. Finally, the 1994-1997 period is one of very fast productivity growth (above 8.5% in both concepts). Employment kept its negative trend but in this case output increased in all industries. All in all, the two productivity measures have the same trend for the entire period.
2.2 Tot al Fact or Pr oduct ivit y
Total factor productivity is measured in the standard way. Assume Cobb-Douglas production function:
Yi t = Ai t:Ki t®:Hi t¯:L°i t; i = 1; :::; N ; t = 1; :::; T; (1)
where Yi t denotes output of sector i at time t; and K ; H and L stand for physical
capital, human capital and raw labor, respectively. Hence, in this formulation the residual A is equivalent to the TFP. Applying logarithm and di®erentiating with respect to time we obtain the expression below:
²
Yi t
Yi t =
²
TF Pi t
TF Pi t + ®:
²
Ki t
Ki t + ¯ :
²
Hi t
Hi t + ° :
²
Li t
Li t (2)
The capital series were constructed from investment data obtained in the " Pesquisa Industrial Anual ( " Annual Industry Survey" ) of the IBGE. We used the perpetual inventory method, assuming a constant annual depreciation rate of 5% per year and investment values were de° ated by the gross capital de° ator calculated in the national account. In order to removepossiblee®ects of business cycle ° uctuations on TFP, the stock of capital obtained was multiplied by the rate of utilization of sector capacity to obtain the fraction of physical capital e®ectively used in production.
As for human capital, there is no detailed information at the industry level, only aggregated information of average schooling years of the labor force for two main groups, " modern" and " traditional" industries, surveyed by the IBGE. The ¯ rst group includes the following sectors: transportation equipment, elec-tronic and communication equipment, mechanical machinery, plastic products and metalworking, the remaining sectors being classi¯ ed as traditional. Conse-quently, most of the variation is in the time-series dimension, given that for each year there are only two observations of the human capital stock. Instead of dis-carding this incomplete information, we opted to perform two sets of estimations of the TFP, one without human capital:
²
Yi t
Yi t =
²
TF Pi t
TF Pi t + ®:
²
Ki t
Ki t + ° :
²
Li t
Li t (3)
and the other using the above-mentioned series as human capital stock for each
industry, so that we obtain exactly equation (2)6.
Our data consist of a panel of 16 industries for 13 years (from 1985 to 1997). There are basically two main techniques for panel estimation. One is the
6We could also perform a M incer t ransformat ion in t he schooling series. However, given
¯ xed-e®ects method which is essentially an OLS regression with cross-section dummies. The other is the random-e®ects method in which the intercept is considered a random variable and the generalized least square method is used. According to Hsiao (1993) the former is the proper procedure when estimating regressions with a speci¯ c number of sectors of ¯ rms and the inference is re-stricted to the behavior of this set. On the other hand, if the study is concerned with a large number of individuals or ¯ rms, so that they could be viewed as a random sample of a larger population, the latter method is recommended. We ran the Hausmann speci¯ cation test, shown in the appendix, in order to decide between those two methods and the result favored the ¯ xed-e®ects method,
which we therefore used in all regressions7.
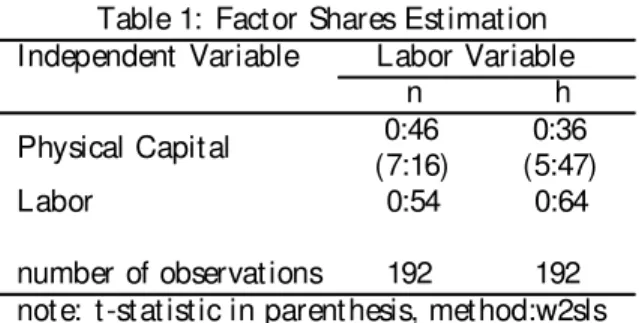
After testing for endogeneity of output growth rates, and rejecting the OLS method being consistent, we estimated factor shares using instrumental meth-ods. In the present case the method chosen was the Weighted 2 Stages Least Squares, which also corrects for cross-section heteroskedasticity. In this case, lagged variables were used as instruments. Moreover, constant returns of scale were imposed. Estimated factor shares, from regressions of equation (3), are presented in Table 1 below. Both labor measures were used.
Table 1: Factor Shares Estimation
Independent Variable Labor Variable
n h
Physical Capital (7:16)0:46 (5:47)0:36
Labor 0:54 0:64
number of observations 192 192
note: t-statistic in parenthesis, method:w2sls
Results are slightly sensitive to the labor series used, as the estimated labor share is 0.10 points higher when we used hours (h) instead of labor force (n). In any case, the values found are not far from international evidence and national account estimates. For our purposes these small di®erences are not important as they did not change the behavior of the estimated TFP series, which is our ¯ nal objective here.
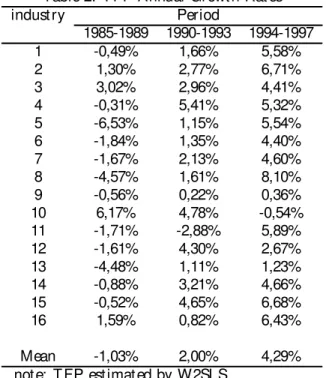
In both cases, TFP growth rate has the following behavior: between 1985 and 1989 it declined in almost all industries, in certain cases at annual rates above 3%. From 1990 to 1993 this trend is reverted, as we observe positive but small growth in all but one industry. The average growth rate jumps from minus 1% in the previous period to 2%. In the ¯ nal period, again all but one industry (sector 10, " perfumes, soap and candles" ) had positive TFP annual growth, but the rates now are considerably higher as the average growth more
7Hence, we are implicit ly associat ing T FP growt h t o t he count ry-speci¯ c ¯ xed e®ect and
than doubled. In exactly half the sectors, annual growth rates are above 5%, an impressive performance. Note also that the evolution of labor productivity in the period is very similar, although magnitudes vary. Table 2 below displays TFP annual growth rates by industry in the 3 sub-periods, for the case were
hours where used as labor variable8:
Table 2: TFP Annual Growth Rates
industry Period
1985-1989 1990-1993 1994-1997
1 -0,49% 1,66% 5,58%
2 1,30% 2,77% 6,71%
3 3,02% 2,96% 4,41%
4 -0,31% 5,41% 5,32%
5 -6,53% 1,15% 5,54%
6 -1,84% 1,35% 4,40%
7 -1,67% 2,13% 4,60%
8 -4,57% 1,61% 8,10%
9 -0,56% 0,22% 0,36%
10 6,17% 4,78% -0,54%
11 -1,71% -2,88% 5,89%
12 -1,61% 4,30% 2,67%
13 -4,48% 1,11% 1,23%
14 -0,88% 3,21% 4,66%
15 -0,52% 4,65% 6,68%
16 1,59% 0,82% 6,43%
Mean -1,03% 2,00% 4,29%
note: TFP estimated by W2SLS.
2.3 Tr ade Policy and Tar i®s
Import substitution and protection to infant industry were the foundation of industrial policy and development strategy in Brazil until the end of the eight-ies. Up to 1979, quantitative controls, reserved market shares and outright import bans were the dominant policy instruments. The so-called " lei do simi-lar nacional" ( " law of simisimi-lar domestic production" ) banned the importing of or imposed prohibitive tari®s on any industrial product competing with domes-tic production. After 1979, tari®s were re-established as the main instrument of trade policy and quantitative controls were gradually abandoned, but some remained. However, to compensate for the decrease in industry protection, nominal tari®s were raised to levels well above international standards. In 1988
8Numbers, inst ead of t he names of t he indust ries, are used t o save space. In t he appendix
there began a process of trade liberalization. First timidly with the elimina-tion of redundant tari®s, but after 1990 the pace of the reform accelerated. All quantitative controls were de¯ nitely eliminated and a timetable established for tari® reduction. As a result, tari®s and exchange rates have since become the main instruments of trade policy in the country.
Table 4 below displays the average nominal tari® for the 16 industries be-tween 1985 and 1997. On average, tari®s in the ¯ rst period were almost eight times larger than in the 94-97 period. The highest tari®s in the ¯ rst ¯ ve years were observed in consumption industries such as tobacco (industry number 16), beverages ( industry 15), clothing, fabric products and footwear (industry 13), perfumes, soap and candles (industry 10) and textiles (industry 12). The lowest tari®s were those on intermediate industries such as chemistry (industry 8) and machinery (industry 3).
Table 4: Average Nominal Tari®s
Industry Period
1985-1988 1989-1993 1994-1997
1 87.70 18.97 7.18
2 65.15 21.33 12.41
3 58.88 31.59 16.76
4 91.73 34.69 18.31
5 105.53 40.65 24.69
6 75.80 17.34 10.48
7 95.58 37.12 12.63
8 32.48 16.70 6.63
9 43.28 22.92 8.58
10 158.83 44.40 8.58
11 142.93 34.79 16.38
12 142.03 39.54 15.18
13 166.55 45.31 19.55
14 77.50 23.51 12.53
15 159.50 54.66 13.93
16 176.10 60.55 10.16
mean 104.97 34.00 13.37
Sources: Pinheiro e Almeida (1994), K ume(1996). Dat a for 1997 were based on t he Mercosul common tari®s.
transportation industry ( industry 5) due to exceptions obtained in the Merco-sul Treaties by the automobile industry. Average nominal tari® in this case is almost twice as large than the overall average for the 16 sectors.
The study of e®ective protection rate behavior rather than nominal tari®s behavior is pehaps more important to understand the impact of trade policy on productivity growth. This is so because that measure takes into account not only the price of ¯ nal product but also that of the inputs used in its production. If we de¯ ne e®ective protection rate as the percent increase in domestic value-added due to (tari®and non-tari®) protection relative to free trade value-value-added, we have:
gj = (Vad¡ Val c)=VaL c
wheregj is e®ectiveprotection to industry j ; Vadis value-added at domestic price
in industry j and Val c is free trade value-added (i.e., at international prices).
The expression above is equivalent to:
gj = (tj ¡ X
al c i j:ti)=(1¡
X al c
i j)
where al c
i j = adi j:(1+ tj)=(1+ ti) is the free trade technical coe± cient, measuring
input i participation in ¯ nal price of industry j ( both at international prices); ad
i j is the distortionary technical coe± cient, measuring input i participation in
¯ nal price of industry j ; at domestic prices; tj is the nominal tari® in industry
j and ti is the nominal tari® of input i: Hence, e®ective protection is a better
measure of barriers to trade as it takes into account the incentives a®ecting ¯ nal product but also a®ecting inputs. For instance, an industry with high nominal
tari®s on ¯ nal price (high tj) and low nominal tari®s on its inputs ( low ti) has
high e®ective protection, while one with low tj but high nominal tari®s on its
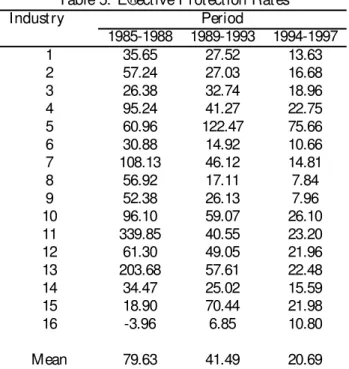
Table 5: E®ective Protection Rates
Industry Period
1985-1988 1989-1993 1994-1997
1 35.65 27.52 13.63
2 57.24 27.03 16.68
3 26.38 32.74 18.96
4 95.24 41.27 22.75
5 60.96 122.47 75.66
6 30.88 14.92 10.66
7 108.13 46.12 14.81
8 56.92 17.11 7.84
9 52.38 26.13 7.96
10 96.10 59.07 26.10
11 339.85 40.55 23.20
12 61.30 49.05 21.96
13 203.68 57.61 22.48
14 34.47 25.02 15.59
15 18.90 70.44 21.98
16 -3.96 6.85 10.80
Mean 79.63 41.49 20.69
Sources: Pinheiro e Almeida (1994), K ume(1996). Dat a for 1997 were based on t he Mercosul common tari®s.
On average, e®ective protection rates are today one fourth of the 1985 val-ues. The decrease, however, is not uniform, and at least in the transportation industry the e®ective protection rate is still high. As a matter of fact, it is now above the ¯ gure of ten years ago. The largest reductions were observed in the industries of plastic products (sector 11) and " clothing, fabric products and footwear" (industry 13). In the ¯ rst case the current rate is less then 7% of its 85-89 average. Note also that there is a decrease in the tari®s dispersion: the standard error to average ratio fell from 1.05 to 0.76 in the period.
3 Est imat ions
Following the same procedure as is section 2.2 we performed Haussman speci¯ -cation tests and the results once again favored the ¯ xed-e®ects method, which we therefore used in all regressions. We also ran the same diagnosis test to test for the endogeneity of trade variables. It could be the case that lower productiv-ity sectors, being less able to compete with imports, received higher protection. It is shown in the appendix that the OLS test is consistent, so we did not use any instrumental method to test for the links between productivity growth and trade policy. We started regressing either nominal tari®s (NT) or e®ective protection rates (EPR) on labor productivity or TFP growth rates. We then included other variables that previous empirical or theoretical studies found rel-evant to explain productivity growth. In addition to testing their signi¯ cance for the present case, this would also test the robustness of our results. If the inclusion or exclusion of variables changed dramatically the magnitude, sign or signi¯ cance of NT or EPR estimates, the results would be considered fragile and we would reject the link between them ( or openness) and productivity growth. We basically tested 3 additional variables: import ratio,export ratio and in° ation. The trade ratio variables are industry-speci¯ c indexes. They may be considered direct measures of openness but also, especially in the case of imports, indirect measures of technological adoption (see, for instance, Coe, D.T., E. Helpman, A.Ho®maister(1995) and Holmesand Schmitz (1995)). Other channel of imports a®ecting growth would be increasing returns { as in Romer and Rivera-Batiz (1991) or Grossman and Helpman (1991). Thenegativeimpact of in° ation on growth is well documented (e.g., Fischer(1993)). One possible channel would be the increase in uncertainty brought about by higher price volatility (Ramey and Ramey (1996)). For our regressions, 16 industry sector in° ation rates were constructed from industry prices indexes. Export ratios may also be used to test export led growth arguments.
In what follows we present three sets of regressions, with di®erent indepen-dent variables: labor productivity, TFP constructed without human capital and TFP with human capital. We used the following equation in all estimations:
¢
Yi t= ¯i + Á:Zi t + "i t; i = 1; :::; 16; t = 1985; :::; 1997 (4)
whereY¢i tis the growth rate of productivity (either labor productivity or TFP),
Zi t is a vector of independent variables that always contain one of the two
openness indicators, ¯i is the country-speci¯ c ¯ xed e®ect, and " is the error
term.
3.1 L abor pr oduct ivit y
" labor force used on production" as the labor variable. Just to be sure, we ran a set of regressions with the other productivity measure and the results as expected were very similar. Table 6 below presents the results.
Table 6: Labor Productivity Growth Regressions
Model Independent Variable
N T E PR M
1 ¡(¡0:0417:96)
2 ¡(¡0:0487:18)
3 ¡(¡0:0457:35) 0:001(1:29)
4 ¡(¡0:0375:42) 0:033(3:17)
not e: t -st at ist ic in parent hesis,N T: log of nominal tari®s,
E PR: log of e®ect ive prot ect ion rat e,M: log of indust ry-import rat io. 192 observations. Met hod: WLS
The results reported above con¯ rm the negative relationship between labor productivity and barriers to trade. They are also robust to changes in the set of control variables. In models 2 and 4 it can be seen that a 20% reduction in the e®ective protection rate implies an increase between 1% and 1.2% in the growth rate of labor productivity. The inclusion of import ratio, in° ation and/ or export ratio (not reported here) did not change the results, although the estimated coe± cients were smaller in general. Remember that in certain cases (see table 3) e®ective protection dropped from more than 200% to less than 25% and that, on the average, it fell from 75% to 20%. Hence, the present results would imply, for instance, that the 70% mean reduction in e®ective protection rate could explain a 3% to 4% increase in the labor productivity growth rate. Remember also that prior to trade liberalization labor productivity was falling at an annual rate of -1% and that in the last 4 years, it increased 8% per year on average.
The results of the regressions with nominal tari®s (models 1 and 3) are also signi¯ cant and robust to changes in controls. They also show that increases in protection imply slower productivity growth and the estimated elasticities are in the same order of magnitude as in models 2 and 4. A 20% reduction of the average nominal tari® of any industry would induce increases around 1% of its productivity growth rate. We have seen that the average tari® reduction in the period was around 85%, so that, according to the estimations above, this brought abound a 6% increase in the productivity growth rate.
TFP regressions. Uncertainty or own price increases do not seem to be an issue for industry productivity determination. The estimated coe± cient of import ratio had the expected sign and was signi¯ cant in some cases. Higher sector imports seem to be mildly correlated to increases in labor productivity. On the other hand, exports ratios were not robust and not signi¯ cant in almost all regressions9.
3.2 Tot al Fact or Pr oduct ivit y
Table 7 below presents the results of the estimations of equation (4) with TFP growth rate as the dependent variable.
Table 7: TFP Growth Regressions(w/ o Human Capital)
Model Independent Variable
N T E PR M
1 ¡(¡0:0316:23)
2 ¡(¡0:0406:10)
3 ¡(¡0:0305:55) 2; 30(0:66)
4 ¡(¡0:0385:41) 1:75(0:44)
not e:t -st at . in parent hesis,N T: log of nominal t ari®s,
E PR: log of e®ect ive prot ect ion rat e,
M log of indust ry import rat io.Met hod:WLS
Results are similar to those obtained with labor productivity. Wheter trade barriers are measured by e®ective protection rate or nominal tari®s, its esti-mated e®ect on total factor productivity growth is negative, robust to control variables and always signi¯ cant. The estimated coe± cients are slightly smaller,
but of relevant magnitude in any event: ¡ 0:03 in the regressions with nominal
tari®s, and¡ 0:04 in the regressions with e®ective protection rate. This is
some-what expected as now we are subtracting the e®ect of capital stock; moreover, TFP growth rates are on average considerably smaller than labor productiv-ity growth rates. Still, trade liberalization in the country can explain a large part of TFP growth: the decrease in the e®ective rate of protection observed in the period implies, according to our estimations, an increase of 3% of the TFP growth rate. If we use nominal tari®s the estimated impact is even larger, as tari® reduction was more dramatic than the drop in the e®ective protection rate
9Not e t hat t he above t able and t he next two do not present all regressions used t o t est
and the estimated elasticity is also higher in absolute value. Results for import ratio, export ratio and in° ation follow exactly those of the labor productivity case. For instance: the estimate e®ect of in° ation is not signi¯ cant at the usual con¯ dence interval.
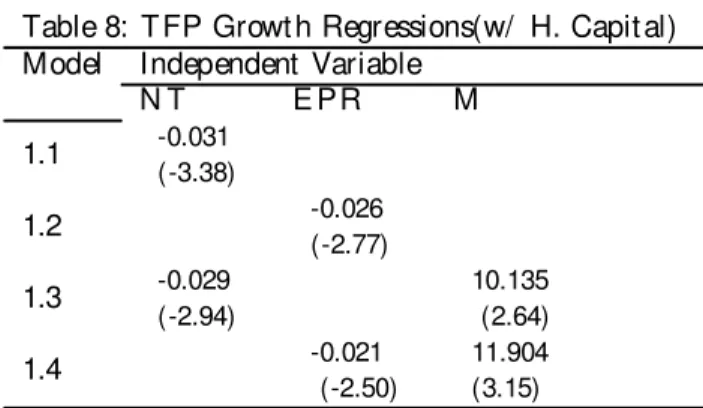
Table 8 below presents regression results of the case when TFP was
con-structed considering human capital10. They follow closely the results of the
previous table. Estimates of the TFP growth elasticity with respect to the ef-fective protection rate are smaller than corresponding estimates using nominal tari®s . According to the present results, increases of 20% in the latter variable would decrease TFP growth rate by 0.6% and increases of the same order of magnitude in the e®ective protection rate would reduce TFP growth rate by 0.5%. Although these values are small, it is still the case that they are not only robust and very signi¯ cant, but when we take into account the magnitude of the trade liberalization and tari®s reduction in the country, the estimated e®ect is still very relevant. For the plastics industry, for instance, where the e®ective rate of protection dropped by more than 90%, the estimated increase in TFP growth rates is above 2.3%.
Table 8: TFP Growth Regressions(w/ H. Capital)
Model Independent Variable
N T E PR M
1.1 -0.031
(-3.38)
1.2 -0.026
(-2.77)
1.3 -0.029
(-2.94)
10.135 (2.64)
1.4 -0.021
(-2.50)
11.904 (3.15)
Not e: t-st at. in parent hesis. See Table 7 for variables. Met hod: WLS
3.3 A lt er nat ive Fr amewor ks
One potential problem in using annual data to run TFP regressions is that business cycle ° uctuations that a®ect the behavior of output and factors may also a®ect the productivity measurement, although those ° uctuations have no long run impact on the productivity trend. This is the case if labor hoarding is a relevant fact or if capital services is measured by the stock of capital and not by the stock of capital e®ectively used in production. In this case, during
10T he result s of Table 8 are ext remely preliminary as we have no con¯ dence in t he T FP
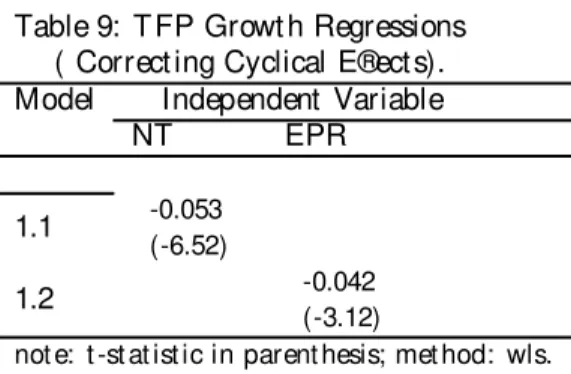
a recession, for instance, while output reduces, input levels are kept constant; consequently, measured TFP would also reduce. The opposite would occur during a recovery. In the present study the capital series used to construct TFP was already corrected by the capacity utilization rate . However, we may have a problem in the labor series, especially with the " labor force used in production" series. To check for this fact, we run a series of regressions with 3-year averages, in order to reduce potential problems caused by business ° uctuations. Table 9 below presents a sample of the results.
Table 9: TFP Growth Regressions ( Correcting Cyclical E®ects).
Model Independent Variable
NT EPR
1.1 -0.053
(-6.52)
1.2 -0.042
(-3.12)
not e: t -st at ist ic in parent hesis; met hod: wls. observations are 3-year averages.
The above regressions used the WLS method and results are robust to the inclusion or exclusion of control variables. The TFP series used does not employ human capital. The comparison with table 7 shows that the results are similar. The estimated coe± cients of the e®ective rate of protection are almost the same in the two tables and those of nominal tari®s are close to each other, while in table 9 it is slightly higher. This similarity can be explained either because we had already taken into account business cycle and short term ° uctuations when constructing the productivity series or because cyclical e®ects do not have a relevant e®ect on the correlation between trade protection and growth in the present context.
Another potential problem here is that when we ¯ rst estimate the TFP and then the e®ect of trade barriers on it, the errors of the two sets of regressions might compound on each other. The ¯ nal estimated elasticity, hence, might be estimated less precisely than if we just estimate a production function directly, substituting in the trade variable. In other words, we have been assuming the following relationship between productivity growth and, for instance, nominal tari®s:
²
TF Pi t
TF Pi t = ¯i + ÁN Ti + "i t
where ¯i is the country-speci¯ c ¯ xed e®ect and "i t is the disturbance term. So
²
Yi t
Yi t = ¯i + ÁN Ti + ®:
²
Ki t
Ki t + ° :
²
Li t
Li t + "i t (5)
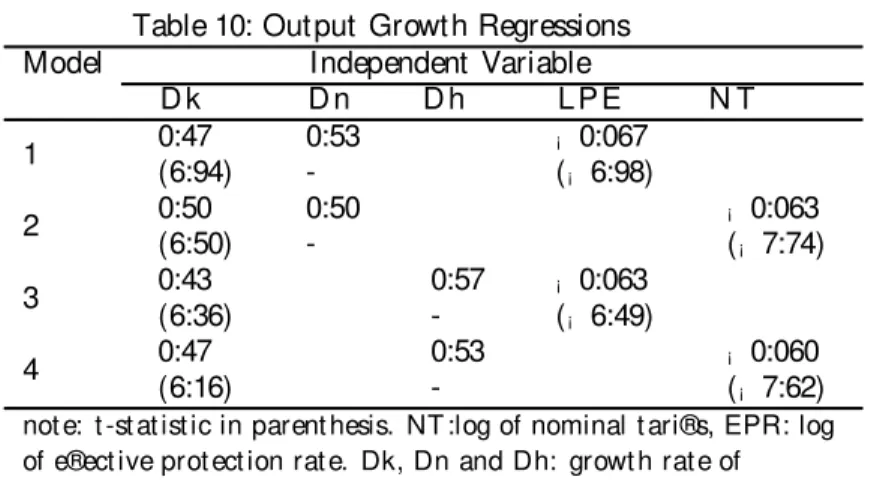
This type of model was used, for instance, in Harrison(1995) for a panel data of developing countries. In the present case, the e®ect of trade barriers on output growth when directly controlling for factors growth is estimated. Table 10 below presents the results of the estimation of equation (5) using our panel of Brazilian industries:
Table 10: Output Growth Regressions
Model Independent Variable
D k D n D h LPE N T
1 0:47(6:94) 0:53- ¡(¡0:0676:98)
2 0:50(6:50) 0:50- ¡ 0:063
(¡ 7:74)
3 0:43(6:36) 0:57- ¡(¡0:0636:49)
4 0:47(6:16) 0:53- ¡(¡0:0607:62)
not e: t -st at ist ic in parent hesis. NT :log of nominal t ari®s, EPR: log of e®ect ive prot ect ion rat e. Dk, Dn and Dh: growt h rate of physical capit al, labor force and hours, respect ively.
After testing, we used the w2sls method with lag variables serving as instru-ments for factors of production but no instruinstru-ments for the trade variables. We ran regressions using both hours and labor force as the labor variable. As can be seen from the four regressions above, the estimated e®ect of trade restriction measures on output growth is signi¯ cant and has the expected sign in all re-gressions. Moreover, the estimated coe± cients are considerably higher, being in the case of nominal tari®s, more than twice as big as those in table 7. In model
2, for instance, it is¡ 0:063, whereas in table 7 it was at most ¡ 0:031: The
sequential estimation (¯ rst the TFP, then trade barriers on TFP), if anything, hurt the case of negative growth e®ects of trade barriers as it can be biasing downward its true magnitude.
4 Concluding Remar ks
the protection of domestic production. Estimations in this article allow us to conclude that there is a signi¯ cant and robust relation between these two facts so that the higher the barriers to trade, the lower the growth rate of total factor productivity and labor productivity.
These results question the import substitution model as a long-run develop-ment policy. If it is true that Brazil experienced high growth rates after the war, our evidence says that this could be mainly due to accumulation of factors and that it occurred under low productivity growth. Import quotas and/ or bans and punitive tari®s gave no incentive for domestic ¯ rms to invest in technol-ogy adoption, while increasing the price and restricting the set of intermediate inputs available to production. Consequently, the low productivity level of do-mestic industries end up hurting these industries in the long run, especially after trade protection reduction and increased competition from import products. In other words: trade barriers implied slow or even negative productivity growth, with slow technical progress, and had a negative impact on the country's long run prospects.
The present results also show that, as the country moved to adopt a less restrictive comercial policy, the response was strong and impressive, and pro-ductivity growth rates changed from negative or negligible to positive and high. This is an optimistic result not only for Brazil but for Latin America, where most countries are now following similar trade liberalization policies.
The question left to be answered and that we intend to investigate in fu-ture research is why some industries had tari®s and e®ective protection so much higher than others. One possible answer is monopoly power: the more concen-trated the sector, the higher its political leverage and the greater its chance to obtain advantages in the form of tari® protection, tax breaks and subsidy.
Refer ences
[1] Bonelli, R and R. Fonseca (1998) " Ganhos de Produtividade ede E¯ ci^encia: Novos Resultados para a Economia Brasileira," mimeo, IPEA.
[2] Coe, D.T., E. Helpman, A.Ho®maister(1995) " North-South R&D Spillovers," NBER Working Paper 5048.
[3] Edwards,S.(1993) " Openness, Trade Liberalization and Growth in Devel-oping Countries," Journal of Economic Literature, 31, 3. pp. 1358-1393.
[4] Edwards, S. (1997)" Openness, Productivity and Growth: What do we Re-ally Know?" , NBER working paper # 5978.
[6] Frankel, D., D. Romer and T. Cyrus(1996) " Trade and Growth in East Asian Countries: Cause and E®ect?," NBER working paper 5732.
[7] Grossman, G. e E. Helpman(1991) " Small Open Economy," in Innovation and Growth in the Global Economy, pp. 144-176, MIT Press.
[8] Hall,R. and C. Jones(1996) " The Productivity of Nations, " NBER working paper 5549.
[9] Harrison, A. (1995) " Openness and Growth: a Time-Series, Cross-Country Analysis for Developing Countries," NBER Working Paper 5221.
[10] Holmes, T., and J. Schmitz Jr.(1995) " Resistance to New Technology and Trade Between Areas," FRB of Minneapolis Quarterly Review, winter, pp. 2-18.
[11] Kume, H.(1996) " A Pol¶itica de Importa»c~ao no Plano Real e a Estrutura de
Prote»c~ao Efetiva," discussion paper 423, IPEA.
[12] Krueger, A(1997) " Trade Policy and Economic Development: How we Learn." American Economic Review, 87, pp. 1-22.
[13] Lee,J(1993) " International Trade, Distortions, and Long-Run Economic Growth," IMF Sta® Papers, 40(2), 299-328.
[14] Lee, J.W. (1996) " Government Interventions and Productivity Growth," Journal of Economic Growth, pp. 391-414.
[15] Pinheiro. A. C. and G. B. Almeida(1994) " Padr~oes Setoriais da Prote»c~ao
na Economia Brasileira," discussion paper 365, Ipea.
[16] Ramey, G. and V. Ramey(1995), " Cross-Country Evidence on the Links Between Volatility and Growth," American Economic Review, 85(5), pp 1002-1037.
[17] Riviera-Batiz, L. A. and P. Romer (1991) " Economic Integration and En-dogenous Growth," Quarterly Journal of Economics, Vol. 106(2), 531-556. [18] Rodr¶iguez, F. and D. Rodrik, (1999) " Trade Policy and Economic Growth: a Skepitic¶s Guide to the Cross-National Evidence," NBER working paper 7081.
[19] Sachs, J. and A. Warner(1995) " Economic Convergence and Economic Poli-cies," NBER working paper 5039.
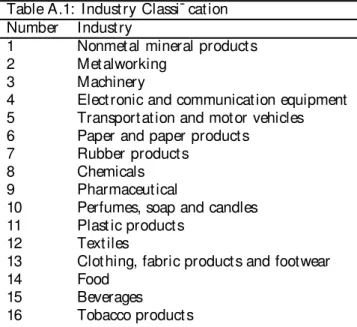
A
t able of indust r ies
Table A.1: Industry Classi¯ cation
Number Industry
1 Nonmetal mineral products
2 Metalworking
3 Machinery
4 Electronic and communication equipment
5 Transportation and motor vehicles
6 Paper and paper products
7 Rubber products
8 Chemicals
9 Pharmaceutical
10 Perfumes, soap and candles
11 Plastic products
12 Textiles
13 Clothing, fabric products and footwear
14 Food
15 Beverages